nForce4 SLI Motherboards: Premium Performance at a Bargain Price
by Gary Key on January 3, 2006 12:05 AM EST- Posted in
- Motherboards
Disk Controller Performance
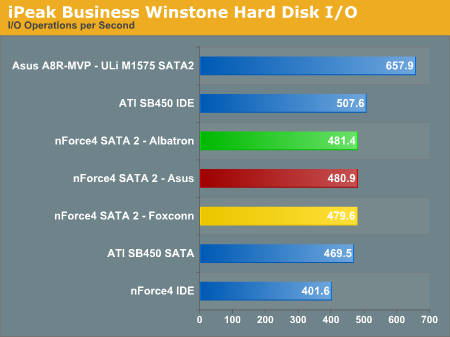
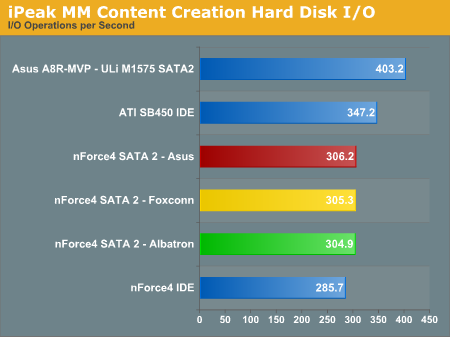
With the variety of disk drive benchmarks available, we needed a means of comparing the true performance of the wide selection of controllers. The logical choice was Anand's storage benchmark first described in Q2 2004 Desktop Hard Drive Comparison: WD Raptor vs. the World. To refresh your memory, the iPeak test was designed to measure "pure" hard disk performance, and in this case, we kept the hard drive as consistent as possible while varying the hard drive controller. The idea is to measure the performance of a hard drive controller with a consistent hard drive.
We played back Anand's raw files that recorded I/O operations when running a real world benchmark - the entire Winstone 2004 suite. Intel's iPEAK utility was then used to play back the trace file of all IO operations that took place during a single run of Business Winstone 2004 and MCC Winstone 2004. To try to isolate performance difference to the controllers that we were testing, we used the Seagate 120GB 7200 RPM SATA (8MB Buffer) in all tests. The drive was formatted before each test run and a composite average of 5 tests on each controller interface was tabulated in order to ensure consistency in the benchmark.
iPeak gives a mean service time in milliseconds; in other words, the average time that each drive took to fulfill each IO operation. In order to make the data more understandable, we report the scores as an average number of IO operations per second so that higher scores translate into better performance. This number is meaningless as far as hard disk performance is concerned as it is just the number of IO operations completed in a second. However, the scores are useful for comparing "pure" performance of the storage controllers in this case.
It is impressive that the ATI SB450 IDE performance tops the NVIDIA nForce4 SATA 2 performance in both benchmarks.
Firewire and USB Performance
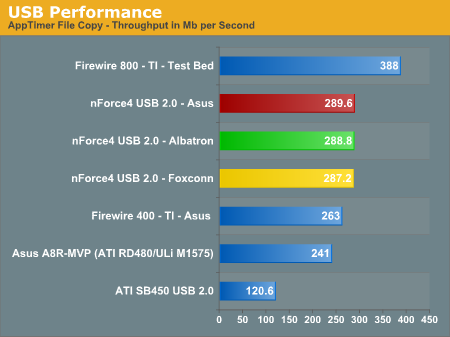
After looking at many options for Firewire and USB testing, we finally determined that an external USB 2.0, Firewire 400, and Firewire 800 hard disk might be a sensible way to look at USB and Firewire throughput.
Our first efforts at testing with an IDE or SATA drive as the "server" yielded very inconsistent results, since Windows XP sets up cache schemes to improve performance. Finally, we decided to try a RAM disk as our "server", since memory removed almost all overhead from the serving end. We also managed to turn off disk caching on the USB and Firewire side by setting up the drives for "quick disconnect" and our results were then consistent over many test runs.
We used 1GB of fast 2-2-2-5 system memory set up as a 450MB RAM disk and 550MB of system memory. Our standard file is the SPECviewPerf install file, which is 432,533,504 bytes (412.4961MB). After copying this file to our RAM disk, we measured the time for writing from the RAM disk to our external USB 2.0, Firewire 400, or Firewire 800 drive using a Windows timing program written for AnandTech by our own Jason Clark. The copy times in seconds were then converted into Megabits per second (Mb) to provide a convenient means of comparing throughput. Higher Rates therefore mean better performance in this particular test.
With the variety of disk drive benchmarks available, we needed a means of comparing the true performance of the wide selection of controllers. The logical choice was Anand's storage benchmark first described in Q2 2004 Desktop Hard Drive Comparison: WD Raptor vs. the World. To refresh your memory, the iPeak test was designed to measure "pure" hard disk performance, and in this case, we kept the hard drive as consistent as possible while varying the hard drive controller. The idea is to measure the performance of a hard drive controller with a consistent hard drive.
We played back Anand's raw files that recorded I/O operations when running a real world benchmark - the entire Winstone 2004 suite. Intel's iPEAK utility was then used to play back the trace file of all IO operations that took place during a single run of Business Winstone 2004 and MCC Winstone 2004. To try to isolate performance difference to the controllers that we were testing, we used the Seagate 120GB 7200 RPM SATA (8MB Buffer) in all tests. The drive was formatted before each test run and a composite average of 5 tests on each controller interface was tabulated in order to ensure consistency in the benchmark.
iPeak gives a mean service time in milliseconds; in other words, the average time that each drive took to fulfill each IO operation. In order to make the data more understandable, we report the scores as an average number of IO operations per second so that higher scores translate into better performance. This number is meaningless as far as hard disk performance is concerned as it is just the number of IO operations completed in a second. However, the scores are useful for comparing "pure" performance of the storage controllers in this case.
It is impressive that the ATI SB450 IDE performance tops the NVIDIA nForce4 SATA 2 performance in both benchmarks.
Firewire and USB Performance
After looking at many options for Firewire and USB testing, we finally determined that an external USB 2.0, Firewire 400, and Firewire 800 hard disk might be a sensible way to look at USB and Firewire throughput.
Our first efforts at testing with an IDE or SATA drive as the "server" yielded very inconsistent results, since Windows XP sets up cache schemes to improve performance. Finally, we decided to try a RAM disk as our "server", since memory removed almost all overhead from the serving end. We also managed to turn off disk caching on the USB and Firewire side by setting up the drives for "quick disconnect" and our results were then consistent over many test runs.
We used 1GB of fast 2-2-2-5 system memory set up as a 450MB RAM disk and 550MB of system memory. Our standard file is the SPECviewPerf install file, which is 432,533,504 bytes (412.4961MB). After copying this file to our RAM disk, we measured the time for writing from the RAM disk to our external USB 2.0, Firewire 400, or Firewire 800 drive using a Windows timing program written for AnandTech by our own Jason Clark. The copy times in seconds were then converted into Megabits per second (Mb) to provide a convenient means of comparing throughput. Higher Rates therefore mean better performance in this particular test.


37 Comments
View All Comments
DAPUNISHER - Thursday, January 5, 2006 - link
Off to peruse your Intel articles.DAPUNISHER - Wednesday, January 4, 2006 - link
I enjoyed your review, your 1st for AT? but for a moment, I though I was reading a retro review from AT. I liked it better when AT eschewed 3D synthetics, and chose to bench the latest, greatest titles. Even D3 and FarCry seem long in the tooth IMHO. Many do still play FarCry, but most use all the new tweaks.Perhaps there is logic to the methodolgy that I'm missing? TIA for any illuminating reply, and I look forward to your future reviews here :-)
Gary Key - Wednesday, January 4, 2006 - link
Hi,Actually, I have been covering the Intel reviews for the past few months. We are in the process of a transition over to the newer benchmarks. The last Intel article with those benchmarks can be found here-
http://www.anandtech.com/mb/showdoc.aspx?i=2631&am...">http://www.anandtech.com/mb/showdoc.aspx?i=2631&am...
The ability to go back and test all of the boards shown with the new benchmarks and driver sets was not possible. However, the next roundup should include newer benchmarks along with results from these three boards. Also, while FarCry and SC3 are "getting" long in the tooth they are both based on engines that can still stress a system by increasing the settings. They both offer a fairly good mix of cpu and gpu limited testing. The difference between D3 and Q4 is minimal except for SMP support now. We are also looking at providing repeatable and meaningful benchmarks for the RTS/SIM crowd without resorting to FRAPs. We plan on increasing the audio, power consumption, and disk RAID subject matter within the review process. You should see this process evolve over the next couple of months.
da2ce7 - Wednesday, January 4, 2006 - link
I got the original ASUS A8N-SLI Premium with a AMD X2 3800+ and found the stability very less than satisfactory with any bios less than 1007. However over clocking has been mediocre, at the standard multiplier (10X) I can raise the FSB to 254, from 200, providing a reasonable over clock, anything higher than this I seem to be hitting the wall. The voltage options are a real disappointment only letting me raze them to 1.45v. However I get no difference when overlooking when my voltage is 1.4 to 1.45, (except for my core temp), with the old bios I could raze the v-core to 1.5 and run the FSB at 260 very happily (the system did sometimes crash every 32 hours or so), I did not test it any further then before upgrading to 1007.When upgrading from the bios 1005 to 1007 I found that it would not post after the update, after much delay and many tests and try's I found that my very low timings T1-2-2-2-5-2 for the ram stopped it from booting. I gained control of it from putting in a stick of very old pc2100 ram and re-set the bios timings to automatic.
With your review I found it disappointing that you did not test the Silicone Ice raid controller, I have been wondering witch one I should run my hard drive on.
Gary Key - Wednesday, January 4, 2006 - link
We will be including RAID results in future articles. There have been some issues with repeatable results utilizing a variety of benchmarks and of course drive configurations.
I would run the native nF4 RAID setup over the SI3114 in this case (assuming RAID0). However, if it were the SI3132 chipset on the board I would probably call it a toss up at this time.
LX - Tuesday, January 3, 2006 - link
Why would you bother to include a bunch of performance charts where the difference between the leading and the trailing boards is less than 5%?Don't you have enough important info to put in your articles instead of fillers?
Gary Key - Wednesday, January 4, 2006 - link
Thank you for the comments. I think the purpose of the article was to show that performance between a $100 board and that of boards costing up to $250 (A8N32) is basically the same at stock speeds. The differences in pricing will usually (not all of the time) buy additional features and greater performance via stable overclocking.
What would you like to see in our articles that we are not providing?
JustAnAverageGuy - Tuesday, January 3, 2006 - link
It may be worth noting that in the 1011.001 BIOS, the maximum vcore drops to 1.500V with dual core processors. :)Gary Key - Wednesday, January 4, 2006 - link
We did not have an opportunity to finalize testing with the dual cores for the articles but this issue has been brought to Asus's attention. Thanks!yacoub - Tuesday, January 3, 2006 - link
Wtf is up with the BlueGears card?? Is that simply a driver issue or not? It's such an excellent audio solution it's beyond shocking to see it perform even WORSE than onboard sound solutions when it comes to cpu usage. wtf indeed! Generally simply being a peripheral PCI device sound solution means it should be well BELOW the usage of onboard sound. Now I'm worried about purchasing their new card coming out this month (X-Plosion - onboard DTS in addition to onboard DDL like the X-Mystique has).Please update us when you receive the new drivers and figure out why the cpu usage of this card during gaming is so atrocious. Thanks.