Investigations into Athlon X2 Overclocking
by Jarred Walton on December 21, 2005 12:00 PM EST- Posted in
- CPUs
Power and Heat
One area that we overlooked last time was the system power draw as well as the CPU temperature. We spent some additional time measuring these items with the X2. Total power draw was measured at the wall using a Kill-A-Watt device. We used a batch file to run 3DMark03, 3DMark05, PCMark04, and PCMark05 sequentially. The maximum power draw invariably came during 3DMark05, with all three game tests falling very close together. Test 1 (Return to Proxycon) and test 2 (Firefly Forest) typically registered a few Watts higher than test 3 (Canyon Flight ), though this trend may not hold with other system configurations. Also, since we were overclocking, AMD's Cool 'n Quiet feature was disabled - it tends to interfere with overclocking efforts.
In addition to measuring the power draw, we used NVIDIA's nTune System Monitor to record temperatures of the chipset and processor. While we would be hesitant to use the results from nTune across different motherboards due to potential variance, since we are only using one motherboard, the values are measured consistently. The temperatures were measured using the same series of tests, with the 3DMark05 CPU test causing the highest recorded temperatures. (Note that the benchmark results for Futuremark products were collected in a separate run of these tests so that nTune wouldn't impact the results.)
We only recorded temperatures and power draw for one configuration, using the OCZ VX RAM - staring at a Watt meter for 20 minutes per configuration was already bad enough! Informal checks on other configurations showed that the results were consistent - additional RAM in the 2GB configurations drew a bit more power, but CPU and chipset temperatures were within 1 degree Celsius. Also, unlike the remaining benchmarks, we verified the voltage requirements, power draw, and temperatures at every setting in 100 MHz increments.
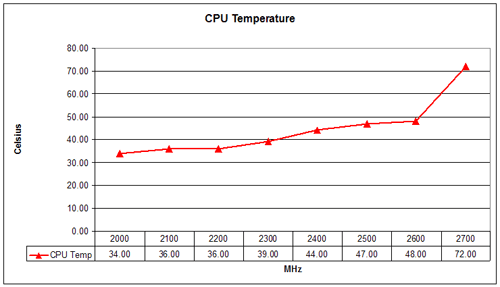
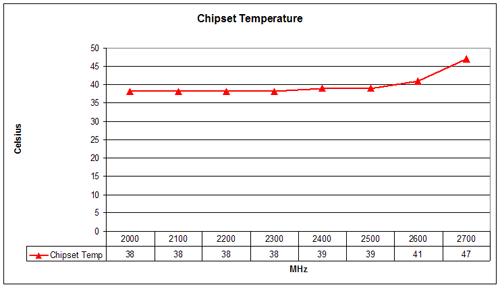
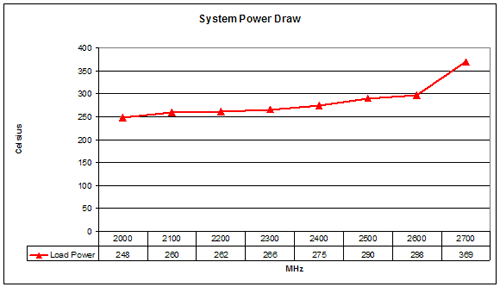
For those who prefer a graphical representation of the data, here are the charts for the above table.
It comes as no surprise that both the power draw and CPU temperatures increase as clock speed and voltage increase. The jump from 2.6 GHz to 2.7 GHz comes with a dramatic change in CPU temperature, and we would definitely advise against running this particular CPU at 2.7 GHz without additional cooling. Voltage and heat are good indicators of the maximum stable speed for a CPU, so if you're trying to find your own CPU's sweet spot, you can do so by increasing speed in 100 MHz increments. Run a few CPU intensive tests at each point to verify that the system is "stable" - Futuremark products are pretty good as an overall system stress test. Lather, rinse, and repeat. Slight increases in CPU voltage (and chipset voltage) will usually be required as the clock speed is raised, but eventually you reach a point where the next 100 MHz bump requires a substantial voltage change and comes with much higher temperatures.
Looking at our chart, you can see that most of the 100 MHz increases required a 0.00 to 0.050 CPU voltage increase. From 2.4 GHz to 2.6 GHz, we had to add 0.10V, but that's still not too bad. The last 100 MHz to reach 2.7 GHz required an additional 0.20V - four times as much per MHz as the previous step! We also tried every voltage from 1.500V to the maximum 1.850V and were unable to get the system fully stable at 2.7 GHz. That's a lot of voltage for a CPU rated at 1.300V, but we gave it a shot anyway. For most people, we'd say 1.500V is the safe limit on air cooling, though some people will feel okay pushing a bit further. We also recommend that you try to keep 90nm AMD chip temperatures under 50 degrees C. As you can see, the 2.7 GHz speed exceeds both of these thresholds, and it doesn't even do so with full stability. 2.6 GHz, on the other hand. falls in line with these limits and ran without any difficulty - at least with our particular setup.
One final note is that the power draw and temperatures can vary a lot with the task. Most games showed similar maximum power draw to 3DMark05 in informal testing, but usually only under high-stress situations. HL2 ranged from about 205W maximum at 800x600 0xAA to 262W maximum at 1600x1200 4xAA (with a CPU clock speed of 2.20 GHz). The average power draw under load was also quite a bit lower than the peak values reported; generally, average power was 15 to 25 Watts lower than the maximum.
By the way, yes, we are aware that measuring power at the outlet is not the same as measuring the output power of the PSU. Power supply inefficiencies come into play, but since we're only using one PSU (and this isn't a power supply test), the numbers are still valid. An inefficient power supply will draw more power from the wall, but the results shown are internally consistent.
One area that we overlooked last time was the system power draw as well as the CPU temperature. We spent some additional time measuring these items with the X2. Total power draw was measured at the wall using a Kill-A-Watt device. We used a batch file to run 3DMark03, 3DMark05, PCMark04, and PCMark05 sequentially. The maximum power draw invariably came during 3DMark05, with all three game tests falling very close together. Test 1 (Return to Proxycon) and test 2 (Firefly Forest) typically registered a few Watts higher than test 3 (Canyon Flight ), though this trend may not hold with other system configurations. Also, since we were overclocking, AMD's Cool 'n Quiet feature was disabled - it tends to interfere with overclocking efforts.
In addition to measuring the power draw, we used NVIDIA's nTune System Monitor to record temperatures of the chipset and processor. While we would be hesitant to use the results from nTune across different motherboards due to potential variance, since we are only using one motherboard, the values are measured consistently. The temperatures were measured using the same series of tests, with the 3DMark05 CPU test causing the highest recorded temperatures. (Note that the benchmark results for Futuremark products were collected in a separate run of these tests so that nTune wouldn't impact the results.)
We only recorded temperatures and power draw for one configuration, using the OCZ VX RAM - staring at a Watt meter for 20 minutes per configuration was already bad enough! Informal checks on other configurations showed that the results were consistent - additional RAM in the 2GB configurations drew a bit more power, but CPU and chipset temperatures were within 1 degree Celsius. Also, unlike the remaining benchmarks, we verified the voltage requirements, power draw, and temperatures at every setting in 100 MHz increments.
| Power and Temperatures | |||||
| OCZ Gold VX PC4000 2x512MB | |||||
| CPU Clock | CPU Voltage | CPU Temp | Chipse Voltage | Chipset Temp | System Power Draw |
| 2000 | 1.300 | 34.00 | 1.50 | 38 | 248 |
| 2100 | 1.350 | 36.00 | 1.50 | 38 | 260 |
| 2200 | 1.350 | 36.00 | 1.50 | 38 | 262 |
| 2300 | 1.350 | 39.00 | 1.50 | 38 | 266 |
| 2400 | 1.400 | 44.00 | 1.60 | 39 | 275 |
| 2500 | 1.475 | 47.00 | 1.60 | 39 | 290 |
| 2600 | 1.500 | 48.00 | 1.60 | 41 | 298 |
| 2700 | 1.700 | 72.00 | 1.70 | 47 | 369 |
For those who prefer a graphical representation of the data, here are the charts for the above table.
It comes as no surprise that both the power draw and CPU temperatures increase as clock speed and voltage increase. The jump from 2.6 GHz to 2.7 GHz comes with a dramatic change in CPU temperature, and we would definitely advise against running this particular CPU at 2.7 GHz without additional cooling. Voltage and heat are good indicators of the maximum stable speed for a CPU, so if you're trying to find your own CPU's sweet spot, you can do so by increasing speed in 100 MHz increments. Run a few CPU intensive tests at each point to verify that the system is "stable" - Futuremark products are pretty good as an overall system stress test. Lather, rinse, and repeat. Slight increases in CPU voltage (and chipset voltage) will usually be required as the clock speed is raised, but eventually you reach a point where the next 100 MHz bump requires a substantial voltage change and comes with much higher temperatures.
Looking at our chart, you can see that most of the 100 MHz increases required a 0.00 to 0.050 CPU voltage increase. From 2.4 GHz to 2.6 GHz, we had to add 0.10V, but that's still not too bad. The last 100 MHz to reach 2.7 GHz required an additional 0.20V - four times as much per MHz as the previous step! We also tried every voltage from 1.500V to the maximum 1.850V and were unable to get the system fully stable at 2.7 GHz. That's a lot of voltage for a CPU rated at 1.300V, but we gave it a shot anyway. For most people, we'd say 1.500V is the safe limit on air cooling, though some people will feel okay pushing a bit further. We also recommend that you try to keep 90nm AMD chip temperatures under 50 degrees C. As you can see, the 2.7 GHz speed exceeds both of these thresholds, and it doesn't even do so with full stability. 2.6 GHz, on the other hand. falls in line with these limits and ran without any difficulty - at least with our particular setup.
One final note is that the power draw and temperatures can vary a lot with the task. Most games showed similar maximum power draw to 3DMark05 in informal testing, but usually only under high-stress situations. HL2 ranged from about 205W maximum at 800x600 0xAA to 262W maximum at 1600x1200 4xAA (with a CPU clock speed of 2.20 GHz). The average power draw under load was also quite a bit lower than the peak values reported; generally, average power was 15 to 25 Watts lower than the maximum.
By the way, yes, we are aware that measuring power at the outlet is not the same as measuring the output power of the PSU. Power supply inefficiencies come into play, but since we're only using one PSU (and this isn't a power supply test), the numbers are still valid. An inefficient power supply will draw more power from the wall, but the results shown are internally consistent.


46 Comments
View All Comments
rekabwolrab - Friday, February 24, 2006 - link
I'm new to OC and both the articles were very nice. Good Job. I am looking forward to the next installment with HSF/Cooling.shoeish - Friday, February 24, 2006 - link
Any results to share about watercooling or stock HSF with this chip yet?mcpdigital - Wednesday, December 28, 2005 - link
This article comes in the right moment since lots of people are thinking about upgrading their PCs or just did it.In my case I have a pretty simmilar configuration with LanParty Ultra-D, 3800 X2 and OCZ EL 3200 (2x1GB).
I found the breakeven of my setup at 280x9(2520), Mem at 210 MHz CAS 2,3,3,5 1T and HT x 3. Memory is running at its best, with 1T, Fastest in BIOS and CAS2 achieving around 61000 MB/s transfer rate running Sandra 2005 Pro, a value that is a bit under the maximum bandwidth with HT @1680 MHz of 6720MB/s
Anything over this speed makes the system unstable and requires a lot of slowdowns in other settings, voltage and temps raising fast, its a bad tradeoff IMO.
So Anandtech simple of the 3800 X2 seems a little better than mine, not that I'm not happy, I'm for sure.
Marcelo
Some1ne - Sunday, December 25, 2005 - link
Re: If you have any specific requests or suggestions before then, let me know.I noticed that as you increased the clock speed, you also increased your chipset voltage in a fairly linear way. I question whether or not this is really necessary or beneficial. I have a MSI Neo4 Platinum mainboard, and I've never had to touch the chipset voltage when overclocking. In fact, some of the behavior I observed when playing with it seemed to imply that the chipset got slightly less stable with higher voltages (though I didn't do enough testing to know conclusively if the relationship holds or not). Using the stock chipset voltage, I was able to hit:
2464 MHz (352x7) on a Winchester 3000+ w/ 6.6% over-VID on the CPU
2420 MHz (242x10) on a Manchester 3800+ w/ 10% over-VID on the CPU
2400 MHz (400x6) on a Winchester 3000+ w/ 6.6% over-VID on the CPU, just to see if the board would run stably at a 400 MHz "fsb" setting...it did
So as far as I can tell, boosting the chipset voltage is not necessary in order to attain a good overclock. It might be interesting if you could do tests to see what, if any, impact it has on stability at higher clock speeds, or maybe at least re-run your 2.7 GHz tests with stock chipset voltage just to make sure that your instability wasn't coming from an overheating chipset.
JarredWalton - Monday, December 26, 2005 - link
The results reported are only after testing all of the lower voltages. I encountered instability without the increased voltage to the chipset and processor. That said, other motherboards may not behave the same. I intend to switch to a different motherboard for the cooling tests -- a DFI LanParty SLI-DR. I will be sure to comment on whether the voltage requirements change or not.AtaStrumf - Friday, December 23, 2005 - link
Just want to commend you for a really thorough article. I miss that from other AT editors as of late.I also agree that all that ultra high end memory with tight timings is an absolute overkill for all but the most rabid overclockers. This is especially true since Athlon got an on die memory controller and became Athlon64. Just get some good quality RAM that will get you to 220-233 MHz so you have some headroom with BIOS FSB/dividers settings, because generic usually craps out at 201-203 MHz (sad but true).
Visual - Thursday, December 22, 2005 - link
Fantastic article, folks!It really showed alot. Sure, as someone commented, using a better mobo might have been interesting... but after all its the CPU that is important here, and you made the differences in performace with varying oc well presented.
I have to say, this article showed a surprisingly high difference between memory types too. You did comment in the end that there wasn't much difference, but there are some cases where there is :) 3dMark05 is the extreme case i guess, and not "real world" enough to be worth the added price, but 15fps or more in a lot of games from going from generic to the PC4800 mem isn't bad too. Seriously, this article showed the importance of memory way clearer than any of your RAM roundups in the past.
What is still dissapointing is that the test didn't reach the near-3ghz ocs a lot of people are bragging with on some forums :p But this is a good thing in a way, as now there won't be any misled readers buying the chip and expecting unrealistic achievments. I'm still curious about what the chips can do at max though, so I'm looking forward to your stock/Chill tests :) Maybe comparison with both infinity and lanparty boards? Maybe trying out several chips so you can give us a somewhat more realistic max average oc? (Hehe, no, scratch that last one. I don't want AT going broke from buying out all the X2s, plus no matter how many chips you test, the readers' own luck will deviate from yours)
Visual - Thursday, December 22, 2005 - link
Oh hey, I want to add a bit but there is no edit feature. So here goes...The RAM difference is much higher than with the singlecore veince. This does match with the assumption that two cores would need (and benefit) more bandwidth. So it also brings hope that the move to AM2 and DDR2 will have an even further boost, atleast for the dualcores. I'm already drooling over an imaginary AM2 X2 oced with DDR2 800mhz ram or faster :p
JarredWalton - Thursday, December 22, 2005 - link
I would say the performance difference shown here (relative to Venice) is from two things. First, two cores can use more bandwidth, though most of these tests won't show that since they're single-threaded. Second, the faster graphics card allows the CPU to really stretch its legs.Once you're at realistic settings for this system (minimum 1280x1024 resolution), the scores get a lot closer. Also, 3DMark has a pretty large deviation between runs - probably 3% or so. I didn't run 3DMark multiple times looking for the best score, so the results may not present a completely accurate representation of performance. Still, the CPU tests do show generic RAM at a pretty major disadvantage as clock speed increases. If 3DMark05's CPU test is an accurate estimate of multithreaded game performance, we're looking at a 25% difference! But I wouldn't put too much stock in 3DMark05. :p
Visual - Friday, December 23, 2005 - link
From what I read on the futuremark forums once, even though 3dmark05 is multithreaded, vertex processing in cpu tests is singlethreaded (some dx9 functionality from MS, not developed by futuremark) so isnt taking full advantage of dualcores still.