Original Link: https://www.anandtech.com/show/2202
ASUS P5N32-E SLI Plus: NVIDIA's 650i goes Dual x16
by Gary Key on April 2, 2007 3:30 AM EST- Posted in
- Motherboards
When the first 680i SLI motherboards were launched back in November they offered an incredible array of features and impressive performance to boot. However, all of this came at a significant price of $250 or more during the first month of availability. We thought additional competition from the non-reference board suppliers such as ASUS, abit, and Gigabyte would drive prices down over time. The opposite happened to a certain extent with the non-reference board suppliers, as prices zoomed above the $400 mark for boards like the ASUS Striker Extreme. The reference board design from suppliers such as EVGA and BFG has dropped to near $200 recently but we are still seeing $300 plus prices for the upper end ASUS and Gigabyte 680i boards.
ASUS introduced the P5N32-E SLI board shortly after the Striker Extreme as a cost reduced version of that board in hopes of attracting additional customers. While this was a good decision, that board did not compete too well against the reference 680i boards in the areas of performance, features and cost. With necessity being the mother of all inventions, ASUS quickly went to work on a board design that would offer excellent quality and performance at a price point that was at least half that of the Striker Extreme.
They could not get there at the time with the 680i SLI chipset and the recently released 680i LT SLI cost reduced chipset was not available so ASUS engineered their own version that would meet a market demand for a sub-$200 motherboard that offered the features and performance of the 680i chipset. They took the recently introduced 650i SLI SPP (C55) and paired it with the 570 SLI MCP (MCP55) utilized in the AMD 570/590 SLI product lines. ASUS called this innovative melding of an Intel SPP and AMD MCP based chipsets their Dual x16 Chipset with HybridUp Technology. Whatever you want to call it, we know it just flat out works and does so for around $185 as you will see in our test results shortly.
Before we get to our initial performance results and discussion of the ASUS's P5N32-E SLI Plus hybrid board design we need to first explain the differences between it and the 680i/680i LT motherboards. In an interesting turn of events we find the recently introduced 680i LT SLI chipset also utilizing the nForce 570 SLI MCP with the new/revised 680i LT SPP while the 680i SLI chipset utilizes the nForce 590 SLI MCP and 680i SLI MCP.
With the chipset designations out of the way, let's get to the real differences. All three designs officially support front-side bus speeds up to 1333MHz, so the upcoming Intel processors are guaranteed to work and each design offers very good to excellent overclocking capabilities with the 680i SLI offering the best overclocking rates to date in testing. Each board design also offers true dual x16 PCI Express slots for multi-GPU setups with ASUS designing the dual x8 capability on the 650i SPP as a single x16 setup with the second x16 slot capability being provided off the MCP as in the other solutions. We are still not convinced of the performance advantages of the dual x16 designs over the dual x8 offerings in typical gaming or application programs. We only see measurable differences between the two solutions once you saturate the bus bandwidth at 2560x1600 resolutions with ultra-high quality settings, and even then the performance differences are usually less than 5%.
The 680i SLI and the ASUS hybrid 650i boards offer full support for Enhanced Performance Profile (SLI-Ready) memory at speeds up to 1200MHz with the 680i LT only offering official 800MHz support. However, this only means you will have to tweak the memory speed and timings yourself in the BIOS, something most enthusiasts do anyway. We had no issue running all three chipset designs at memory speeds up to 1275MHz when manually adjusting the timings.
Other minor differences have the 680i SLI and ASUS Plus boards offering LinkBoost technology that has shown zero to very minimal performance gains in testing. Both boards also offer a third x16 physical slot that operates at x8 electrical to provide "physics capability" - something else that has not been introduced yet. Fortunately this slot can be used for PCI Express devices up to x8 speeds so it is not wasted. Each design also offers dual Gigabit Ethernet connections with DualNet technology and support for 10 USB devices. The 680i LT SLI design offers a single Gigabit Ethernet, support for 8 USB devices, and does not support LinkBoost or a third x16 physical slot.
What we basically have is the ASUS hybrid design offering the same features as the 680i SLI chipset at a price point near that of the feature reduced 680i LT SLI setup. This leads us into today's performance review of the ASUS P5N32-E SLI Plus. In our article today we will go over the board layout and features, provide a few important performance results, and discuss our findings with the board. With that said, let's take a quick look at this hybrid solution and see how well it performs against the purebreds.
Specifications and Basic Features
| ASUS P5N32-E SLI Plus | |
| Market Segment: | High-End Performance - $185 |
| CPU Interface: | Socket T (Socket 775) |
| CPU Support: | LGA775-based Pentium 4, Celeron D, Pentium D, Pentium EE, Core 2 Duo, Core 2 Extreme |
| Chipset: | NVIDIA 650i SPP (C55) + 570 SLI MCP (MCP55P) |
| Bus Speeds: | Auto, 533 to 3000 QDR (133~750) in 1MHz increments |
| Memory Ratios: | Auto, Sync., 1:1, 5:4, 3:2 |
| Memory Speed: | 400MHz~2600MHz in various increments |
| PCIe 1-2-3 Speeds: | 100MHz~200MHz in 1MHz Increments |
| LDT Frequency: | 1x, 2x, 3x, 4x, 5x, 6x, 7x, 8x |
| Core Voltage: | Auto, 0.83125V to 1.90000 in 0.00625V increments |
| FSB Options: | Optimal, Linked, Unlinked |
| CPU Clock Multiplier: | Auto, 6x-11x in 1X increments - Core 2 Duo, downwards unlocked, Core 2 Extreme 6x-50X |
| DRAM Voltage: | Auto, 1.8500V to 3.4250 in .025V increments |
| DRAM Timing Control: | Optimal, Manual - 13 DRAM Timing Options |
| NB Voltage: | Auto, 1.20V to 2.75V in .05V increments |
| 1.2V HT Voltage: | Auto, 1.20V to 1.95V in .05V increments |
| SB Voltage: | Auto, 1.50V to 1.85V in .05V increments |
| CPU VTT: | Auto, 1.20V to 1.55V in .05V increments |
| Memory Slots: | Four 240-pin DDR2 DIMM Slots Dual-Channel Configuration, DDR2-400, 533, 667, 800 Regular Unbuffered Memory to 8GB Total |
| Expansion Slots: | 2 - PCIe X16 (2-x16 electrical for SLI or Multi-GPU) 1 - PCIe X16 (x8 electrical) 1 - PCIe x1 2 - PCI Slot 2.2 |
| Onboard SATA/RAID: | 6 SATA 3Gbps Ports - 570 SLI MCP (RAID 0, 1, 0+1, 5, JBOD) |
| Onboard IDE: | 1 ATA133/100/66 Port (2 drives) - 570 SLI MCP |
| Onboard USB 2.0/IEEE-1394: | 10 USB 2.0 Ports - 4 I/O Panel - 6 via Headers 2 Firewire 400 Ports by VIA 6309P - 1 I/O Panel, 1 via Header |
| Onboard LAN: | NVIDIA Gigabit Ethernet - PCIe - 2 x Marvell 88E1116 PHY - 2 ports via 570 SLI MCP |
| Onboard Audio: | ADI 1988B - 8-channel HD audio codec, Supreme FX audio card |
| Power Connectors: | ATX 24-pin, 8-pin EATX 12V |
| I/O Panel: | 1 x PS/2 Keyboard 1 x PS/2 Mouse 1 x S/PDIF Optical - Out 1 x S/PDIF Coaxial - Out 1 x IEEE 1394a 2 x RJ45 4 x USB 2.0/1.1 |
| Auto Overclocking: | AI Overclock - 5%10%, 15%, 20% Fixed; N.O.S. - 3%, 5%, 8%, 10% Variable |
| BIOS Revision: | Award 0602 |
| Board Revision: | v1.0 |
The latest ASUS BIOS offers a very good level of options that are available for tweaking the board with specific emphasis placed on the available memory settings. We found in memory testing that switching to manual settings and changing the tCAS, tRCD, tRP, and tRAS was required to ensure optimum performance.
Compared to the 680i LT board, the number of voltage options and range of changes are extensive but the lack of GTL Ref voltage settings limited our quad core overclocking results to 360 FSB but the board was able to reach benchmark stable FSB speeds of 495 with our dual core processors.
One other issue we have with the 0402 and 0602 BIOS releases is that memory sub timings are very tight, especially tRC rates which ended up causing stability issues with some of our lower cost memory modules with ProMOS or Elpida ICs. While the aggressive memory timings allow for optimum performance, we generally had to hand tweak them to ensure stability across a wide range of memory modules.
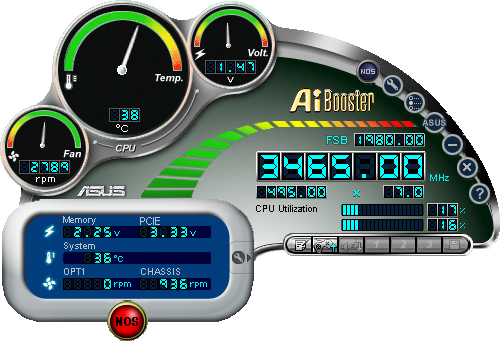
ASUS offers minimum support for NVIDIA's nTune system utility but includes several proprietary programs for tweaking and monitoring the board. The AiBooster utility offers the ability to tweak FSB speeds and certain voltages along with monitoring basic temperatures, fan speeds, and voltages. This utility allows the user to fine tune the AI NOS program that detects system load and dynamically increases system performance up to 10%. We were able to set NOS at 10% and complete our benchmark suite without issues. However, when using the AI Overclock option in the BIOS, we were unable to get the fixed 20% setting stable during benchmarking and had to back off to 15%.
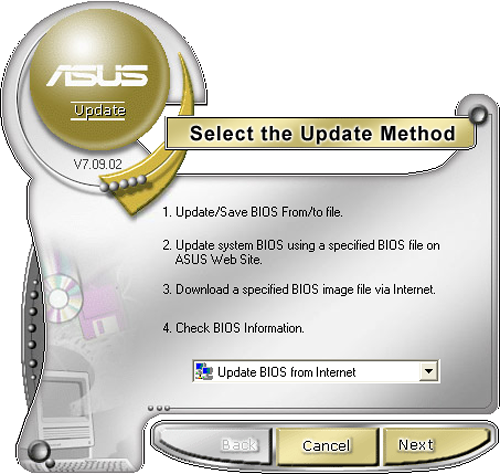
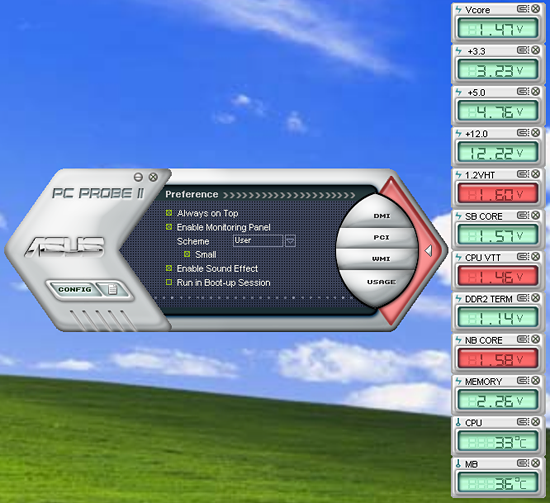
Also included is the ASUS Update program that allows for BIOS updates within Windows from the ASUS FTP site (or from your hard disk if the BIOS was already downloaded). We have not had any issues recently when updating our BIOS with the ASUS Update program, but we still prefer the DOS floppy method. The ASUS PC Probe II utility is one of the better manufacturer supplied programs for tracking voltage settings, fan speeds, and basic temperatures. We still believe abit's µGuru technology offers the best combination of tweaking and monitoring capabilities in a supplier provided program, but ASUS's AiSuite is certainly capable enough for most users.
Board Layout and Features
 |
| Click to enlarge |
Considering the amount of options on the board, we think ASUS devised a very good board layout, although a couple of areas are crowded. The board features an eight-phase power design and 100% use of conductive polymer aluminum capacitors that provided excellent stability during testing. The board also features a toned down version of the Striker Extreme passive cooling system and ASUS's patented Stack Cool 2 technology that is designed transfer heat away from the CPU area. During our overclocking tests we found the passive heat pipe cooling system worked well but required additional airflow across 650i SPP and VRM heatsinks to ensure stability with our Tuniq 120 air cooler.
There are eight fan headers (one 4-pin, seven 3-pin) located in easy to reach positions on the board. Only the CPU fan and four chassis fan headers offer automatic fan control capabilities within the BIOS. The automatic control system includes a choice of using temperature ranges or duty cycle speeds to control the selected fan headers while all fan headers are monitored by the BIOS. The board installed easily into our Cooler Master CM Stacker 830 case and cable management was very good for power, optical, and hard drives. We did find that a user could potentially disengage the SATA cables with very little pressure being applied to the cable, due to the motherboard's SATA connector design/location.
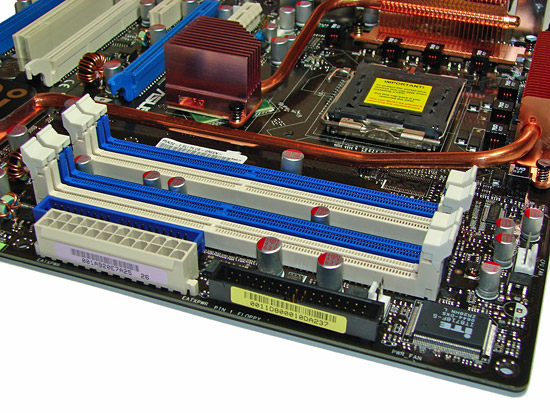
The memory slots are color coded correctly for dual channel operation. The 24-pin ATX power connector is conveniently located with the black floppy drive cable on the edge of the board. We would have switched the location of the blue IDE connector with the floppy drive connector and given it a right angle design to match the SATA ports. As it stands, this is one of the worst design decisions on the board as connecting an IDE cable after the power cable is attached is difficult once the board is installed in a case.
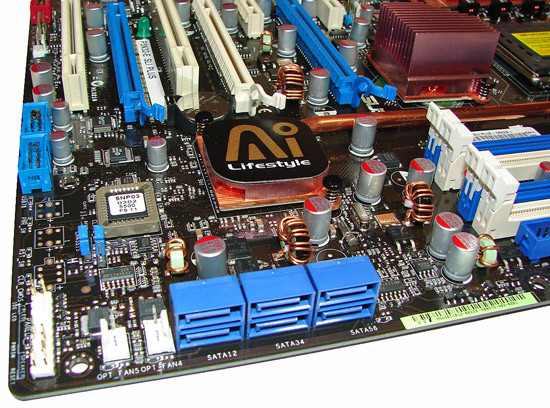
The six blue SATA ports are located on the edge of the board. We found the positioning of the SATA ports to be very good when utilizing the PCI or second blue PCI-E x16 physical slot. The MCP is passively cooled and remained warm to the touch throughout testing although additional cooling was not needed when overclocking.

The board comes with three PCI Express x16 connectors (two x16 and one x8 electrical), two PCI Express x1, and two PCI 2.2 connectors. The layout of this design offers a very good triple x16 connector design. The second PCI Express x1 slot will be physically unavailable as will the second PCI connector if you utilize SLI with double slot cards. The third x16 slot can be utilized for physics acceleration if this option ever arrives from NVIDIA, or it can be used as a normal PCI Express slot for a wide variety of cards up to x8 speeds.

Getting back to CPU socket area, we find a fair amount of room for alternative cooling solutions. We utilized the stock heatsink/fan in our normal testing but also verified a few larger Socket-775 air cooling solutions such as the Tuniq 120 would fit in this area during our overclocking tests. The 650i SPP chipset is passively cooled with a mid-rise heatsink unit that did not interfere with any installed peripherals but did run hot without additional airflow over it during overclocking. The VRM components are passively cooled and the 8-pin ATX power connector is located out of the way. We will start providing thermal results of the various cooling solutions in our next article.
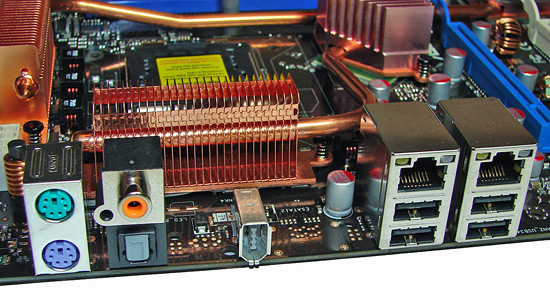
The rear panel contains the standard PS/2 mouse and keyboard ports, two LAN ports, and four USB 2.0 ports. The LAN (RJ-45) ports have two LED indicators representing Activity and Speed of the connection through the Marvell Gigabit PCI-E PHY controllers. The panel also has an S/PDIF optical out port, S/PDIF coaxial out port, and an IEEE 1394 port.
The audio subsystem is based on the ADI AD1988B and offers 8-channel output along with full DTS Connect support. The AD1988B chipset and output ports are located on a separate riser card that ASUS has dubbed the SupremeFX. While this audio solution will not offer supreme performance over the Creative X-FI series, it certainly offers better performance and audio quality than the Realtek solutions, especially when comparing EAX 2.0 audio quality.
Overall, the feature set on this board is very good and certainly better than the EVGA 680i LT SLI board we recently reviewed, with both boards retailing for a similar price.
Overclocking - E6300
| ASUS P5N32-E SLI Plus Dual Core Overclocking |
|
| Processor: | Intel Core 2 Duo E6300 Dual Core, 1.86GHz, 2MB Unified Cache 1066FSB, 7x Multiplier |
| CPU Voltage: | 1.4500V (default 1.3250V) |
| NB Voltage: | 1.45V |
| 1.2V HTT Voltage: | 1.40V |
| SB Voltage: | 1.50V |
| CPU VTT: | 1.25V |
| Cooling: | Tuniq 120 Air Cooling |
| Power Supply: | OCZ ProXStream 1000W |
| Memory: | OCZ Flex XLC PC2-6400 (2x1GB) |
| Video Cards: | 1 x MSI 8800GTX |
| Hard Drive: | Western Digital 150GB 10, 000RPM SATA 16MB Buffer |
| Case: | Cooler Master CM Stacker 830 |
| Maximum OC: | 495x7 (3-4-3-9 1T, 792MHz, 2.250V), CPU 1.4500V 3465MHz (+86% FSB/CPU) |
| . | |
 |
| Click to enlarge |
We were able to reach a final benchmark stable setting of 7x495 FSB resulting in a clock speed of 3465MHz. We were able to run our OCZ Flex PC2-9200, OCZ Flex PC2-6400, and our Corsair PC2-8888 at the reported timings with a 1T Command Rate enabled with 2.250V. When overclocking we were able to run our standard OCZ Flex PC2-6400 at 1T command rates with very aggressive sub-timings. Vdroop was very good on this board during E6300 overclocking with an average drop of .02V during load testing with our E6300.
Testing with our new OCZ Flex PC2-6400 CAS3 (standard memory installed) and G.Skill F2-6400CL4D-2GBHK modules based on ProMOS IC chips resulted in great success on this board. The OCZ Flex PC2-6400 was able to run up to DDR2-850 speeds with timings at 3-4-3-9 1T at 2.250V and the G.Skill F2-6400CL4D at 4-3-3-9 1T at 2.20V. The remaining memory timings are set to Auto as is standard in our testing and manually adjusting these timings resulted in increased stability while overclocking while minimally decreasing performance in certain games and applications that are memory sensitive. We did notice in 4GB testing that we had to change our OCZ Flex PC2-6400 CAS3 memory timings to 3-4-4-10 2T at 2.275V for stable 24/7 operation in a variety of applications.
Overclocking - E6600
| ASUS P5N32-E SLI Plus Dual Core Overclocking |
|
| Processor: | Intel Core 2 Duo E6600 Dual Core, 2.4GHz, 4MB Unified Cache 1066FSB, 9x Multiplier |
| CPU Voltage: | 1.4750V / 1.4500 (default 1.3250V) |
| NB Voltage: | 1.45V |
| 1.2V HTT Voltage: | 1.45V |
| SB Voltage: | 1.50V |
| CPU VTT: | 1.35V / 1.30V |
| Cooling: | Tuniq 120 Air Cooling |
| Power Supply: | OCZ ProXStream 1000W |
| Memory: | OCZ Flex XLC PC2-6400 (2x1GB) |
| Video Cards: | 1 x MSI 8800GTX |
| Hard Drive: | Western Digital 150GB 10, 000RPM SATA 16MB Buffer |
| Case: | Cooler Master CM Stacker 830 |
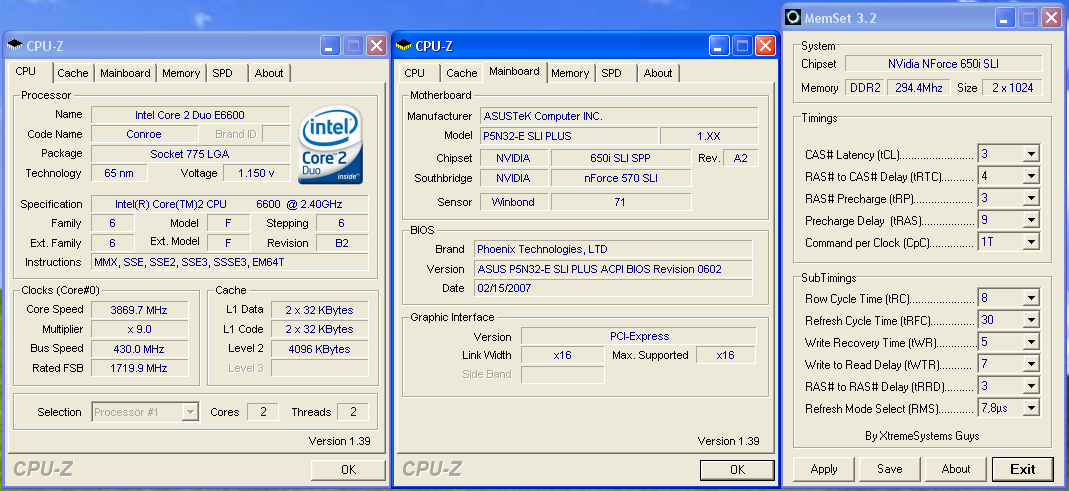
| Maximum CPU OC: | 430x9 (3-4-3-9 1T, 799MHz, 2.25V), CPU 1.4750V 3869MHz (+61%) |
| Maximum FSB OC: | 495x7 (3-4-3-9 1T, 792MHz, 2.25V), CPU 1.4500V 3465MHz (+86% FSB) |
| . | |
 |
| Click to enlarge |
After trying numerous voltages and memory timings we discovered our 9x430 FSB setting was the limit for both our board and CPU. This resulted in a final clock speed of 3869MHz at 1.4750V which is the limit for our Tuniq 120 air cooler. We did find the typical FSB hole around 416FSB but did not notice the same issues we had with the 680i LT SLI having several FSB ranges that were unusable. We were able to post and complete benchmark testing at 435FSB but could not pass dual Prime95 at that setting. Vdroop was very acceptable but not great during overclocking with an average drop of .03V ~ .04V during load testing with our E6600. We generally found that without decent airflow around the CPU and memory locations that our maximum FSB was near 408 with this configuration.
 |
| Click to enlarge |
We dropped the multiplier on our E6600 to seven and were able to reach the same 495 FSB level as with the E6300. We were able to enter XP at 7x515 but the board was not stable, and we could complete all benchmarks at 7x510 except for dual Prime95. At first we thought the board was locked at 500FSB but once again we found FSB holes but this time they ranged from 502 to 516. We noticed in overclock testing that we were able to extract an 1133 memory speed at 5-5-4-15 2T timings at 2.20V with our OCZ Flex PC2-6400. This matches the 680i LT SLI speeds at slightly better timings although performance differences were minimal with sub-timings set the same. We dropped in our OCZ Flex PC2-9200 and Corsair PC2-9136 modules with both being able to reach DDR2-1275 but at 5-5-5-18 timings compared to the 5-5-4-12 2T timings at 2.30V on the 680i LT SLI board. Memory performance and stability was superb once the board was dialed in.
Overclocking - QX6700
| ASUS P5N32-E SLI Plus Quad Core Overclocking |
|
| Processor: | Intel Core 2 Extreme QX6700 Quad Core, 2.66GHz, 8MB Unified Cache 1066FSB, 10x Multiplier |
| CPU Voltage: | 1.4500V (default 1.3500V) |
| NB Voltage: | 1.35V |
| 1.2V HTT Voltage: | 1.30V |
| SB Voltage: | 1.50V |
| CPU VTT: | 1.40V |
| Cooling: | Tuniq 120 Air Cooling |
| Power Supply: | OCZ ProXStream 1000W |
| Memory: | OCZ Flex XLC PC2-6400 (2x1GB) |
| Video Cards: | 1 x MSI 8800GTX |
| Hard Drive: | Western Digital 150GB 10, 000RPM SATA 16MB Buffer |
| Case: | Cooler Master CM Stacker 830 |
| Maximum OC: | 360x10 (3-4-3-9 1T, 800MHz, 2.25V), CPU 1.4500V 3600MHz (+35%) |
| . | |
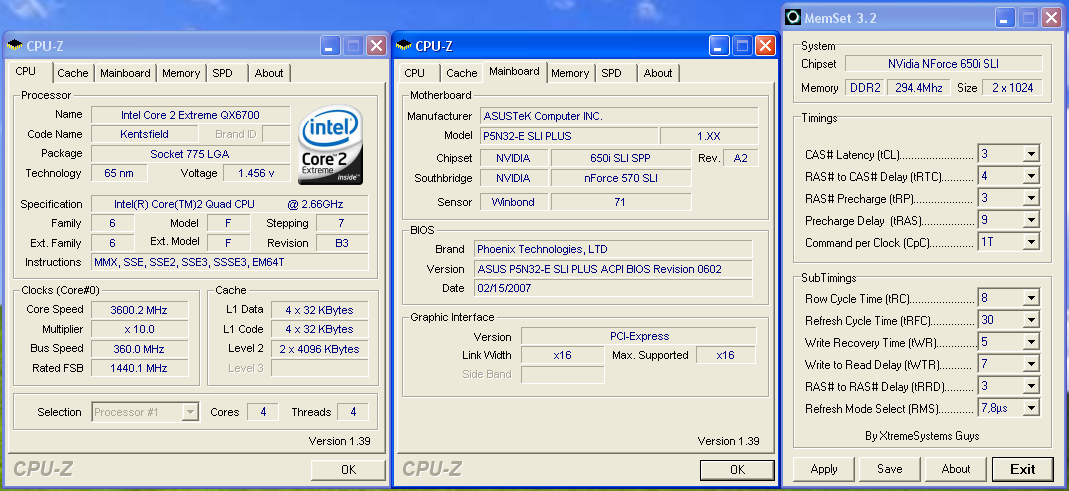 |
| Click to enlarge |
Needless to say, quad core overclocking on this board is slightly better than most of the 680i platforms but is a disappointment when compared to the recent EVGA 680i LT SLI. Our board reached a final 360FSB at stock or lower multipliers. We were able to POST and enter XP at 372FSB but could not complete our benchmark testing. In comparison, the 680i LT SLI was able to reach 10x362 and 8x432 FSB speeds.
Just like the 680i LT SLI board we had to set our processor voltage to 1.4750 in order to maintain system stability at 360 FSB. Our processor normally will run in the 3600MHz range at 1.4125V. The reason for this is that Vdroop was just acceptable on this board with a quad core processor. We would see drops as high as .05V under load testing with the average drop being around .02V during game testing. Since our quad core results with the ASUS and MSI 650i/430 boards are very similar, we believe the 650i SPP is the limiting factor in overclocking this processor.
Test Setup
| Standard Test Bed Performance Test Configuration |
|
| Processor: | Intel Core 2 Duo E6600 (2.4GHz, 4MB Unified Cache) |
| RAM: | OCZ Flex XLC PC2-6400 (2x1GB) 2.20V, 3-4-3-9 (1T where applicable) |
| Hard Drive: | Western Digital 150GB 10, 000RPM SATA 16MB Buffer |
| System Platform Drivers: | Intel - 8.1.1.1010 NVIDIA - 9.35, 8.43 ATI - 6.10 |
| Video Cards: | 1 x MSI 8800GTX , 2 x MSI 8800GTX for SLI |
| Video Drivers: | NVIDIA 97.92 |
| CPU Cooling: | Tuniq 120 |
| Power Supply: | OCZ ProXStream 1000W |
| Optical Drives: | Plextor PX-760A, Plextor PX-B900A |
| Case: | Cooler Master CM Stacker 830 |
| Motherboards: | ASUS Striker Extreme (NVIDIA 680i) - BIOS 1002 ASUS P5N-E SLI (NVIDIA 650i) - BIOS 0401 ASUS P5N32-E SLI Plus (NVIDIA 650i - BIOS 0602) ABIT AB9 QuadGT (Intel P965) - BIOS 1.1 B06 DFI LANParty UT ICFX3200-T2R/G (AMD RD600) - BIOS 12/22 EVGA 680i LT SLI (680i LT) - BIOS Award 721N0P01 GIGABYTE GA-N680SLI-DQ6 - BIOS F4B Intel D975XBX2 (Intel 975X) - BIOS 2333 MSI P6N SLI Platinum (nForce 650i) - BIOS 1.22 |
| Operating System: | Windows XP Professional SP2 |
| . | |
A 2GB memory configuration is standard in our XP test beds as most enthusiasts are currently purchasing this amount of memory. Our choice of mid-range OCZ Flex XLC PC-6400 memory represents an excellent balance of price and performance that offered a very wide range of memory settings during our stock and overclocked test runs. We also utilized our Corsair XMS2 Dominator (Twin2x2048-9136C5D) memory on this board to verify DDR2-1066 to DDR2-1200 compatibility with another memory type.
We are currently completing testing several other memory modules ranging from Transcend, TwinMOS, and WINTEC DDR2-800 down to A-DATA DDR2-533 for compatibility and performance benchmarks in our 680i roundup article. Our memory timings are set based upon determining the best memory bandwidth via MemTest 86 and test application results for each board. We only optimize the four main memory settings with sub-timings remaining at Auto settings.
We are utilizing an MSI 8800GTX video card to ensure our 1280x1024 resolutions are not completely GPU bound for our motherboard test results. We did find in testing that applying a 4xAA/8xAF setting in most of today's latest games at our standard resolution did not really change performance. Our video tests are run at 1280x1024 resolutions for this article at High Quality settings. We also tested at 1600x1200 and 1920x1200 4xAA/8xAF for our NVIDIA SLI results that will be presented in our MSI P6N Diamond article.
All of our tests are run in an enclosed case with a dual optical/hard drive setup to reflect a moderately loaded system platform. Windows XP SP2 is fully updated and we load a clean drive image for each system to ensure driver conflicts are kept to a minimum. We were able to run our memory test modules at 3-4-3-9 1T for our benchmark results.
Synthetic Graphics Performance
The 3DMark series of benchmarks developed and provided by Futuremark are among the most widely used tools for benchmark reporting and comparisons. Although the benchmarks are very useful for providing apple to apple comparisons across a broad array of GPU and CPU configurations they are not a substitute for actual application and gaming benchmarks. In this sense we consider the 3DMark benchmarks to be purely synthetic in nature but still very valuable for providing consistent measurements of performance.
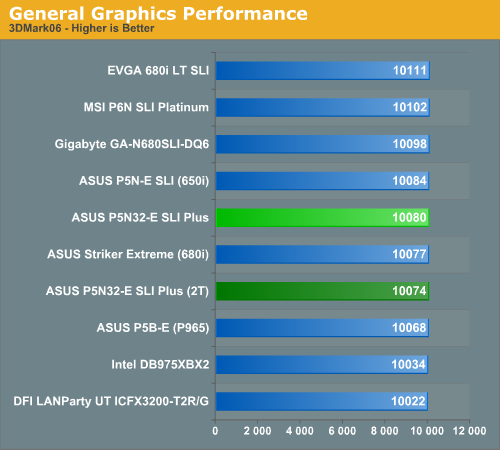
In our 3DMark06 test, all of board are basically even with only an 89 point separation from first to last. Our ASUS P5N32-E SLI Plus board scored in the middle of the pack and offered the best video scores of our test boards but one of the lower CPU scores in this benchmark. While this issue did not repeat itself in our other benchmarks, we still found it strange as the results were opposite with the other 650i SPP based boards.
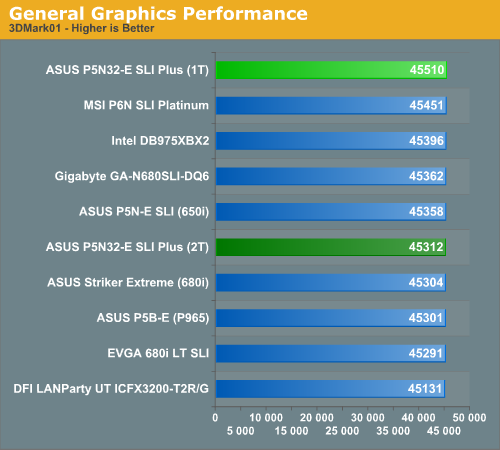
In the more memory and CPU sensitive 3DMark01 benchmark we see our ASUS Plus board leading all boards with 1T timings and scoring in the middle of the pack with 2T settings. While the differences are not significant, this board does offer excellent benchmark scores when utilizing 1T memory settings.
General System Performance
The PCMark05 benchmark developed and provided by Futuremark was designed for determining overall system performance for the typical home computing user. This tool provides both system and component level benchmarking results utilizing subsets of real world applications or programs. This benchmark is useful for providing comparative results across a broad array of Graphics, CPU, Hard Disk, and Memory configurations along with multithreading results. In this sense we consider the PCMark benchmark to be both synthetic and real world in nature while providing consistency in our benchmark results.
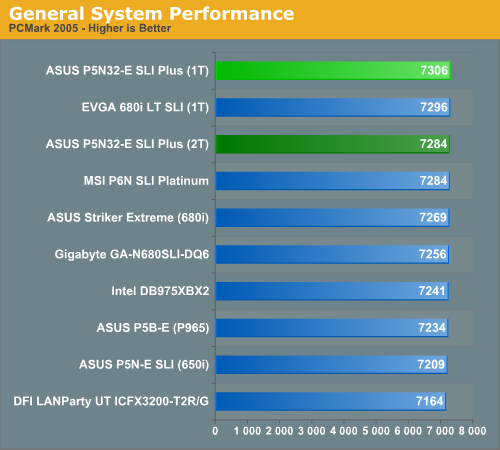
The ASUS P5N32-E SLI Plus board tops our charts in this very competitive benchmark and we are starting to see a pattern emerge with the latest board releases performing slightly better than our boards released last year. The 650i and 680i chipsets scored very well on the single task disk benchmarks with the 680i performing slightly better in the graphics subsystem tests where they led the field. Our 975X and P965 chipset boards won the multitasking tests while the RD600 offered middle of the road performance in most of the tests. Our ASUS Plus board scored better in the multitasking tests than the other NVIDIA boards which propelled it into first place as its graphic scores were only about 1% lower than the 680i LT SLI.
Multitasking Performance
We devised a script that would compress our standard test folder consisting of 444 files, ten subfolders, and 602MB worth of data, convert a 137MB High Definition QuickTime movie clip to a 37MB MPEG-4 format, play back the first two chapters of Office Space with PowerDVD, and run our AVG anti-virus program in the background. We stop the script when the file compression and video conversion are complete. This is a very taxing script for the CPU, Memory, and Storage subsystem. We also found it to be a good indicator of system stability during our overclocking testing.
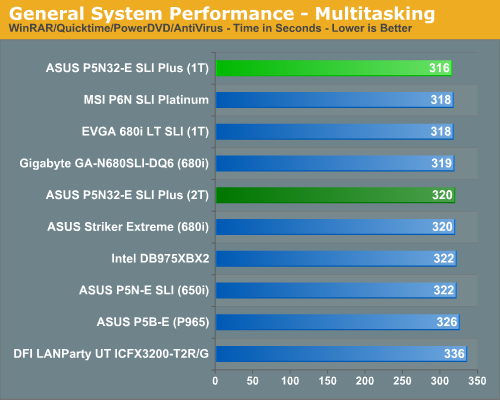
The performance difference basically mirrors our PCMark 2005 tests with the ASUS, MSI, and EVGA boards finishing at the top due to great disk performance although the Intel boards consistently completed the QuickTime Conversion first. The DFI RD600 board scored last although it generated the best overall video playback results. Our differences in 1T and 2T timings in this test were minimal with WinRAR showing the only measurable benefits with our memory timings.
Media Encoding Performance
Our first encoding test is quite easy - we take our original Office Space DVD and use AnyDVD Ripper to copy the full DVD to the hard drive without compression, thus providing an almost exact duplicate of the DVD. We then fire up Nero Recode 2, select our Office Space copy on the hard drive, and perform a shrink operation to allow the entire movie along with extras to fit on a single 4.5GB DVD disc. We leave all options on their defaults except we turn off the advanced analysis option. The scores reported include the full encoding process and are represented in seconds, with lower numbers indicating better performance.
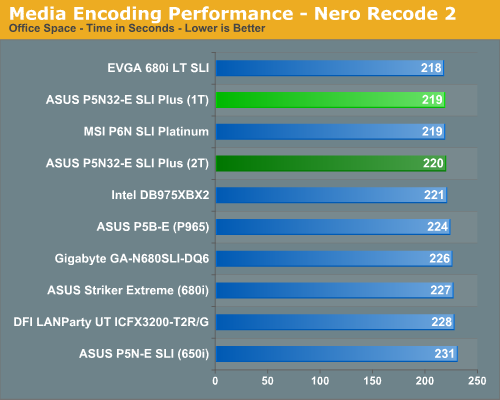
We continue to see a strong performance from the ASUS Plus board with the EVGA 680i LT SLI in our application tests finishing ever so slightly in front. We did not notice any differences in this test between 1T and 2T timings which surprised us as CPU throughput and disk access times are the critical factors affecting test scores. Media and Audio encoding are the few CPU centric tasks that NVIDIA chipsets handle well.
Audio Encoding Performance
While the media encoding prowess of the boards was superb in our initial media encoding testing, we wanted to see how they faired on the audio side. Our audio test suite consists of Exact Audio Copy v095.b4 and LAME 3.98a3. We utilize the INXS Greatest Hits CD that contains 16 tracks totaling 606MB of one time '80s hits. We set up EAC for variable bit rate encoding, burst mode for extraction, use external program for compression, and to start the external compressor upon extraction (EAC will read the next track while LAME is working on the previous track, thus removing a potential bottleneck with the optical drive). We also set the number of active threads to two to ensure both cores are active during testing. The results are presented in seconds for the encoding process, with lower numbers being better.
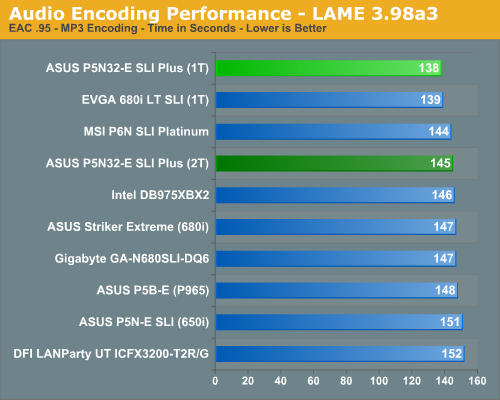
Our Plextor drive consistently took two minutes and nine seconds to read all sixteen tracks. This means our test systems are only utilizing one core during testing until the midway point of the extraction process where the drive speed begins exceeding the capability of the encoder and requires the use of a second thread.
As in the media encoding section, the more intensive CPU and storage system tests seem to favor the 975X over the P965/NV650i-680i/RD600 when running at the same memory timings. However, we are starting to notice a pattern in the latest NVIDIA releases where this is no longer the case, especially with 1T settings enabled on the NVIDIA chipset boards. This is especially true with the ASUS Plus board as we had a seven second difference between the two settings. We consider any results that differ greater than 5% to be noteworthy and depending upon the application, a difference that can be seen when using the systems on an every day basis.
We have almost completed the retesting all of our NVIDIA boards with 1T settings and will provide these results along with 2T timings in our next article if there are significant differences in performance. While the overall differences are minimal in the grand scheme of things, 1T performance can make a slight difference and is worth using if your RAM and motherboard can manage it.
File Compression Performance
In order to save space on our hard drives and ensure we had another CPU crunching utility, we will be reporting our file compression results with the latest version of WinRAR that fully supports multi-treaded operations and should be of particular interest for those users with dual core or multi-processor systems. Our series of file compression tests utilizes WinRAR 3.62 to compress our test folder that contains 444 files, ten subfolders, and 602MB worth of data. All default settings are utilized in WinRAR along with our hard drive being defragmented before each test.
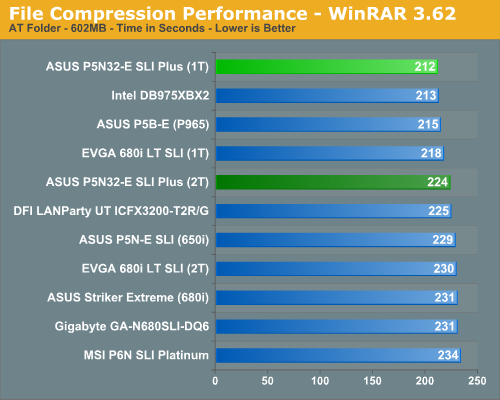
We had stated in our EVGA 680i LT SLI article, "When you need pure CPU crunching power, the Intel chipsets win hands down." Well, today we have to eat some humble pie as the ASUS implementation of the 650i chipset is now holds the performance lead in this CPU crunching benchmark with 1T timings implemented. In fact we have an almost 6% performance difference in this benchmark between timings and to be quite honest, we thought the board was even faster than the benchmarks indicate.
Standard Gaming Performance
As usual, gaming performance was tested with a variety of current games. We ran benchmarks with our standard 1280x1024 resolution without antialiasing enabled (and generally without anisotropic filtering, though that varies by game). Given the number of users that run 19" LCDs these days, 1280x1024 represents one of the most commonly used resolutions. We could certainly increase the amount of eye candy being displayed in most of the games, but as this is a motherboard benchmark we aren't particularly interested in maxing out the graphics cards in our tests.
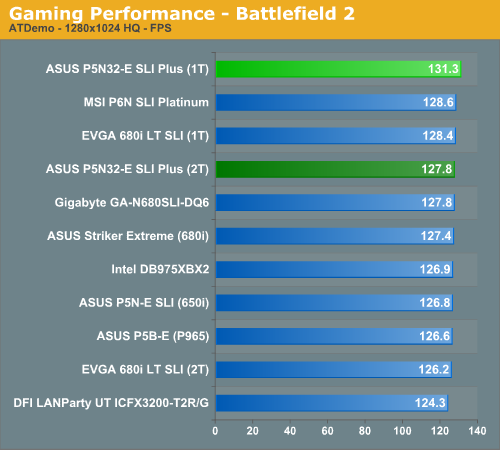
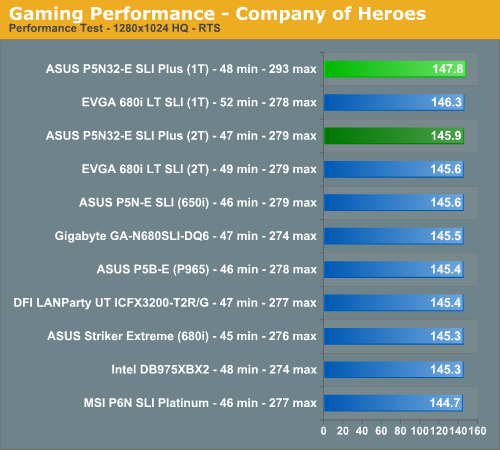
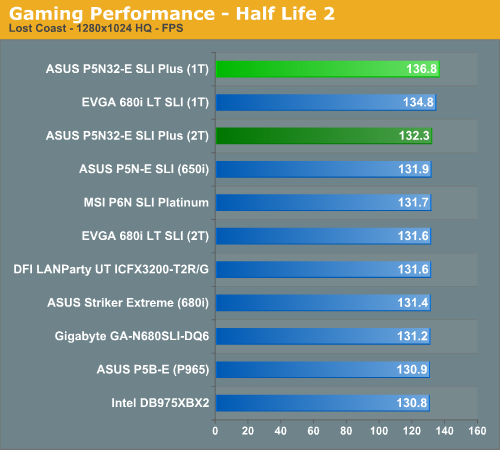
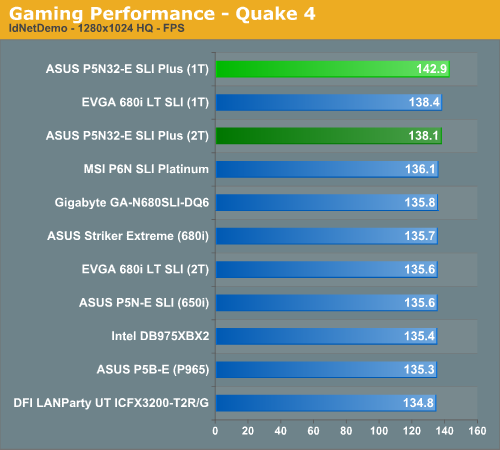
We still think it is basically a toss up as to which chipset you select for a gaming machine. All of the results are very close and during actual game play we could not tell any real differences between the boards. However, ASUS told us this board was optimized for game play and all indications from our test results agree with them. While the differences in overall scores are minimal to a degree, our subjective opinion after playing with the ASUS board for several weeks is that it's just a bit "snappier" than our other boards when it comes to game play. Our EVGA board also scored very well with 1T enabled but still could not keep pace with the ASUS board due to its extremely aggressive sub-timings.
We did not experience any issues during testing or during game play with the ASUS board at stock settings with our memory choice. We did encounter some issues with our budget memory modules due to the very tight memory sub-timings but once we relaxed tRC, tRFC, and tRRD timings the board was very stable. We generally play over a dozen different games for at least a couple of hours on each board to ensure there are no issues such as overheating, stuttering, or network issues when playing online with a various combination of components.
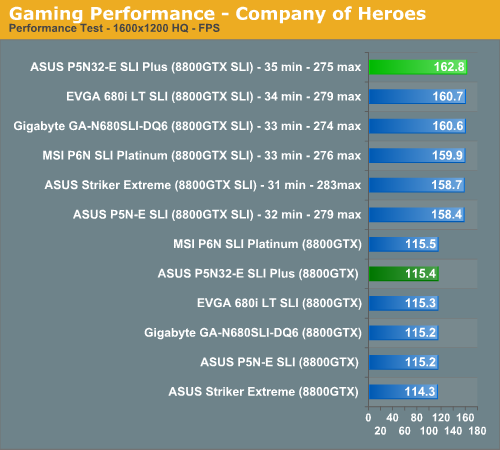
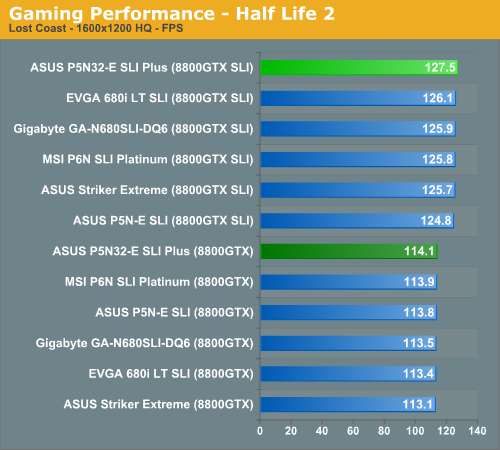
In our limited SLI testing, we once again find our ASUS P5N32-E SLI Plus taking top honors in our test results due to superior memory performance. We still have not seen any noticeable differences in 8800GTX SLI performance between the 680i, 650i hybrid, and 650i chipsets up to 1920x1200 resolutions in games. Any test result differences can be attributed to the performance of the board/BIOS itself and not the PCI Express design. It is only when you crank up the resolution to 2560x1600 or increase AA/AF settings that the dual x16 PCI Express capability on the 680i performs better than the dual x8 PCI Express setup on 650i setups. We will have additional game and resolution results in our roundup article.
Disk Controller Performance
The AnandTech iPeak test is designed to measure "pure" hard disk controller performance, and in this case, we keep the hard drive as consistent as possible while varying the hard drive controller. The idea is to measure the performance of each hard drive controller with the same hard drive.
We played back our raw files that are recorded I/O operations when running a real world benchmark - the entire Winstone 2004 suite. Intel's iPeak utility was then used to play back the trace file of all I/O operations that took place during a single run of Business Winstone 2004 and MCC Winstone 2004. The drive is formatted before each test run and a composite average of three tests on each controller interface is tabulated in order to ensure consistency in the benchmark.
iPeak gives a mean service time in milliseconds; in other words, the average time that each drive took to fulfill each I/O operation. In order to make the data more understandable, we report the scores as an average number of I/O operations per second so that higher scores translate into better performance. This number is meaningless as far as hard disk performance is concerned, as it is just the number of I/O operations completed in a second. However, the scores are useful for comparing "pure" performance of the storage controllers in this case.
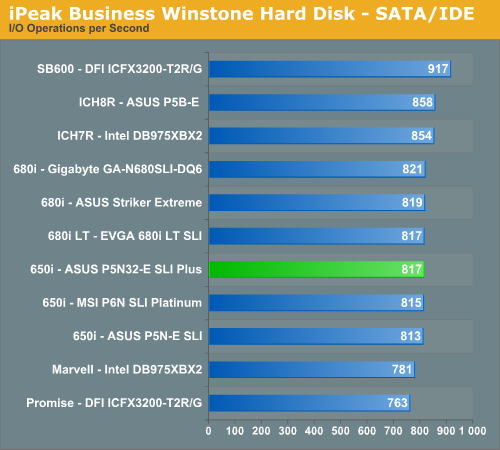
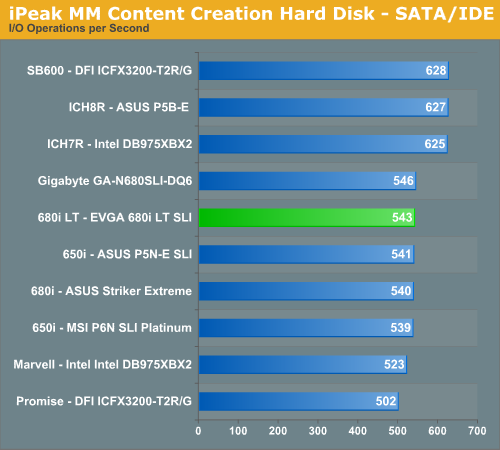
The performance patterns hold steady across both Multimedia Content I/O and Business I/O with the SB600 outperforming the Intel ICH7R, Intel ICH8R, and NVIDIA 680i/650i chipsets in our non-Raid tests. The Promise controller on the DFI board is the slowest of all solutions with the Marvell controller on the Intel 975X performing only slightly better. The 680i and 650i MCP chipsets are different but their disk performance in our tests is basically alike. We also ran RAID 0 and RAID 5 tests on each controller with the results being in favor of the 680i MCP by around 2% over the 680i LT and 650i MCP in these particular benchmarks. Although our NVIDIA boards generally score lower in these "pure" throughput tests, we find their actual performance in disk intensive applications are generally equal to or better than the other solutions.
Power Consumption
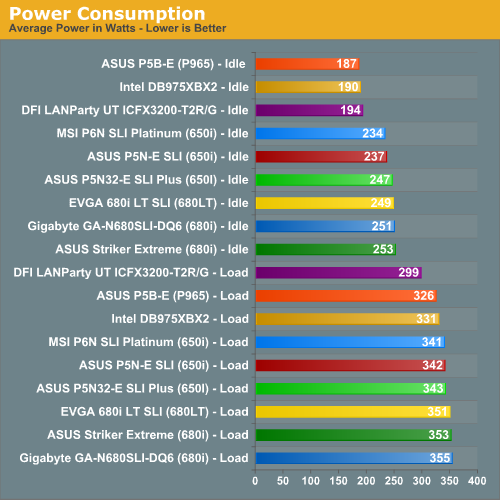
Our power consumption numbers are based on our test setup for this article that consists of the MSI 8800GTX video card and our boards have C1E/EIST turned off. The 680i boards lead all in power consumption but the ASUS P5N32-E SLI Plus is right behind indicating that the 570 SLI MCP draws slightly more power than the 430 MCP on the true 650i boards. The P965 consumes the least amount of power at idle but around 10% more than the RD600 at load. The 975X still offers a decent level of power conservation compared to the other chipsets even though it is getting long in the tooth.
FSB Overclocking
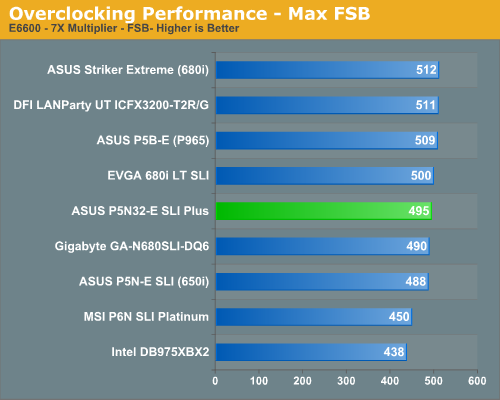
While the ASUS P5N32-E SLI Plus offers very good overclocking capabilities, it quickly runs out of headroom near the 500FSB level. We believe this is a limitation of the 650i SPP based upon our results with other 650i boards. ASUS has extracted just about every ounce of performance out of this particular chipset. While it may not satisfy the extreme overclocker, the overclocking levels should be fine for a majority of users.
We found during overclocking that we had to set the CPU voltages a little higher than on the other boards to attain the same or better overclocks. We experienced this with the MSI 650i and EVGA 680i LT SLI boards, and it was generally due to tighter memory/chipset timings in order to improve the performance of the board at stock speeds. Overall, our overclocking experiences were very good provided we had the memory sub-timings dialed in for each memory type we utilized.
Final Impressions
This is our first look at an NVIDIA hybrid configuration for the Intel platform. ASUS has done an amazing job combining the 650i SPP and 570 SLI MCP chipset into a board design that offers the same basic features of the 680i SLI chipset at a very competitive price point. This is the same philosophy that NVIDIA is using with the 680i LT SLI chipset, only their first implementation fell a bit short in features when compared to the ASUS solution. Certainly both designs have their own strengths and weakness but at this time we feel like ASUS did a better job when they decided to lower the price point for obtaining 680i features and performance.
This does not mean the 680i LT SLI is not a viable product; between the two designs we certainly think it is the more elegant solution although the actual implementation on the EVGA board lacked a finishing coat of polish. However, with the OEM version (two year versus lifetime warranty) of the EVGA board now selling for around $159 we think the board is a very good value considering its performance. One would still be hard pressed to fall in love with its active cooling or neutered BIOS, but at certain price points it becomes easier to overlook a few flaws that are not fatal to the quality or performance of the board. Where does that leave us with the ASUS board?
 |
We did not have too many issues with the board over a grueling six week test schedule. The overclocking aspects of the board do not reach the same levels as other 680i boards and will probably not satisfy the extreme overclocker or a user needing high FSB speeds with a quad core processor. However, the overclocking abilities of this board will satisfy the majority of users and stock performance in most applications and games is nothing short of amazing with the right memory installed.
Memory performance is exceptional for an NVIDIA based Intel chipset, and our internal tests reveal a 23% advantage in Sandra unbuffered test results. This memory performance directly influences the test results we witnessed across a variety of benchmarks. The issue is that a user will need high performance memory to take advantage of the tight sub-timings that ASUS has designed into the BIOS. We certainly recommend fairly low latency memory for this board along with the capability of running at 1T Command rates around the DDR2-800 level.
In all honesty, the performance differences between our budget memory modules and the higher performing modules were usually less than 5% in extended testing. The important factor to consider is that this board is one of the few that is able to fully take advantage of our higher performance modules by offering stable 1T operation with very aggressive memory sub-timings. We are still testing this board with a wide variety of memory modules but if you have the patience to tweak and test memory settings, this board will reward you with measurable performance improvements across the board.
In the end, none of this really matters unless the board offers a high degree of quality, performance, and support. We feel like ASUS offers all of these and more with this board. We fully expect the pricing to drop a little more now that the 680i LT SLI chipset has been introduced, but when looking at boards in the $150~$200 price range we feel like ASUS has hit the nail on the head with the P5N32-E SLI Plus. It might not do everything "perfect" and it isn't designed for everyone, but it offers more than the sum of its parts would indicate and that is something we are just not use to seeing very much. We congratulate ASUS on a job well done and look forward to their next opportunity when they have to engineer a new product to satisfy a market demand instead of providing the same old product with a different marketing spin.


