Original Link: https://www.anandtech.com/show/2193
Hitachi Deskstar 7K1000: Terabyte Storage arrives on the Desktop
by Gary Key on March 19, 2007 8:00 AM EST- Posted in
- Storage
Hitachi Global Storage Technologies announced right before CES 2007 they would be shipping a new 1TB (1000.2GB) hard disk drive in Q1 of this year at an extremely competitive price of $399 or just about 40 cents per GB of storage. We fully expected Seagate to beat Hitachi in the race to single terabyte drive offerings based upon expectations after their 750GB drive shipped last June. However, it now appears the Seagate Barracuda 7200.11 1TB drive will not ship until Q2 of this year leaving Hitachi alone at the top of the storage capacity mountain for now.
The Seagate delay appears to have come from their decision to move to 250GB per-platter capacities while Hitachi is launching their Deskstar 7K1000 with a 200GB per-platter capacity. From all indications, Seagate's drive will continue to have a 16 MB cache setup while Hitachi has wisely chosen to implement a 32 MB cache for their five platter design. Hitachi has informed us they have the capability to go to 250GB per-platter designs but launched at smaller capacities to ensure their reliability rate targets were met. Considering the absolute importance of data integrity we think this was a wise move.
What we did not expect was that this drive would be offered exclusively through Dell or its subsidiary Alienware in select XPS, Aurora, or Area 51 gaming desktop systems before general retail availability in the next two to three weeks. With the immediate availability of the Deskstar 7K1000 from Dell or Alienware also comes a new program that is being offered to its customers called StudioDell. StudioDell is a community website that allows general consumers and business customers to see tips and trends in technology, as well as submit their own videos showcasing how they are using technology in innovative ways. All video content submitted to StudioDell for the remainder of 2007 will be copied onto a 1TB Hitachi Deskstar 7K1000 hard drive and will be stored for 50 years on the Dell campus in Round Rock, TX. You can visit the StudioDell website for more details.
For over fifty years, the storage industry has been on a path where the longitudinal technology currently utilized would eventually become a limiting factor in drive capacities. Over the last decade the drive manufacturers have been doubling and at times quadrupling storage capacity at a dizzying rate in order to meet continuing demands from users. In fact, it took the industry almost 35 years to reach the 1GB level, another 14 years to reach 500GB, and now with perpendicular recording technology, less than two years to reach 1TB.
The standard method of increasing the amount of capacity in a drive is to either add more platters or increase the density of the data on each platter. Increasing the density of data that can be stored on a platter is the preferred design as it will allow for an overall increase in drive storage along with resulting performance and cost advantages by reducing the number of components. However, this solution requires significantly more effort from a research and development viewpoint that can lead to additional complexity and cost. While the storage manufacturers have been able to develop and implement some incredible technologies to achieve the capacities, cost, and drive performance we currently experience there is a limit to what can be achieved with longitudinal recording technology.
The next evolutionary step in the storage industry for solving today's current issues is the utilization of perpendicular recording technology. This technology has been researched and discussed for a number of years by the various drive manufacturers while it has its roots in the late 19th century work of Danish scientist Valdemar Poulsen, who is generally considered to be the first person to magnetically record sound using perpendicular recording technology.
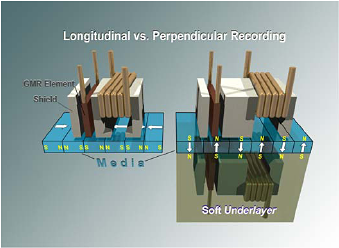
What is Perpendicular Recording Technology? Simply put, during perpendicular recording the magnetization of the disc stands on end, perpendicular to the plane of the disc, instead of lying in the disc's plane as it does in current longitudinal recording. The data bits are then represented as regions of upward or downward directed magnetization points, whereas in longitudinal recording, the data bit magnetization lies in the plane of the disc and switches between pointing in the same and then opposite directions of the head movement. The media is written to a soft magnetic under-layer that functions as part of the write field return path and basically generates an image of the recording head that doubles the available recording field resulting in a higher recording density compared to longitudinal recording.
In order to increase areal densities and provide greater storage capacity in longitudinal recording, the data bits must be arranged and shrunk in a very tight pattern on the disc media. However, if the data bit becomes too small, the magnetic energy holding the bit in place can become so small that thermal energy can cause it to demagnetize resulting in a condition known as superparamagnetism.
To avoid superparamagnetism, engineers have been increasing the coercivity, the field size required to write a bit, of the disc media. These fields are limited by the magnetic materials making up the write head that will soon effectively limit drive sizes utilizing longitudinal recording. Although additional capacities are still achievable, the drive industry is in the process of moving to perpendicular recording technology as longitudinal recording has basically hit the proverbial brick wall after being utilized for 50 plus years.
Perpendicular recording will eventually enable areal densities of up to 500 Gbpsi (Gigabits per square inch) with current technology as compared to 110 Gbpsi rates in today's longitudinal recording designs. This results in an almost five fold increase in storage capacities with a typical 3.5-inch desktop drive being able to store 2TB of information in the near future. If all of this sounds a little daunting, then Hitachi developed a simple explanation of PMR in their Get Perpendicular presentation, but be forewarned as the jingle might get stuck in your head for the rest of the day. For those who are in the need for additional technical details then we suggest a good cup of coffee and a visit to the white papers section over at Hitachi.
Let's see how the newest Deskstar 7K1000 performs against other SATA based drives.
Feature Set: Hitachi 7K1000
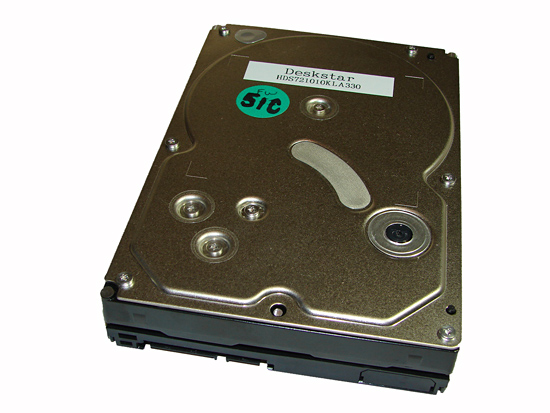
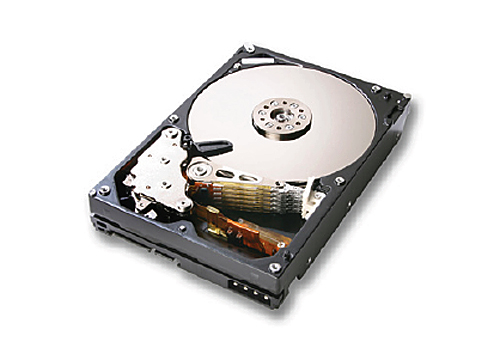
The external design of the Hitachi 7K1000 is the same as the majority of the TK or K series drives. The drive is based on the industry standard 3.5" form factor platform and would normally have the pertinent part number and warranty information embossed on a white sticker on the top of the casing. However, our O.E.M. sample was graciously provided by Dell and does not include this information. The only other differences between the O.E.M. and retail units will be the inclusion of an accessory kit, HD Feature Tool software (that can be downloaded separately), and the obligatory retail packaging.
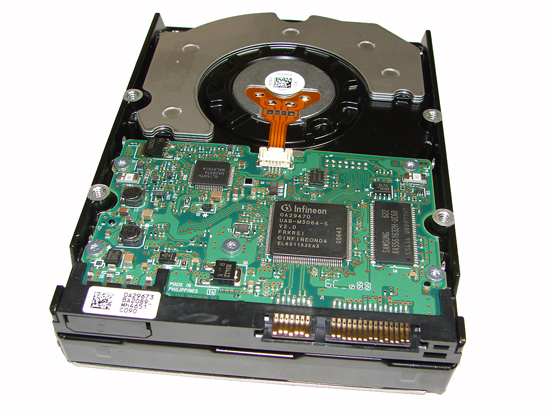
The Deskstar 7K1000 ships with the Serial ATA data and power connector along with a space for a 4-pin Molex power connector designed for use with older ATX power supplies. Our early press photos included the 4-pin Molex connector but it appears the inclusion of it will be at the discretion of the O.E.M. or distribution locality. The 32MB of cache memory and controller logic is located on the outer side of the PCB.
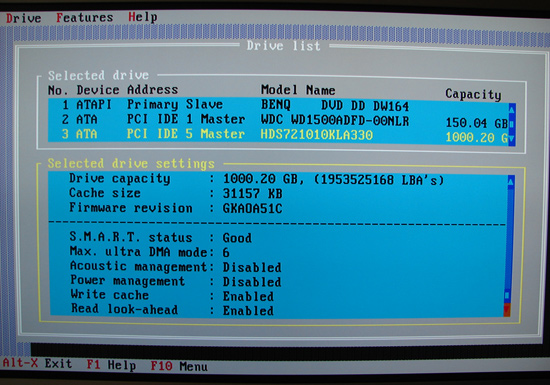
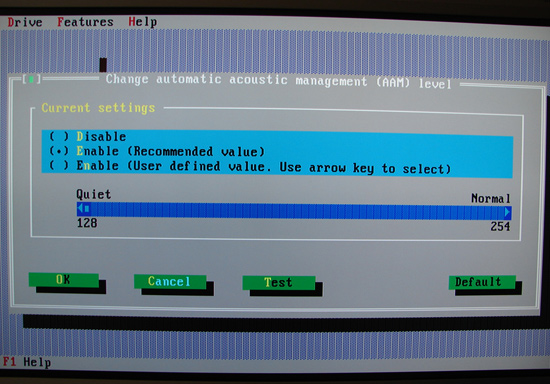
Hitachi offers their excellent DOS based HD Feature Tool that allows the user to view the specifics of the drive and change certain options such as S.M.A.R.T., AAM, Power Management, and read and write optimizations. Our drive arrived with Automatic Acoustic Management turned on and set to the quietest level. We were able to easily set different levels or turn off AAM altogether. We found in our limited acoustical testing there was not a real difference between the 128 and 256 setting. Performance was slightly affected with AAM implemented but we felt the benefits of having it turned on outweighed any performance impact.
Hard Disk Test Comparison and Features
| Hard Drive Specifications | |||
| Hitachi Deskstar 7K1000 1000GB HDS721010KLA330 | Seagate Barracuda 7200.10 750GB ST3750640AS | Western Digital Raptor 150GB WD1500ADFD | |
| Manufacturer's Stated Capacity: | 1000.2GB (1 Terabyte) | 750GB | 150GB |
| Operating System Stated Capacity: | 931.5 GB | 698.6 GB | 139.73 GB |
| Interface: | SATA 3Gb/s | SATA 3Gb/s | SATA 1.5Gb/s |
| Rotational Speed: | 7,200 RPM | 7,200 RPM | 10,000 RPM |
| Cache Size: | 32 MB | 16 MB | 16 MB |
| Average Latency: | 4.17 ms (nominal) | 4.16 ms (nominal) | 2.99 ms (nominal) |
| Read Seek Time: | 8.5 ms / 14ms Silent | 11 ms | 4.6 ms |
| Number of Heads: | 10 | 8 | 4 |
| Number of Platters: | 5 | 4 | 2 |
| Power Draw Idle / Load: | 8.1W / 12.8W | 9.3W / 12.6W | 9.19W / 10.02W |
| Power Draw Silent I / L: | 4.3W / 9.9W | - | - |
| Command Queuing: | Native Command Queuing | Native Command Queuing | Native Command Queuing |
| Warranty: | 3 Year - Retail or OEM | 5 Year - Retail or OEM | 5 Year - Retail or OEM |
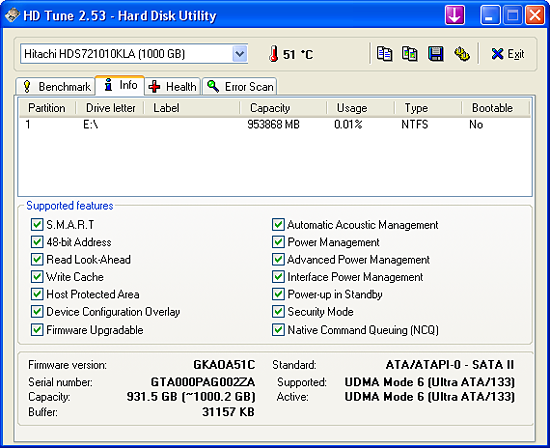
The Hitachi Deskstar 7K1000 is the first 1TB drive to ship based upon manufacturer's specifications with a 750 GB offering scheduled for availability next quarter. Of course the actual capacity of the drive is 931.5 GB, but due to the way manufacturers report capacity the drive is considered to be a 1TB offering. This drive is also Hitachi's first 3.5-inch hard drive to use PMR technology. Additional 1TB versions for the Enterprise and DVR/Set-Top markets will be released later this year.
The 7K1000 features a 5-platter 10-head perpendicular magnetic recording design with rotational speeds at 7200rpm. The cache size has been increased to 32MB from the previous 16MB on the TK series. Hitachi includes their ramp load/unload, advanced low-power idle modes, and thermal-fly height control technologies. This drive series also supports Native Command Queuing and hot-swap capabilities. The Hitachi Deskstar 7K1000 drives ship with a three year warranty and additional specifications can be found here.
The Hitachi 7K1000 drive we are reviewing today will be compared directly against the Seagate ST3750640AS 750GB and WD WD1500AHFD 150GB drives in our limited benchmark test suite. We have also included the results of drives from our previous articles and will provide additional results of the 7K1000 in our upcoming 500GB roundup.
Hardware Setup
| Standard Test Bed Playback of iPEAK Trace Files and Test Application Results |
|
| Processor: | AMD Opteron 170 utilized for all tests |
| RAM: | 2 x 1GB Corsair 3500LL PRO Settings - DDR400 at (2.5-3-3-7, 1T) |
| OS Hard Drive: | 1 x Western Digital 7200 RPM SATA (16MB Buffer) |
| System Platform Drivers: | NVIDIA Platform Driver - 6.85 |
| Video Card: | 1 x Asus 7600GS (PCI Express) for all tests. |
| Video Drivers: | NVIDIA nForce 84.21 WHQL |
| Optical Drive: | BenQ DW1640 |
| Cooling: | Zalman CNPS9500 |
| Power Supply: | Corsair HX620W |
| Case: | Gigabyte 3D Aurora |
| Operating System: | Windows XP Professional SP2 |
| Motherboard: | MSI K8N Diamond Plus |
Our current test bed reflects changes in the marketplace over the past six months. Based upon the continuing proliferation of dual core processors and future roadmaps from AMD and Intel signifying the end of the single core processor on the desktop in the near future, we settled on an AMD Opteron 170. This change will also allow us to expand our real world multitasking benchmarks in the near future while providing a stable platform for the next six months. We are currently conducting preliminary benchmark testing under Vista with both 2GB and 4GB memory configurations. We will offer real-world Vista benchmarks once the driver situation matures but IPEAK results will continue to be XP based as the application is not compatible with Vista.
Test Setup - Software
With the variety of disk drive benchmarks available, we needed a means of comparing the true performance of the hard drives in real world applications. While we will continue to utilize HDTach and PCMark05 for comparative benchmarks our logical choice for application benchmarking is the Intel iPeak Storage Performance Toolkit version 3. We originally started using this storage benchmark application in our Q2 2004 Desktop Hard Drive Comparison. The iPeak test can be designed to measure "pure" hard disk performance, and in this case we kept the host adapter consistent while varying the hard drive models. The idea is to measure the performance of individual hard drives with a consistent host adapter.
We utilize the iPeak WinTrace32 program to record precise I/O operations when running real world benchmarks. We then utilize the iPeak AnalyzeTrace program to review the disk trace file for integrity and ensure our trace files have properly captured the activities we required. Intel's RankDisk utility is used to play back the workload of all I/O operations that took place during the recording. RankDisk generates results in a mean service time in milliseconds format; in other words, it gives the average time that each drive took to fulfill each I/O operation. In order to make the data more understandable, we report the scores as an average number of I/O operations per second so that higher scores translate into better performance in all of our iPeak results. While these measurements will provide a score representing "pure" hard drive performance, the actual impact on the real world applications can and will be different.
Each drive is formatted before each test run and three tests are completed in order to ensure consistency in the benchmark results. The high and low scores are removed with the remaining median score representing our reported result. We utilize the NVIDIA nF4 SATA ports along with the NVIDIA IDE-SW driver to ensure consistency in our playback results when utilizing NCQ, TCQ, or RAID settings. Although we test NCQ capabilities, all of our reported results are generated with NCQ off unless otherwise noted. We will test our Deskstar 7K1000 with AAM and NCQ turned on as AAM does not noticeably impact performance and this drive performs better with NCQ on in the majority of our tests.
Our iPeak tests represent a fairly extensive cross section of applications and usage patterns for both the general and enthusiast user. We will continually tailor these benchmarks with an eye towards the drive's intended usage and feature set when compared to similar drives. In essence, although we will reports results from our test suite for all drives, it is important to realize a drive designed for PVR duty will generate significantly different scores in our gaming benchmarks than a drive designed with gaming in mind such as the WD Raptor. This does not necessarily make the PVR drive a bad choice for those who capture and manipulate video while also gaming. Hopefully our comments in the results sections will offer proper guidance for making a purchasing decision in these situations. Our iPeak Test Suite consists of the following benchmarks.
VeriTest Business Winstone 2004: trace file of the entire test suite that includes applications such as Microsoft Office XP, WinZip 8.1, and Norton Antivirus 2003.
VeriTest Multimedia Content Creation 2004: trace file of the entire test suite that includes applications such as Adobe Photoshop 7.01, Macromedia Director MX 9.0, Microsoft Windows Media Encoder 9.0, Newtek Lightwave 3D 7.5b, and others.
AVG Antivirus 7.1.392: trace file of a complete antivirus scan on our test bed hard drive.
Microsoft Disk Defragmenter: trace file of the complete defragmentation process after the operating system and all applications were installed on our test bed hard drive.
WinRAR 3.51: trace file of creating a single compressed file consisting of 444 files in 10 different folders totaling 602MB. The test is split into the time it takes to compress the files and the time it takes to decompress the files.
File Transfer: individual trace files of transferring the Office Space DVD files to our source drive and transferring the files back to our test drive. The content being transferred consists of 29 files with a content size of 7.55GB.
AnyDVD 5.9.6: trace file of the time it takes to "rip" the Office Space DVD. We first copy the entire DVD over to our source drives, defragment the drive, and then measure the time it takes for AnyDVD to "rip" the contents to our test drive. While this is not ideal, it does remove the optical drive as a potential bottleneck during the extraction process and allows us to track the write performance of the drive.
Nero Recode 2: trace file of the time it takes to shrink the entire Office Space DVD that was extracted in the AnyDVD process into a single 4.5GB DVD image.
Game Installation: individual trace files of the time it takes to install Sims 2 and Battlefield 2. We copy each DVD to our secondary test drives, defragment the drive, and then install each game to our source drive.
Game Play: individual trace files that capture the startup and about 15 minutes of game play in each game. The Sims 2 trace file consists of the time it takes to select a pre-configured character, setup a university, downtown, business from each expansion pack (pre-loaded), and then visit each section before returning home. Our final trace file utilizes Battlefield 2 and we play the Daqing Oilfield map in both single and multiplayer mode.
Hard Disk Performance: HD Tune
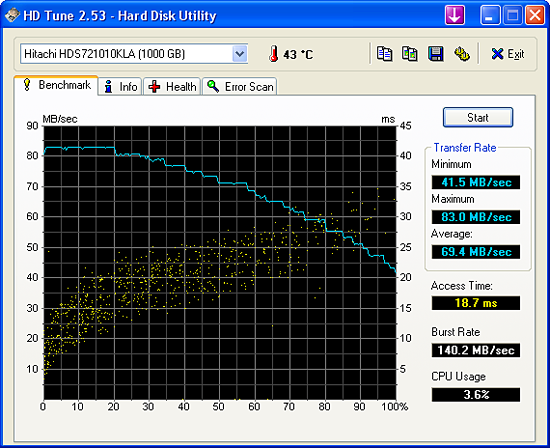
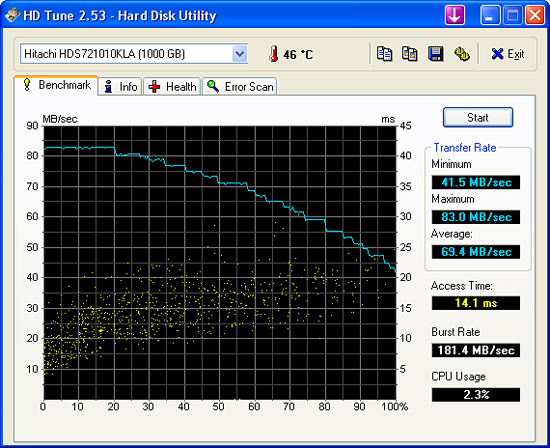
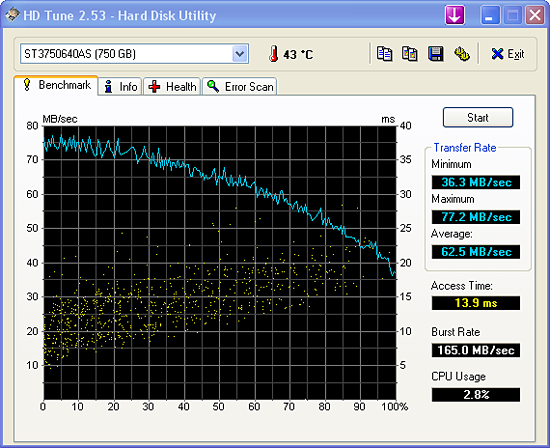
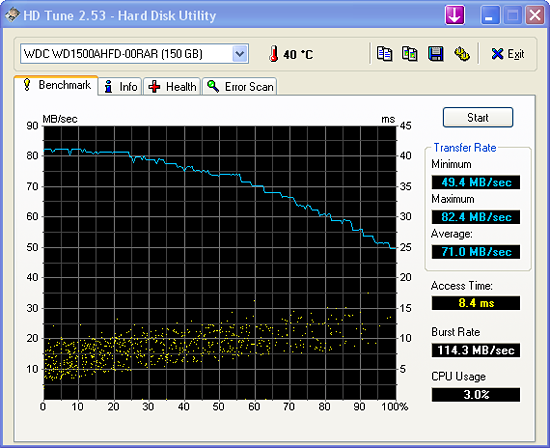
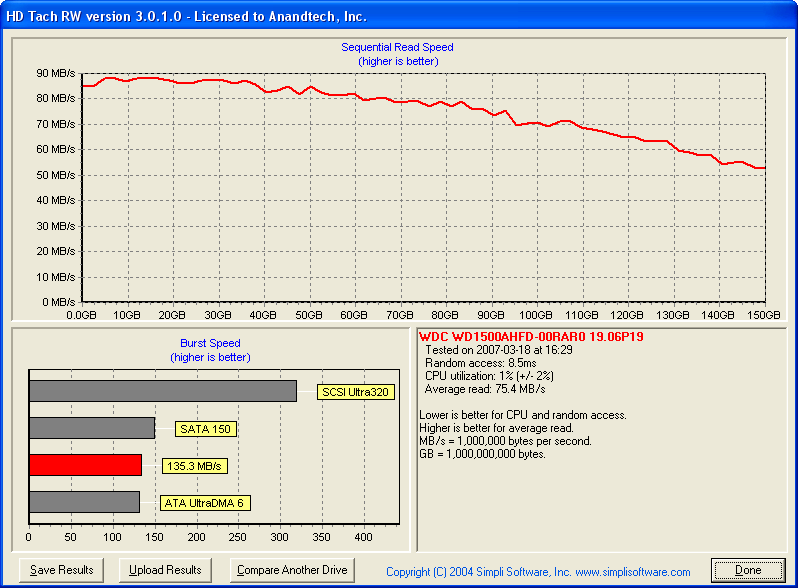
The Hitachi Deskstar 7K1000 has the second highest overall sustained transfer rates of the three drives listed. The sustained transfer rate is nipping on the heels of the WD1500AHFD in this test while the maximum transfer rate is slightly ahead and the minimum results are about 17% slower. Our first screenshot is the Hitachi drive with Automatic Acoustic Management and NCQ turned on. The second screenshot has both features turned off. We also tested with AAM off and NCQ on with the burst rate results mirroring the first screenshot and the access time mirroring the second screenshot. This means that NCQ being turned off is what affected burst transfer rates and AAM being on increased the access times in these synthetic tests.
We did not expect this as previous test results with several drives showed that AAM usually caused a performance penalty in both transfer and access time rates. In our application tests we found that enabling AAM usually did not alter the test results more than 1% and at times the scores were even or slightly better (other than the lower access times). Even though the 7K1000 drive has excellent sustained transfer rates we will soon see this does not always translate into class leading performance.
Hard Disk Performance: HD Tach
 |
 |
 |
 |
| Click to enlarge |
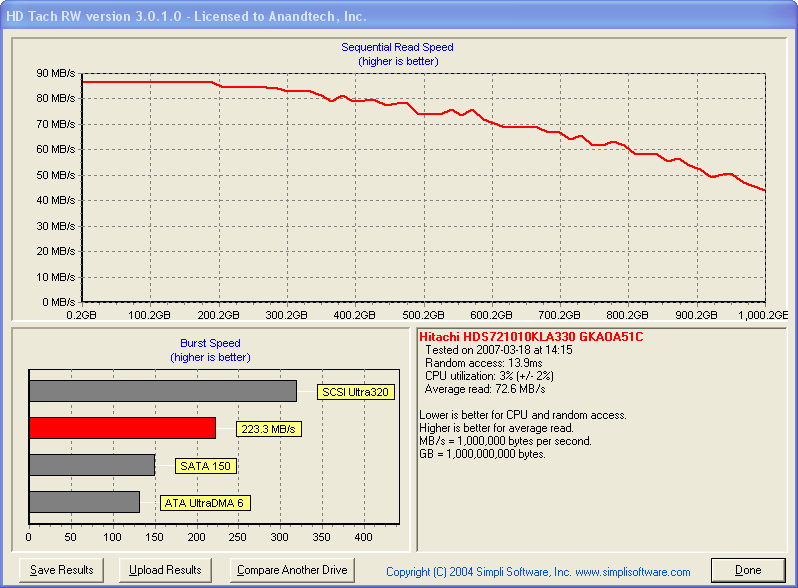
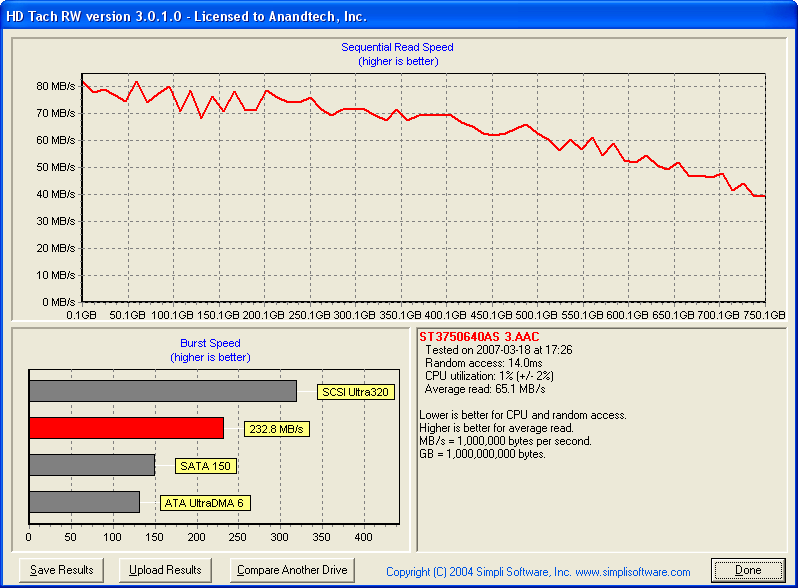
We are also including HD Tach results for each drive. Once again the first screenshot has the 7K1000 test score with AAM and NCQ turned on while the second screenshot is with both options turned off. Our tests with AAM turned off and NCQ on resulted in scores nearly identical to the HD Tune results indicating once again that AAM does not inflict a noticeable performance penalty on this drive. The balance of the performance results between our test samples basically mirrors those of our HD Tune scores.
Hard Drive Performance: Acoustics
Our acoustic test utilizes our standard test bed components but we implement AMD's Cool'n'Quiet technology and turn off the case fans to isolate as much case noise as possible during testing. Our OCZ power supply is nearly silent in these tests and our fanless ASUS 7600GS video card provides a further decrease in our case's ambient noise levels. Our drives are attached to the drive cage with rubber bushings to assist in isolating the noise of the drive without resulting harmonic changes due to the case design
Our acoustic tests are designed to measure the decibel levels while the system is at idle and also under load while running the General Hard Disk Drive Usage benchmark within PCMark 2005. We found through trail and error that this particular benchmark produces controlled readings across a wide range of applications within the benchmark. This particular benchmark utilizes 60% reads and 40% writes within the trace playback file.
The measurements are taken at a distance of 5 millimeters from the rear and front of the drive being tested in order to minimize surrounding environmental noise. We take our measurements over a period of twenty minutes, so idle measurements will include operating system interrupt and polling routines. We have noticed that unless we run a silent system in a near silent room that measurements taken from 1 meter are generally not meaningful due to ambient noise levels. There are exceptions like the Raptor series of drives but overall most modern desktop drives are quieter now than the other components in the system.
The reported measurements are based on an A-weighted decibel score that measures frequencies similar to the way the human ear responds to sound. We take a total of three measurements for each test. We then subtract the high and low scores and arrive at our findings by reporting the remaining score.
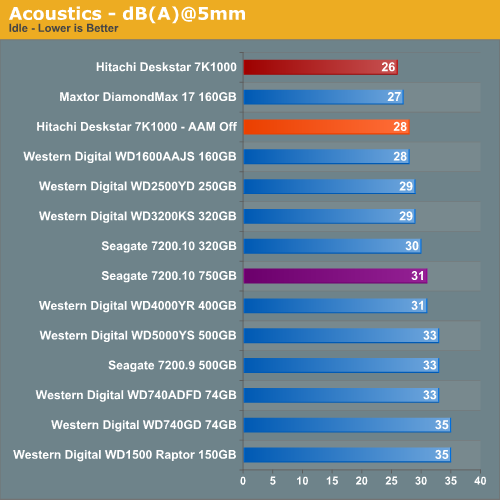
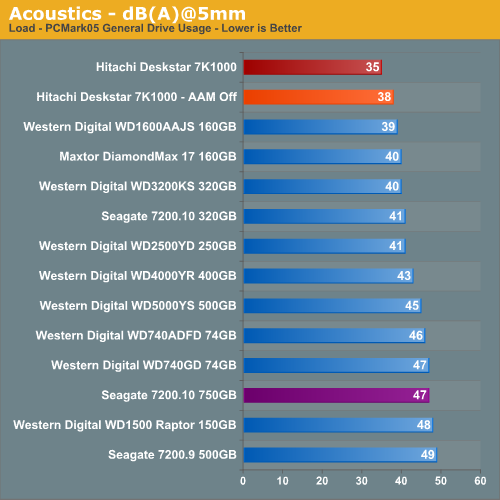
Our Hitachi Deskstar 7K1000 is the quietest drive that we have ever tested. We basically could not hear the drive and at times wondered if it was operating with AAM turned on. Even with AAM turned off, the drive was extremely quiet at idle and under load where it still scored better than our other test units. Our subjective opinion with AAM turned off is that the seek requests are muted greatly but still noticeable when compared to the other drives. The only other significant audible noise is a slight whirling sound as the drive spins up on a cold start or after a reboot. We just cannot emphasize enough how quiet this drive is in our test configuration with AAM enabled at the 128 setting. We even removed the rubber mounting grommets in our drive cage and did not notice any differences in acoustics or vibration levels. Our base dB(A) level in the room at time of testing was 25 dB(A).
Hard Drive Performance: Thermals
Our thermal tests utilize sensor readings via the S.M.A.R.T. (Self-Monitoring, Analysis and Reporting Technology) capability of the drives and are reported by utilizing the Active SMART 2.42 utility. We test our drives in an enclosed case environment without the front fan operational to simulate temperatures that could conceivably be reached in a SFF or HTPC case design. We typically find the reported numbers drop anywhere from 18% to 25% on average when the front fan is operational.
We typically let the drive idle for fifteen minutes before starting our idle thermal testing. Our load testing consists of taking the high temperature reading after looping the PCMark 2005 HD Suite benchmark five times. We also check load temps after looping our Nero Recode encoding test three times.
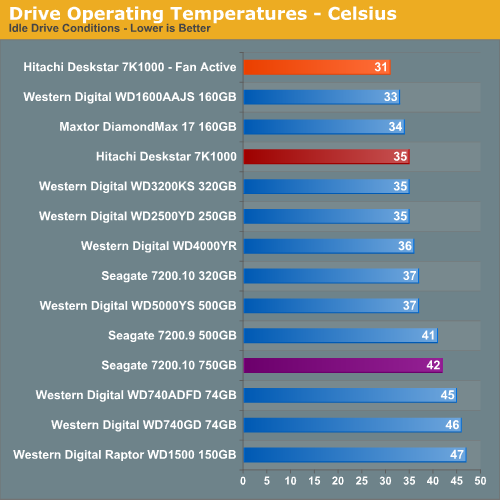
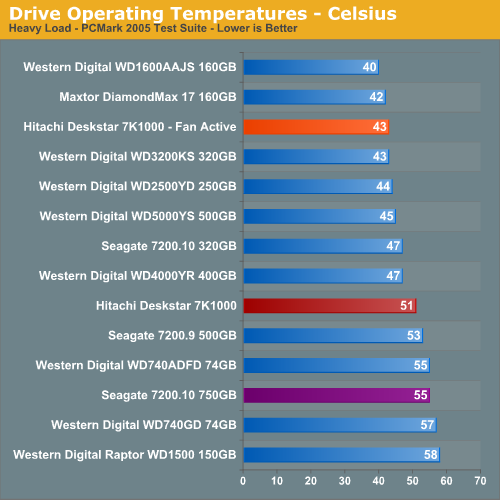
We expected the 7K1000 to run as warm as the Seagate 750GB due to the five platter design. However, under both idle and load conditions it operated significantly cooler than Seagate's large capacity PMR design. We have additional power and thermal management tests to run but at this time we were pleasantly surprised with the results. The load temperatures dropped from 51C to 43C and idle temps dropped from 35C to 31C with our front case fan operational. We highly recommend a fan be installed near the drive during normal operation. Our test room temperatures were 24C during these tests.
PCMark05 Performance
We are utilizing the HDD test suite within PCMark05 for further comparative hard disk scores as it provides a mixture of actual application results and specific read/write percentages utilized within these programs. It is also a readily available benchmark that others can use for comparative purposes. The program utilizes the RankDisk application within the Intel iPeak SPT suite of tools to record a trace of disk activity during usage of real world applications. These traces are then replayed to generate performance measurements based upon the actual disk operations within each application. The HDD test suite contains 53% read and 47% write operations with each trace section utilizing varied amounts of read or write operations. Additional information about the test suite can be found in PDF format here PCMark05 whitepaper.
The PCMark05 test results are based upon the following trace runs:
Windows XP Startup: This test consists of 90% reading and 10% writes that tracks XP activities at start-up.
Application Loading: This test consists of 83% reading and 17% writes that tracks the opening and closing of the following programs.
- Microsoft Word
- Adobe Acrobat Reader
- Windows Media Player
- 3Dmark 2001SE
- Leadtek WinFast DVD
- Mozilla Internet Browser
- Opening a Microsoft Word document, performing grammar check, saving and closing
- Compression and decompression using WinZip
- Encrypting and decrypting a file using PowerCrypt
- Scanning files for viruses using F-Secure Antivirus
- Playing an MP3 file with Winamp
- Playing a WAV file with Winamp
- Playing a DivX video using the DivX codec and Windows Media Player
- Playing a WMV video file using Windows Media Player
- Viewing pictures using Windows Picture Viewer
- Browsing the Internet using Microsoft Internet Explorer
- Loading, playing and exiting a game with Tom Clancy's Ghost Recon
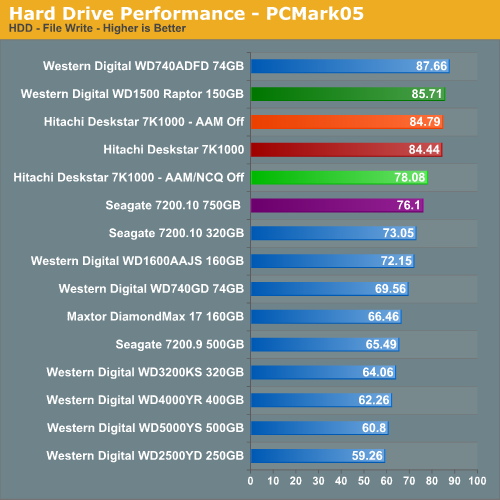
File Write: This test consists of 100% write activities by writing 680MB of files onto the hard disk.
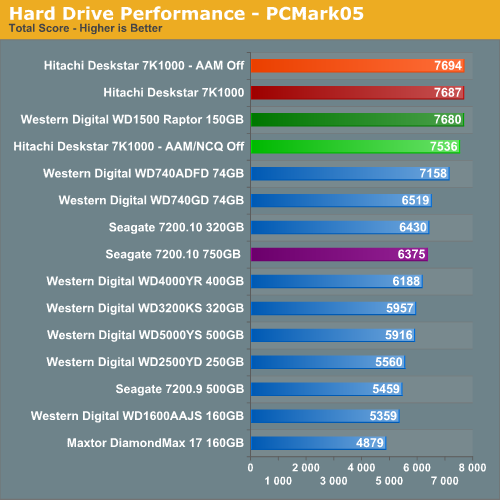
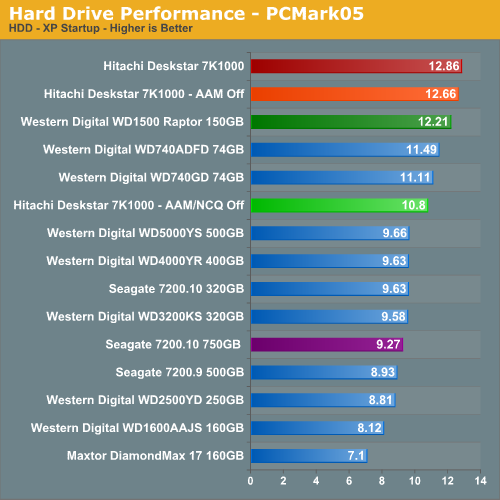
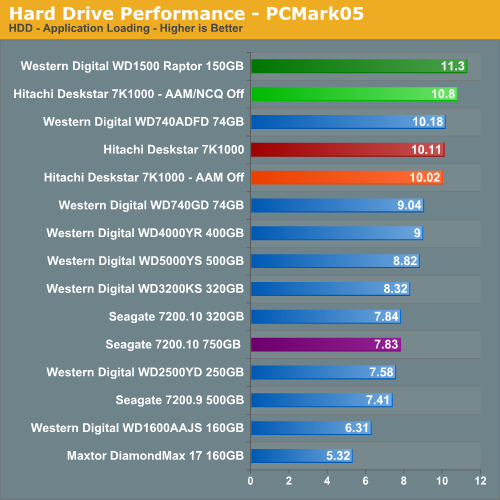
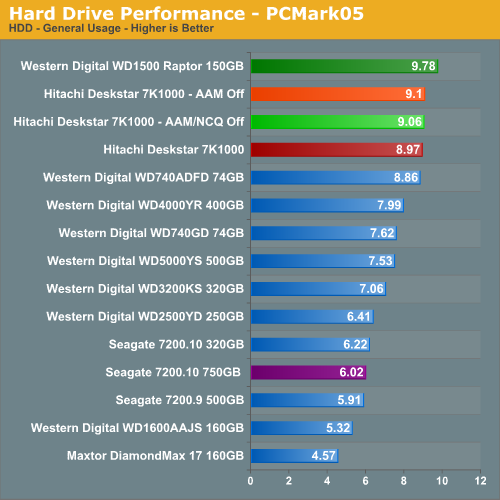
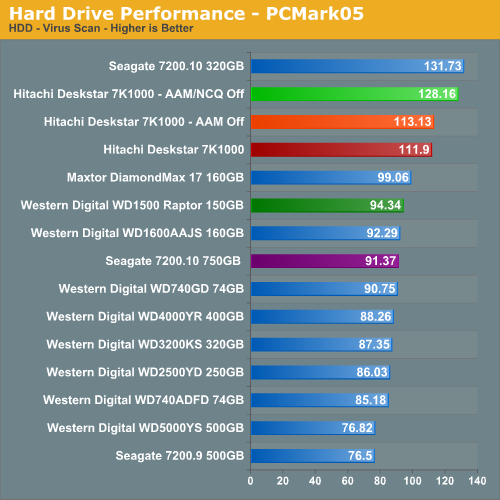
Our PCMark05 numbers surprised us with the 7K1000 scoring better than our previous champion, the WD 150GB Raptor. The performance delta between the 7K1000 and WD1500AHFD is minimal with the major differences occurring in the General Usage and Application sections of the test where combined write and read speeds favor the Raptor's rotational/access speeds while the 7K1000 scores extremely well in the Virus Scan tests especially when both AAM and NCQ are turned off.
We are providing test results with the 7K1000 in this series of benchmarks with AAM/NCQ on, AAM/NCQ off, and NCQ on only. The overall score goes to the NCQ only configuration but the AAM/NCQ on configuration only finishes 7 points behind. It was a toss up between the two configurations with the tests where read operations were prevalent benefiting the NCQ only setup. This is to be expected as random access times are about 30% slower with AAM on but it does not correlate to a noticeable difference in performance. This is one drive where you can have it quiet and fast at the same time. Our recommendation is to leave AAM and NCQ on unless you spend your day benchmarking virus scan programs.
iPeak Business Application Tests
Our iPeak Winstone benchmarks offer a glimpse into how well our hard disk drives will handle general office applications, media encoding, and graphics manipulation. While the business applications that are being tested tend to be more CPU bound at times, the performance of the hard drive can and will make a difference in the more disk intensive video and graphics applications where large media files are typically being edited.
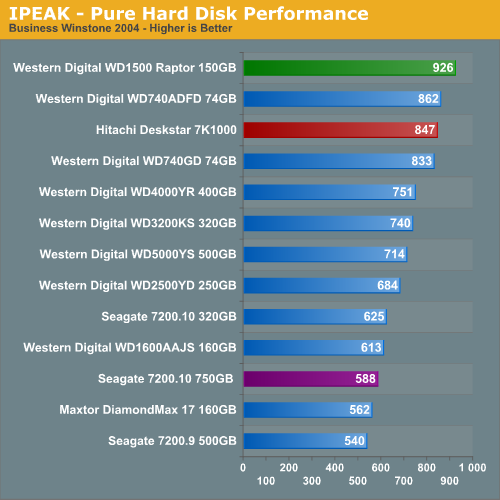
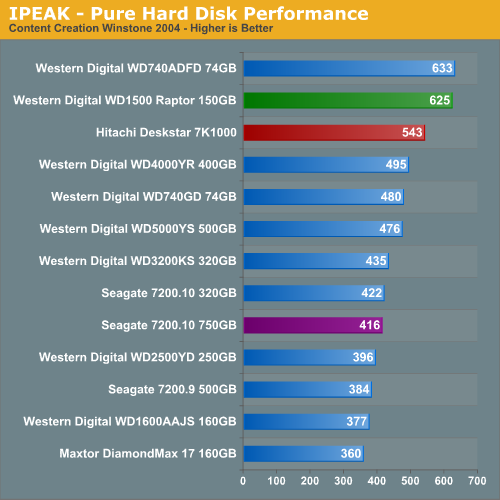
AAs expected the WD Raptor drives finish at the top in our business application tests as their 10k rpm spindle speed and optimized cache play an important role in their ability to sustain high transfer rates, especially in the Content Creation benchmark where transfer block sizes are significantly larger and more random than in the Business application benchmark. We see our 7K1000 performing very well in these tests and finishing ahead of the other 7200rpm drives and even the older 8 MB cache equipped 74GB Raptor.
In fact, the 7K1000 is about 44% faster in the Business Winstone and 30% quicker in the Content Creation benchmarks than the Seagate 750GB drive. After reviewing the trace analysis files we determined that the 7K1000 handles small block sizes of data in non-sequential order significantly better than the Seagate drive. We did notice the drive slowed down slightly in the Business Winstone when it encountered large block sizes of data in non-sequential order. This surprised us slightly as we expected the increase in drive cache to 32 MB would have buffered this same issue we noticed on the Seagate 750GB drive. Overall, the drive offers a very balanced blend of performance across a wide variety of business and home applications.
iPeak General Task Tests
The iPeak based General Task benchmarks are designed to replicate utility based application tasks that typically are disk intensive and represent common programs utilized on the majority of personal computers. While the WinRAR program is very CPU intensive it will typically stress the storage system in short bursts. Our antivirus benchmark will stress the storage system with continual reads and sporadic write requests while the defragmentation process is split between continual read and write requests.
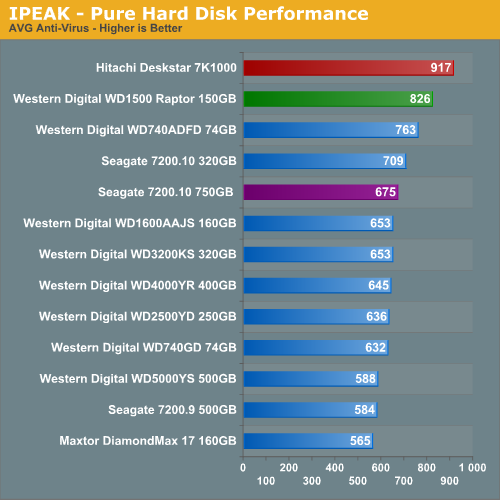
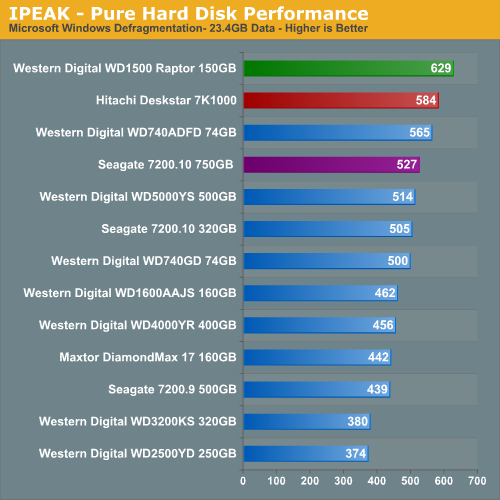
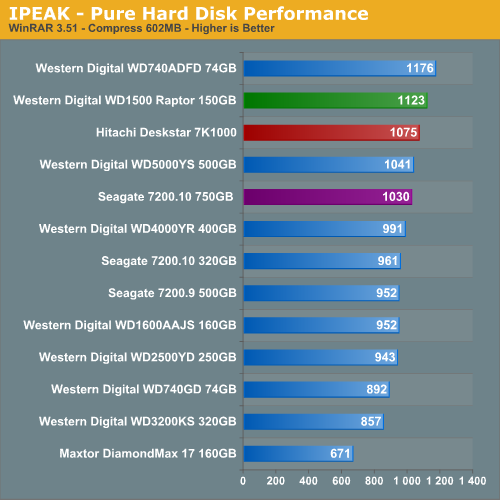
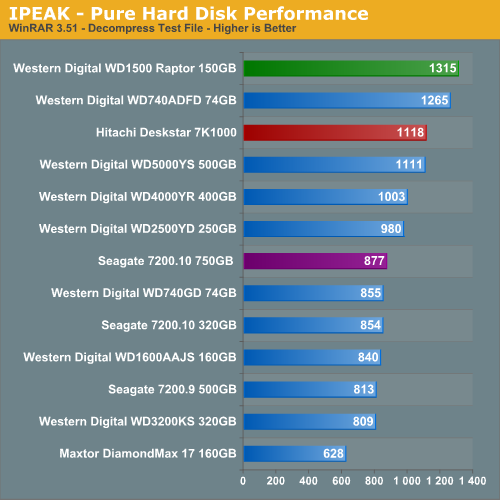
The 7K1000 performs extremely well in the Anti-Virus and Defragmentation test where its 32 MB cache benefits read operations with results that mirror the PCMark 2005 tests. This is especially true in the WinRAR tests where large cache sizes are very advantageous for improved times and we expected better performance from this drive. It did finish ahead of the other 7200rpm drives but simply could not keep up with the rotational and access speeds of the 16 MB cache equipped Raptors.
iPeak Video/Audio Tests
The iPeak based Video/Audio benchmarks are designed around simulating media encoding and HTPC activities. These are basic benchmarks at this time as this section will be expanded once we start testing under Vista. Our change to a dual core processor will assist us in maintaining a balance between the CPU and Storage systems during the trace file creation and benchmarking processes. These benchmarks are CPU intensive in nature but also require a balanced storage system with the ability to handle read and write requests simultaneously in a very efficient manner.
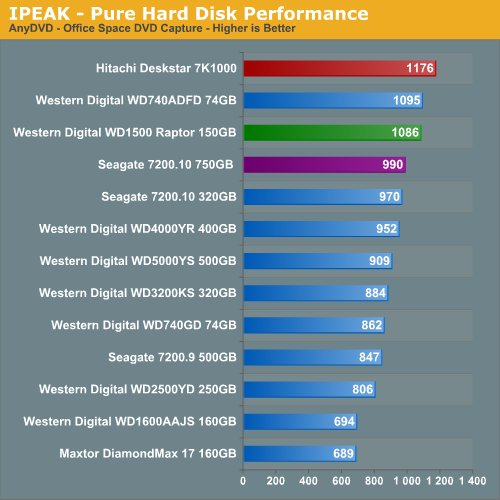
The AnyDVD benchmark is heavily weighted to write requests with the results showing a common pattern with the two 16MB cache Raptors finishing second and third with the 7K1000 once again showing its strength in the write intensive benchmarks due to its areal density and large cache design. We found the Seagate 750GB was pausing during streamed writes due to the smaller cache size after witnessing buffer overruns in the trace file when compared to the Hitachi drive.
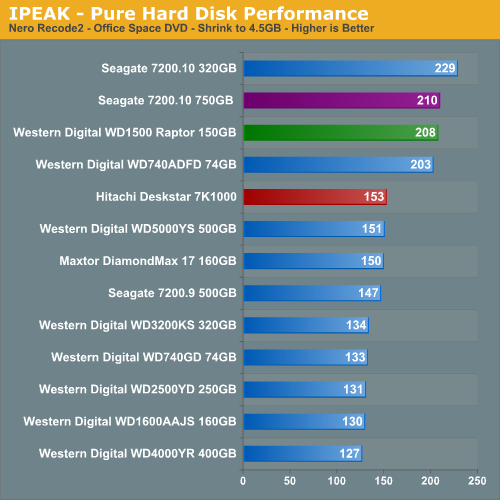
The NeroRecode 2 benchmark is weighted to streaming read requests but is balanced by continuous write operations near the end of the test. This benchmark is one of the most demanding ones in our test suite with the disk being active the entire trace file with several 100% utilization peaks. The results surprised us as we expected the Hitachi with its 32 MB cache and high sustained transfer rates to handle this benchmark with aplomb.
However, it turns out after reviewing the trace file results it was obvious that the 7K1000 was hampered by its inability to process large data blocks in sequential order efficiently as it had a number of buffer overruns during the read portion of the tests. This indicates to us the drive firmware is probably tuned more for non-sequential read/writes as the rest of our tests indicate. However, the 32 MB cache should have easily compensated for any potential large block issues in this test and the drive handled previous read heavy request tests with ease. Our initial test results with AAM off only show a two point advantage in this test. We are currently completing tests with AAM/NCQ off and will update the article if there are any noticeable performance differences.
iPeak Game Installation Tests
Our iPeak based Game Installation benchmarks simply show the ability of the hard drive to write data as quickly as possible to the disc based upon the installation software instructions. As detailed in our iPeak setup description we installed the games from our source drive in order to eliminate the optical drive bottleneck. In separate application timing we witnessed basically the same percentage spread when installing the games via our DVD drive so these results are representative of actual installation performance.
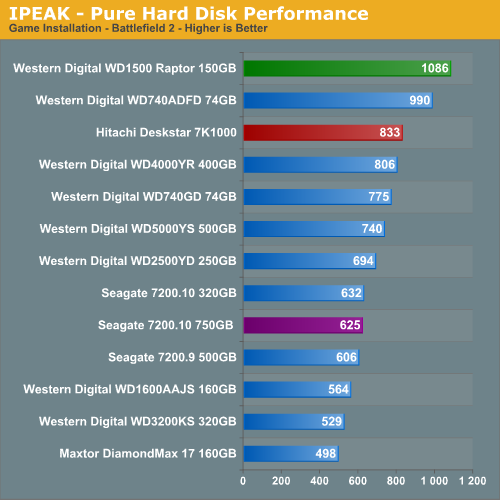
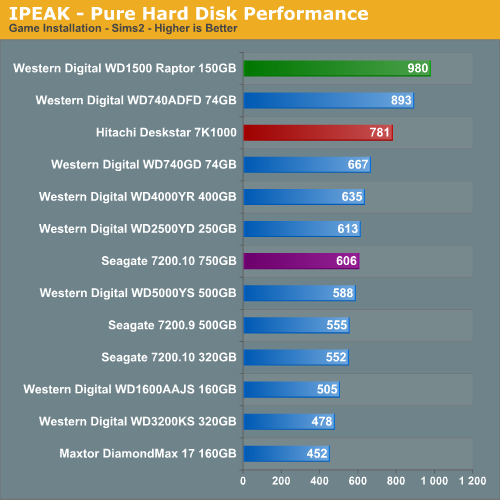
The Raptors once again finish at or near the top in our gaming tests due to their rotational and random access speeds. Our 7K1000 drive finishes ahead of the 7200rpm drives with a great deal of benefit going to the 32 MB cache and high sustained transfer rates. A review of the trace files did not indicate any real standout issues with the Seagate 750GB drive although we noticed several minor dips in performance when the drive was reading information off the source drive. The write performance was generally slower than the 7K1000 in this test and follow previous benchmark results.
We need to remember these tests reflect pure hard drive performance and will be mitigated by the overall system platform as we will see in our application tests. These tests are basically designed around continual read/write requests that favor large cache sizes, properly tuned firmware, and high sustained transfer rates.
iPeak Game Play Tests
The iPeak based Game Play tests are centered on the benefits of having a hard disk that can load non-linear or sequential data files quickly without interrupting the flow of the game.
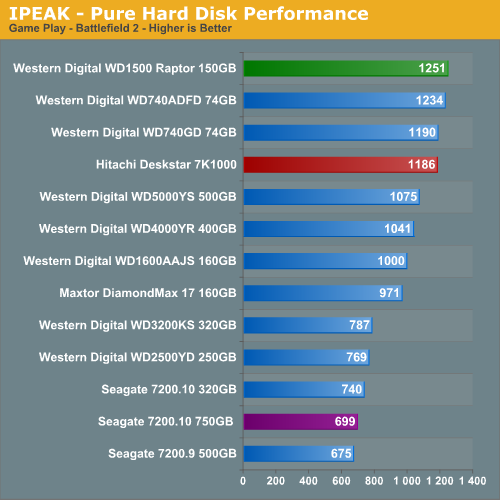
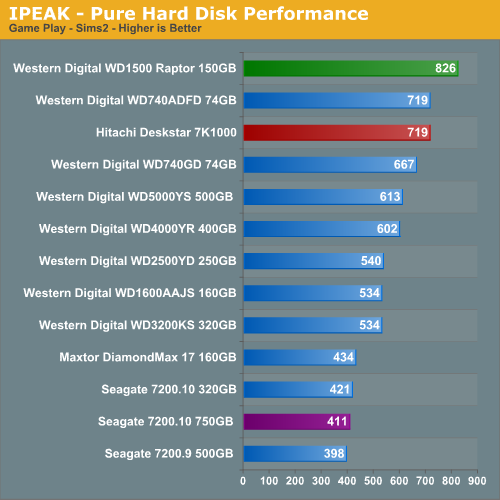
When it comes to gaming the Raptors rule but the 7K1000 is not that far behind with a second place tie in the disk intensive Sims2 and a strong fourth place finish in Battlefield 2. Although we are looking at pure performance results, in subjective testing we finally have a 7200rpm drive that "feels" as fast as the Raptor family of drives when loading or playing a game. The best overall gaming performance in a drive with a SATA interface is still the Raptors but considering the storage size, acoustic, and cost per-Gigabyte advantages of the Hitachi drive we are heavily leaning towards changing our recommendation.
Actual Application Performance
Our application benchmarks are designed to show application performance results with times being reported in minutes / seconds or seconds only, with lower scores being better. Our graph engine does not allow for a time format such a 1:05 (one minute, five seconds) so this time value will be represented as 1.05. While these tests will show some differences between the drives it is important to understand we are no longer measuring the pure performance of the hard drive but how well our platform performs with each individual drive. The performance of a hard drive is an integral part of the computer platform but other factors such as memory, CPU, core logic, and even driver choice can play a major role in determining how well the hard drive performs in any given task. Also worth noting is that new features of Windows Vista - specifically SuperFetch - can further reduce the measured performance differences between hard drives.
Game Load Test
Our Sims 2 - Open for Business test measures the time it takes to load the initial portion of the game. Our application timer starts when the game icon is initiated until the neighborhood menu appears.
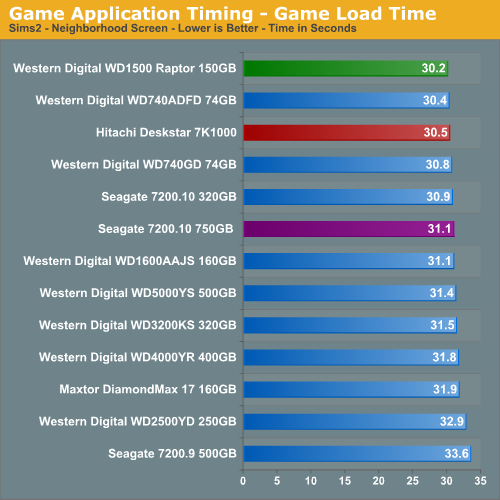
The results are basically the same as our IPEAK results as the WD Raptor series continues to lead all drives although the performance differences are not as drastic once we take into account the entire platform. We notice the Hitachi drive scoring better than the other 7200rpm drives and the drive seemed just as fast as the Raptors over the course of game play, something we generally did not find with our other top performing 7200rpm drives.
Game Level Load
This test centers on the actual loading of a playable level within our game selections. We run Battlefield 2 and measure the time it takes to load the Daqing Oilfields level. Our application timer begins when the start single player icon is initiated and ends when the join game icon is visible.
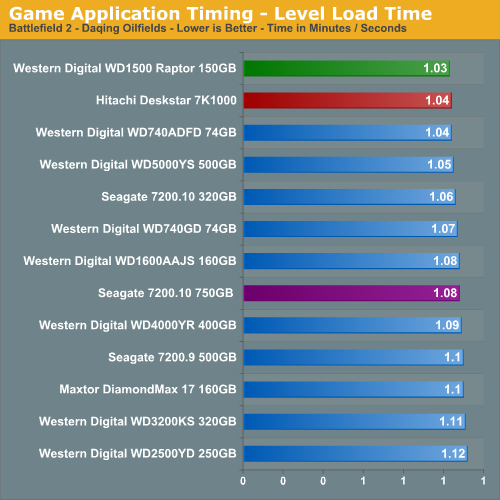
The WD1500ADFD Raptor continues its pattern of being the best available drive for the gaming enthusiast and our subjective opinion also matches the test scores although we are openly debating this statement now. Of course it is easy to debate our continued love affair with the Raptor as the difference in load times between the WD1500 and the 7K1000 drive was only one second so it appears we are getting close to finally having a Raptor killer in the large capacity 7200rpm drives. We firmly believe the areal density and 32 MB cache advantages of the Hitachi 7K1000 make up for the rotational and random access advantages of the Raptor in our gaming tests.
AnyDVD 5.9.6
Our next test has us utilizing the "ripping" function of AnyDVD to copy the Office Space DVD file from our source drive to our test drive. Our DVD features 29 files totaling 7.55GB of data and is an excellent test for determining the write speed of a drive.
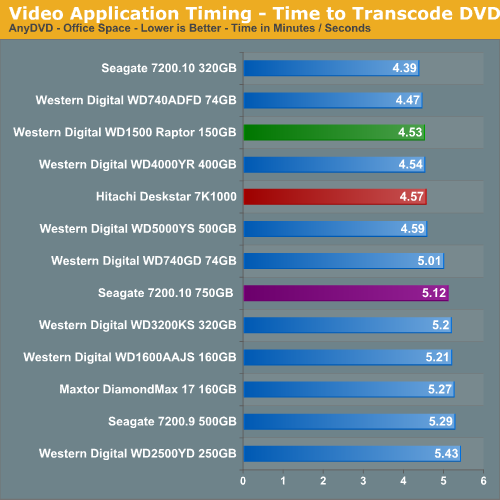
Our Seagate Barracuda 7200.10 320GB drive scores extremely well in this test due to exceptional read times with large data blocks in sequential order, something its larger sibling does not handle well. This is one of the few tests where our 7K1000 does not finish ahead of the other 7200rpm drives but it does improve upon its performance when compared to the IPEAK results. The 7K1000 still manages a top five finish while finishing 15 seconds ahead of the Seagate 750GB drive.
Nero Audio Encode
Our last test has us utilizing the audio encoding functions of Nero to convert our INXS Greatest Hits audio files in MP4 format to a high quality variable rate MP3 file for our portable player. Our test features 16 files totaling 137MB of data and is an excellent test for determining the read and write speed of a drive.
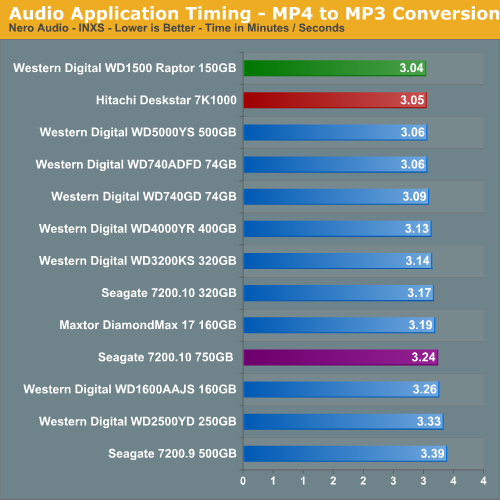
The test results show once again the amount of time a fast hard drive like the WD Raptor can save over the course of audio or video file manipulation session. In this case, the WD1500ADFD finishes just ahead of the 7K1000 where it handles small block sizes in sequential order slightly better due to is rotational speed advantage.
Quick Take
Our limited experiences to date with the Hitachi Deskstar 7K1000 have been terrific and beyond expectations. The overall performance of this drive has been phenomenal and is close enough to the WD1500ADFD Raptor drive that we consider it a worthy adversary. The Raptors are still the drives to own for benchmarking but this drive is a better overall performance value. In fact, based upon subjective testing we could seriously consider tossing this drive into the same performance sector as the WD Raptor when utilized in the typical gaming or enthusiast level machine where this drive will likely find a home.
We found the overall write performance and sustained transfer rates to be excellent and class leading in several of our test results to date. The drive even has the best overall thermal and acoustic characteristics of the high performance 7200rpm drives and absolutely blows away the Raptors in this respect. Of course, the 7K1000 does not have to contend with 10,000 rpm spindle speeds and firmware that is generally designed to extract the greatest amount of performance from the drive. However, considering the drive has a five platter design we think Hitachi has done a wonderful job in controlling thermals.
Hitachi's implementation of their Automatic Acoustic Management technology on the 7K1000 does not hinder performance in a noticeable manner and offers a significant advantage for those needing a spacious drive in a silent system. We cannot wait to test the CinemaStar version of this drive that will be designed with DVR operations in mind but for now our HTPC test bed has found a new drive. As stated in the article, we believe leaving AAM and NCQ turned on provides the best performance experience with this drive. While there may be a very slight performance advantage in certain benchmarks with AAM off (NCQ also), we feel like the benefits of having a near silent 1TB drive in our system is well worth the price of losing a few benchmark points.
The Deskstar 7K1000 is not without faults. We did find in our Nero Recode tests and to some degree in our Winstone tests that the drive does not perform as well as expected in handling large block sizes of data in sequential order. The Achilles heel of the Seagate 750GB drive was its inability to handle large files in non-sequential order. Hitachi has overcome this for this most part with a large 32 MB cache and from all apparent indications firmware that is tuned with operational balance in mind or even favoring non-sequential read/writes. A luxury it can afford due to its cache size and areal density advantages over the other drives in our test group.
Overall, we think Hitachi's Deskstar 7K1000 is the best 7200rpm drive we have tested to date. This is quite the accomplishment considering this is Hitachi's first 3.5-inch form factor drive that utilizes perpendicular recording technology. We still have significant testing left to complete on this drive that includes our full IPEAK and Application test suite with AAM and NCQ turned off or on along with RAID testing but we do not expect to find any surprises at this time. With an expected retail price of $399 or $0.40 per-Gigabyte this makes the 7K1000 a true value considering its size and performance. For these reasons, we highly recommend the purchase of this drive if you are currently looking for a high-capacity drive with performance to match.
We would like to thank Dell once again for providing our test samples and encourage you to visit StudioDell or take a look at the systems currently shipping with this impressive drive.


