Original Link: https://www.anandtech.com/show/2043
Intel Woodcrest: the Birth of a New King
by Jason Clark & Ross Whitehead on July 13, 2006 12:05 AM EST- Posted in
- IT Computing
Visit with Intel
For the past two years Intel has been holding workshops in Oregon, where they invite a few of the hardware sites to view their upcoming technology. In May of this year, AnandTech made their way up to Oregon to have a look at Woodcrest. While we were there we were presented with the normal marketing hoorah, what product launch is without that? But we also had some quite interesting presentations like Virtualization, and where Intel sees that market going (it's going sky-high for those that haven't been keeping up with it).
While in Oregon, we also took a look at a running Clovertown machine. Clovertown is the code name for Intel's quad-core chip, which is coming out in early 2007. It will be a drop-in part to most Woodcrest systems, running at 1066MHz FSB. How's that for upgradeability: 4-way to 8-way in under 20 minutes (your mileage may vary).
The Birth of a New King
Out with the old, and in with the new (or so they say). In April of 2003, AMD launched their Opteron enterprise microprocessor. Since then, Opteron has been steadily chewing into Intel's server market share. To think that Intel was not going to re-tool would have been naïve, although it did take Intel a long time. Not only did they produce what we think is the best two socket server processor on the market today, but they have quad-core up their sleeve and it will most likely release before AMD has an answer to Woodcrest. We already took a look at Woodcrest running on Linux, and we're ready to follow up with some analysis of Windows Server performance.
Woodcrest will share the Bensley platform with Dempsey, although we suspect Dempsey will fade away once Woodcrest parts are shipping in volume. Dempsey may have competed in terms of performance, but power consumption was not even in the same ball-park thanks to Woodcrest's new Core micro-architecture. The new processor features a 4MB L2 cache shared between each of its two cores and a 1333MHz Dual-Independent Bus architecture. Clock speeds for the Woodcrest launch will start at 1.6GHz and top out at 3.0GHz, and power consumption for the parts will range from 65W to 85W for the top bin part (3.0Ghz). The lower clocked 1.6GHz & 1.86GHz parts will run at 1066MHz FSB while the 2.0-3.0GHz parts will run at 1333MHz FSB. Intel also plans to ship a 40W version of the chip later this year that will run at 2.33GHz.
Architecture Summary
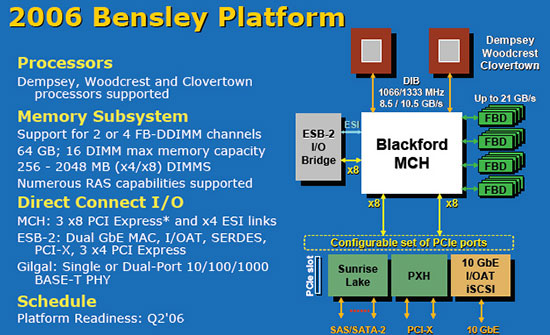
Woodcrest's home is a newer revision of the Bensley platform than what Dempsey launched with, which means that it's a drop-in part for newer Bensley based systems. If all goes to plan Clovertown (Quad-Core Xeon) should be a drop-in upgrade as well (depending on the system vendor). As we discussed in our Dempsey article, the Bensley platform features FB-DIMM with a peak bandwidth of 21GB/sec, SAS/SATA support and 1066/1333MHz FSB.
Woodcrest Highlights:
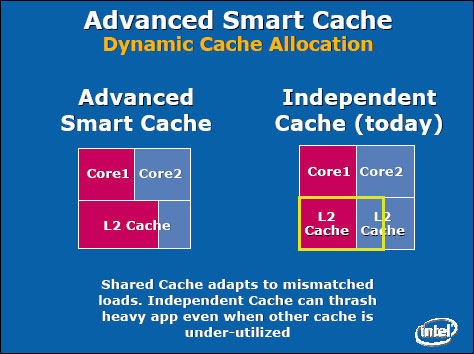
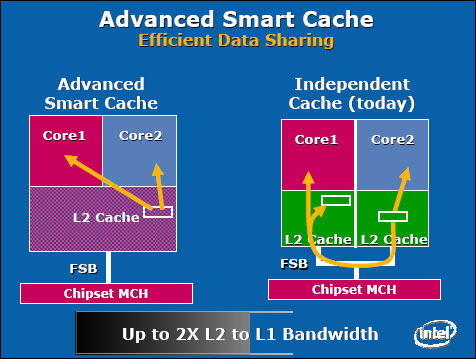
Shared 4MB L2 "Smart Cache"
Dempsey based processors had a separate 2MB L2 cache for each core, but Woodcrest has 4MB of L2 Cache shared between both cores. Due to the fact that the cores share a single cache, there is no data replication like there is with separate L2 caches; this results in more efficient data-sharing between cores. The shared cache also helps with mismatched loads: when one core is consistently using more cache than the other core, the CPU can allocate more L2 cache to that core. Both of these techniques are illustrated below.
Wide Dynamic Execution Enhancements
With the Intel Core micro-architecture, every execution core is 33% wider than previous generations, allowing each core to fetch, dispatch, execute and retire up to four full instructions simultaneously. The Opteron - as well as all previous NetBurst Xeon processors - can only handle 3 at a time.
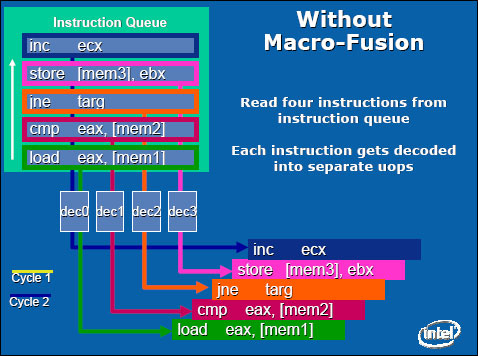
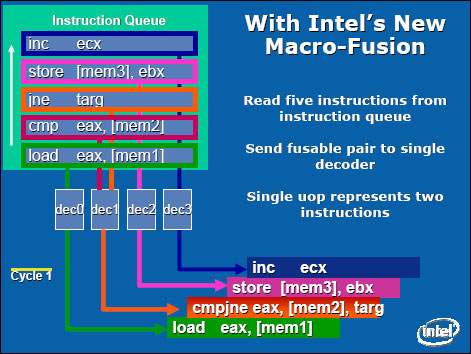
Macro Fusion
Macro-fusion combines certain common x86 instructions into a single instruction for execution. Without Macro-fusion four instructions at a time are fetched from the queue and each instruction gets decoded into separate micro-ops. With Macro Fusion, 5 instructions can be fetched at a time, and if a fusable pair is present it can be sent to a single decoder. A single micro-op can then represent two regular x86 instructions.
Beyond 2 Sockets, is Intel's FSB still an Achilles Heel?
As we've seen in past benchmarks, the front side bus has been a thorn in Intel's side, especially in the quad socket systems. Whether or not the new architectural changes that Intel has made with Woodcrest will alleviate enough of that pressure to overpower the scalability of Opteron in four socket configurations is unknown at this point. Intel is quite confident that with the shared cache and its dual independent FSB running at 1333MHz that bus bandwidth is not a concern, however at some point the bus bottleneck will be a problem. One of Intel's architects has however stated that an integrated memory controller is possible, which Intel has already shown us a demo of.
The New Benchmark Suite
We've made some changes to our benchmarks to accommodate the required multiple load scenarios we used in this article. The first benchmark we overhauled was the Dell DVD Store test (http://linux.dell.com/dvdstore/). In the last article (the first time we used Dell DVD Store), we used the stock Dell SQL driver along with a medium sized database (which is approximate 3GB). This time around we wanted to use a larger database to show a more enterprise based e-commerce scenario. To get a larger database we took the medium database and upped the customers to 20 million from 2 million and upped the products from a hundred thousand to 1 million. This resulted in a 14GB database.
We modified the driver code as well. We started off by taking the included C# driver source code and changing the way it created the threads (users). Basically, in stock form the driver creates all the threads and users in one shot and then starts executing orders. Since we wanted to be able to dynamically add threads to achieve certain load levels, we added a method to the class to add users. At the same time we also added a few properties so that we could use a Windows Form application to house the class and report back various performance counters. This allows us to graph CPU usage and orders per minute over the duration of the test, and we can save the graphs for historical reporting. The Forum benchmark also got an overhaul using the same GUI driver, and a few changes to the way the queries were executed against the database.
Both of the benchmark applications record their results back to a database server, where we average the results over the N number of runs for our graphs. We also allow the GUI to take command line parameters, which allows us to set up batch files to run an entire platform. On average it takes almost 20 hours to run a platform (due to the fact we run 5 iterations of each load point). It is important to look at the deviations between benchmark runs to ensure scores are consistent and representative of typical performance. The deviations are all relatively low which is very good, with the average deviation being 1.6%.
Dell & Forum SQL Trace Analysis
The Dell and Forum benchmarks are quite different workloads, which you will see in the benchmark results. Dell executes approximately 10 times more queries during the test, and the durations are approximately 4 times less than that of the Forum benchmark durations. To summarize, Dell is a workload with a high transaction volume, and each query executes in a very short amount of time. The Forum workload has a medium transaction volume, and the queries execute in a reasonable amount of time but are much more read intensive (larger datasets are returned).
Test Configuration
Below are the configurations of the test machines. We should note that the Opteron system memory was set to 1T and NUMA was enabled.
Client
Dual AMD Opteron 256
4GB Memory
Gigabit Ethernet
Windows 2003 x64 Server
Woodcrest/Dempsey System
Intel OEM System (Pre-Production)
8GB 533MHz FB-DIMM
Windows 2003 x64 Enterprise Server SP1
SQL 2005 Enterprise SP1 x64
14 x Ultra 320 SCSI Drives in RAID 0
LSI Logic 320-2 Controller
Opteron 280/285 System
Tyan S2891 Motherboard
8GB PC3200 DDR 400MHz
Windows 2003 x64 Enterprise Server SP1
SQL 2005 Enterprise SP1 x64
14 x Ultra 320 SCSI Drives in RAID 0
LSI Logic 320-2 Controller
Multiple Load Points
For AnandTech Database Benchmarks, we have always focused on "real world" Benchmarks. To achieve this, we have used real applications with loads such that CPU utilization was 80-90%. Recently we discussed how most Enterprise Database Servers do not average 80-90% CPU utilization, but rather something closer to the 30-60% range. We thought it would make more sense to show performance where it is most likely going to be used, as well as the saturation numbers for the situations where the CPU is maxed. We feel this is consistent with how GPUs are reviewed, and how you might test drive a car. With GPUs, the cards are tested with varying resolutions, and anti-aliasing levels. With a car, you don't just hit the highway and see what the top end is.
We settled on six load points for testing. These load points are consistent across all platforms and are throttled from the client, independent of the platform being measured. We chose these load points as they split the load range into 6 roughly equal parts and allow us to extrapolate data between the points. The last/highest load point is a "saturation plus" load point to verify that we tested up the capability of the CPUs.
For any given load point, there is a defined number of threads. Each test is 20 minutes in duration, which includes an 8 minute warm up period followed by a 12 minute measured period. For a given load point, the client submits requests to the DB server as fast as the DB server will respond. The rate which the client is able to submit requests is measured during the final 12 minutes of the test and averaged to determine the Orders/Minute for Dell and Transactions/Minute for Forums. After much blood, sweat, and almost tears we were able to produce repeatable loads with an average deviation of 1.6%.
For each platform we ran the test 5 times for each load point and then averaged the 5 results. This was repeated for all loads, all tests, on all platforms... that is 300 test executions!!! (We won't even get into the debugging issues we had to deal with prior to the final results.) Thankfully, we managed to automate the process as much as possible when implementing the throttling mechanism for the load points.
Dell Test results
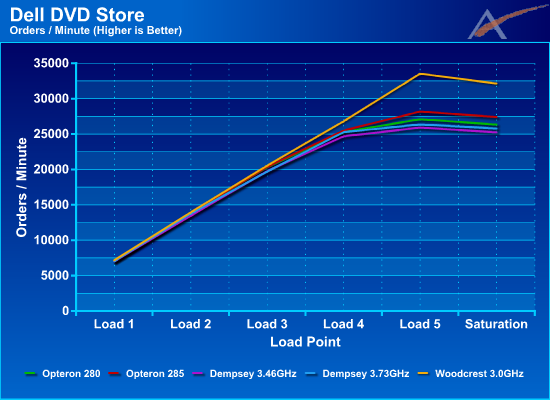
At the first three load points all platforms are within 4% of each other. At the fourth load point the spread opens up and Woodcrest leads the Opteron 285 by 5% and Dempsey 3.73 by 6%. Finally, at the fifth load point, Woodcrest is able to lead the Opteron 285 by 19% and Dempsey 3.73 by 27%. It is interesting to note in this graph, and other upcoming performance graphs, that Woodcrest scales linearly to the fifth load point but the others stop scaling linearly between the third and fourth load points.
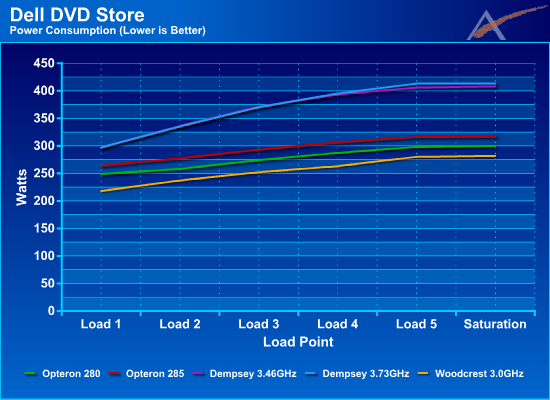
Woodcrest is clearly the lowest consumer of power and leads the Opteron 285 by 11%-17%, and Dempsey 3.73 by 27%-33%. FB-DIMMs do consume more power than regular DDR2 memory, which partially offsets some of the advantage of the Core architecture.
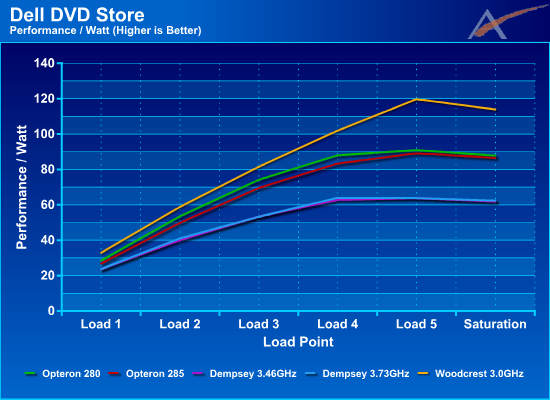
When we combine performance and power and come up with Performance/Watt we get a very different picture. In this graph we see that Woodcrest is the clear leader at all load points and leads the Opteron 285 by 17% - 34%, and Dempsey 3.73 by 39%-88%. It is also interesting to note that the Opteron 280 outperforms the Opteron 285 on a Performance/Watt measure while Dempsey performance scales almost linearly with power. This often is an indication that the architecture is reaching its clockspeed limits, which is certainly the case as the only faster dual core K8-based chip presently available is the FX-62.
Forum Test results
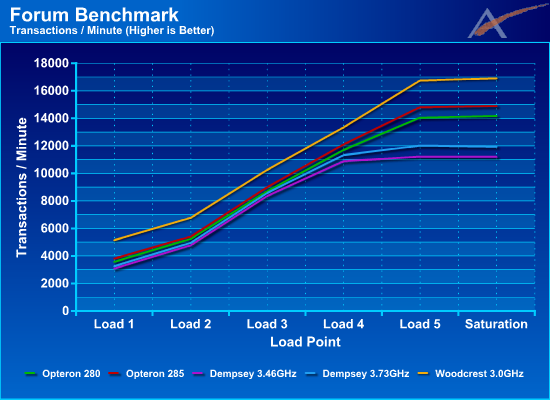
Unlike the Dell DVD Store test, Woodcrest demonstrates a commanding lead at all load points. Woodcrest is able to lead the Opteron 285 by 10%-35% and Dempsey 3.73 by 18%-58%. The Forums test was harder to throttle at the lowest load point, thus the first load point results do not fit entirely into the expected linear model. In future reviews we may try and address this.
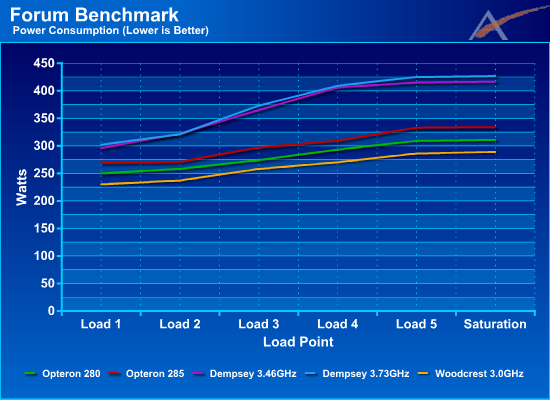
This graph is similar to the Dell Power results. Woodcrest is again the lowest consumer of power. Woodcrest leads the Opteron 285 by 13%-14%, and Dempsey 3.73 by 24%-34%.
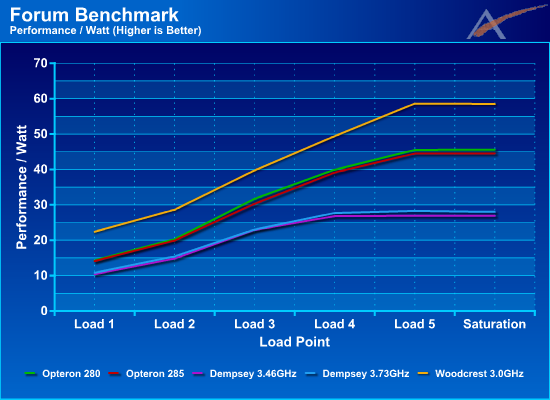
Lower power and higher performance of course makes Woodcrest the clear leader at all load points in terms of Performance/Watt. It leads the Opteron 285 by 26%-58% and Dempsey 3.73 by 73%-108%. Again note that the Opteron 280 outperforms the Opteron 285 in terms of Performance/Watt.
Conclusion
It took a few years, which is normal for any architecture redesign, but we feel Intel has finally created a product that is not just competitive to the AMD Opteron. Woodcrest outperforms all of the competition in 2-way configurations, and it does so with lower power consumption. This combination leads to better Performance/Watt in all tested situations. Woodcrest not only outperforms it's predecessor by over 100% in Performance/Watt, but it outperforms Opteron by as much as 60% in Performance/Watt. In terms of straight performance the Woodcrest led the way by anywhere from 18 to 35% at higher system loads. We feel that Intel has the vision to continue this trend, as they have a clear roadmap for next year and beyond. Expect to see even further gains in 2007. How those parts will compete with future AMD products is unknown, but we have competition and that is always good for the consumer.


