Original Link: https://www.anandtech.com/show/1720
SATA II to the Power of 3.0Gb/sec: Three Drives Reviewed
by Purav Sanghani on June 25, 2005 7:06 PM EST- Posted in
- Storage
Introduction
Our overview of the SATA II specification a few days ago provided our readers with some insight on what SATA II was really about. In short, SATA II provides updates to the SATA 1.0 specifications including new features and a possible increase in transfer rates from 1.5Gb/sec to 3.0Gb/sec if drive manufacturers decide to implement these features in their products. The new transfer rates depend on what combination of hardware is used to build a drive such as the port multiplier, port selector, cables, and connectors used in a storage system.
The first drives capable of 3.0Gb/sec transfer rates came to our attention a while back but we wanted to see a few other manufacturers show us their offerings before we dug deeper into the supposed higher speed drives. Hitachi was the first to market the SATA II 3.0Gb/sec drive with Samsung and Western Digital following. Samsung was nice enough to send us a test sample to work with and we picked up a Hitachi and Western Digital model in time.
All drives are, of course, SATA II units capable of 3.0Gb/s. The Samsung and Hitachi drives feature Native Command Queuing while Western Digital has decided to leave the feature out. The SATA II standard does not require any of these features but it is always nice to have them in any newly released drive. Our look at Seagate's Barracudas proved that NCQ has no great effect on regular day-to-day tasks so we are not expecting much from the feature this time around. Let's take a look at our testing methods...
Note: To enable 3.0Gb/sec and/or spread spectrum clocking it is required that we download the Feature Tool from Hitachi GST's website. The Feature Tool is a boot time utility and comes in CD ISO and floppy image format.
The Test
Our test bed specs have been laid out below. Since our test bed has remained untouched from our look at Seagate's 400GB Barracuda article we will include our results of the drives we looked at from that article.
Our test bed:
AMD Athlon64 3500+ (2.2Ghz)
Giga-byte GA-K8NXP-SLI
Nvidia 6600GT SLI Edition (single 128MB card)
1GB (512MBx2) Corsair XMS4400
Our motherboard is an nForce4 based board which features support for the SATA II standard, up to 3Gbps/sec SATA transfer rates, and NCQ and TCQ.
We used the following nForce platform drivers in conjunction with our testbed:
nForce4 Chipset Driver 6.39
Nvidia Forceware 71.89
Windows XP SP2 w/out further updates
Business Winstone IPEAK - a playback test of all of the IO operations that occur within Business Winstone 2004.
Content Creation IPEAK - a playback test of all of the IO operations that occur within Multimedia Content Creation Winstone 2004.
SYSMark 2004 - the official SYSMark 2004 test suite.
Business Winstone 2004 - the official Business Winstone 2004 test suite.
Multimedia Content Creation Winstone 2004 - the official Multimedia Content Creation Winstone 2004 test suite.
Half-Life 2 Level Load Test - a timed test of loading a level in Half-Life 2.
Doom 3 Level Load Test - a timed test of loading a level in Doom 3.
Command & Conquer: Generals Level Load Test - a timed test of loading a level in Command & Conquer: Generals.
Real World File System Task Tests - timed tests of basic file system tasks including zipping/unzipping and copying files
Service Time and Transfer Rate Tests - Synthetic tests for average service time and transfer rate of hard disk at the beginning and the end of a full disk read. We have included the WinBench test, but since it is synthetic, we have not put much emphasis on it.
Business Winstone 2004 Multitasking Test - Synthetic tests for overall system multitasking performance
Real World Multitasking Test - timed tests of basic multitasking processes, timing a file zip operation while importing Outlook data
More details about each individual test will appear in the section of the review dedicated to that particular test.
The Competition
Max Capacity |
Platter Density |
# of Platters/Heads |
Spindle speed (RPM) |
Average Seek Time |
Average
Latency |
Interface |
Buffer Size |
|
| Samsung HD160JJ | 160GB |
80GB |
2/4 |
7200 |
8.9ms |
4.17ms |
SATA II |
8MB |
| Western Digital WD1600JS | 160GB |
80GB |
2/4 |
7200 |
8.9ms |
4.20ms |
SATA II |
8MB |
| Hitachi T7K250 | 160GB |
125GB |
2/3 |
7200 |
8.5ms |
4.17ms |
SATA II |
8MB |
Pure Hard Disk Performance - IPEAK
We begin our usual hard disk drive test session with Intel's IPEAK benchmarking utility. We first run a trace capture on Winstone 2004's Business and Multimedia Content Creation benchmark runs to catch all of the IO operations that take place during each test. We then play each capture back using RankDisk which reports back to us a mean service time, or average time the drive takes to complete an IO operation.
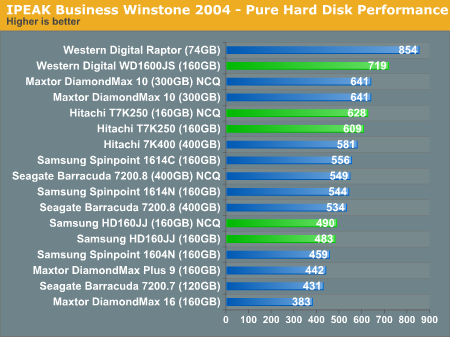
Our first benchmark shows Western Digital's WD1600JS coming in at second best in pure hard disk performance at 719 IO operations per second while the 74GB 10,000RPM Raptor still tops the charts. Hitachi's T7K250 spits out 609 IO operations per second with a 20 IO increase with NCQ turned on. Samsung's HD160JJ, on the other hand, does not do so well coming in 5th and 6th to last at 483 operations per second and 490 operations per second with NCQ on.
Let's take a look at Content Creation performance.
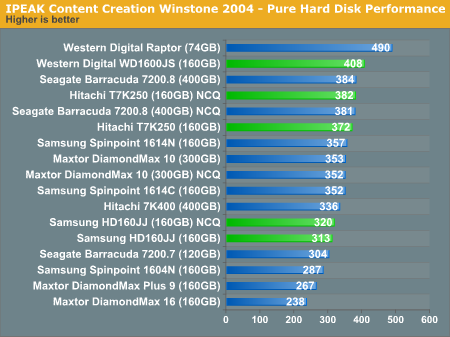
Each of the 3 competitors performs about the same in the Content Creation portion of IPEAK compared to the rest of the list.
Not surprisingly, Hitachi and Western Digital come close to topping the charts at 12.76ms and 13.24ms respectively while the HD160JJ comes close to last place at 15.516ms average read service time.
Overall System Performance - Winstone 2004
Business Winstone 2004
Business Winstone 2004 tests the following applications in various usage scenarios:- Microsoft Access 2002
- Microsoft Excel 2002
- Microsoft FrontPage 2002
- Microsoft Outlook 2002
- Microsoft PowerPoint 2002
- Microsoft Project 2002
- Microsoft Word 2002
- Norton AntiVirus Professional Edition 2003
- WinZip 8.1
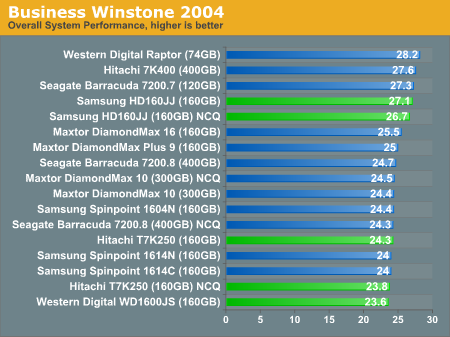
The actual Business Winstone 2004 benchmark gives Samsung the credit by giving the HD160JJ 26.7 and 27.1 points with and without NCQ enabled, respectively. Western Digital comes in at last here and it seems that NCQ has no effect on business application performance.
MCC Winstone 2004
Multimedia Content Creation Winstone 2004 tests the following applications in various usage scenarios:- Adobe® Photoshop® 7.0.1
- Adobe® Premiere® 6.50
- Macromedia® Director MX 9.0
- Macromedia® Dreamweaver MX 6.1
- Microsoft® Windows MediaTM Encoder 9 Version 9.00.00.2980
- NewTek's LightWave® 3D 7.5b
- SteinbergTM WaveLabTM 4.0f
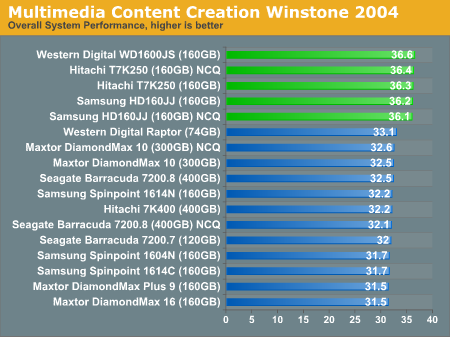
Here we go! It looks as though SATA300 performance kicks in during the Content Creation benchmarks. All of our test drives shot to the top of the list between 36.1-36.6 points with Western Digital's WD1600JS coming in at first. NCQ still had no visible effect on Hitachi's and Samsungs drives.
Overall System Performance - SYSMark 2004
SYSMark 2004 is divided into two separate suites: Internet Content Creation and Office Productivity. What makes SYSMark an ideal hard disk benchmark is that its scores are totals of response times, meaning that the benchmark measures how long the system takes to respond to a task (e.g. how long before a search and replace is completed after it is initiated) and sums up all such response times to generate a score. This score is generated for six total subcategories: three under Internet Content Creation and three under Office Productivity.
For the most part, SYSMark is CPU/platform bound, but we will see some variations in performance according to disk speed; at the same time, there are a couple of benchmarks within SYSMark that are heavily disk dependent.
Internet Content Creation Performance
Our results showed very little difference in the performance of the competitors; not enough to rule out margin of error in the Content Creation part of SYSMark 2004. The scores for the majority of drives landed between 180-183 which does not show too well which drive performs better than the rest.
Office Productivity Performance
SYSMark's Office Productivity suite consists of three tests, the first of which is the Communication test. The Communication test consists of the following:
"The user receives an email in Outlook 2002 that contains a collection of documents in a zip file. The user reviews his email and updates his calendar while VirusScan 7.0 scans the system. The corporate web site is viewed in Internet Explorer 6.0. Finally, Internet Explorer is used to look at samples of the web pages and documents created during the scenario."
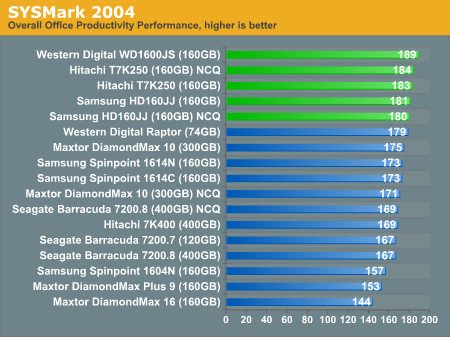
Surprisingly the SATA300 drives showed a good performance increase over the SATA150 drives as our 3 test units topped the charts with Western Digital coming in at first followed by Hitachi and Samsung.
SYSMark 2004 Performance Summary
These scores represent the overall performance of each component of SYSMark 2004.
Like the results of Multimedia Content Creation Winstone 2004, each of the U300 drive's came in at the top of the list, again with Western Digital's WD1600JS at first place. Samsung's HD160JJ comes in at 3rd (NCQ on) and 5th (NCQ off) with scores of 212 and 211 while Hitachi's T7K250 comes in at 2nd (NCQ off) and 4th (NCQ on) again, with scores of 212 and 211 respectively.
To recap , here's what happens in the entire Office Productivity suite:
"In this scenario, the office productivity user creates a marketing presentation and supporting documents for a new product. The user receives email containing a collection of documents in a compressed file. The user reviews his email and updates his calendar while a virus checking software scans the system. The corporate web site is viewed and the user begins creating the collateral documents. The user also accesses a database and runs some queries. A collection of documents are compressed. The queries' results are imported into a spreadsheet and used to generate graphical charts. The user then transcribes a document. Once the document has all the necessary pieces in place, the user changes it into a portable format for easy and secure distribution. The user edits and adds elements to a slide show template. Finally, the user looks at the results of his work (both the slide show and the portable document) in an Internet browser."
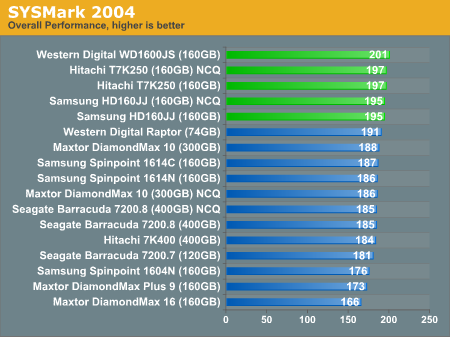
In the end, all three SATA300 drives come out on top of the SATA150 drives with SYSMark 2004 ratings between 195 and 201. The doubled transfer rates really came through in the Content Creation tests..
WinBench 99 - Transfer Rate Test
We ran WinBench 99's Disk Transfer Rate Test to get a better measure of just how well the transfer rates are over the course of the entire disk. The Disk Transfer Rate test reads from the media in a linear fashion from the beginning (1st track) to the end (last track). The numbers below represent the ceiling and floor of the transfer rates throughout the test.
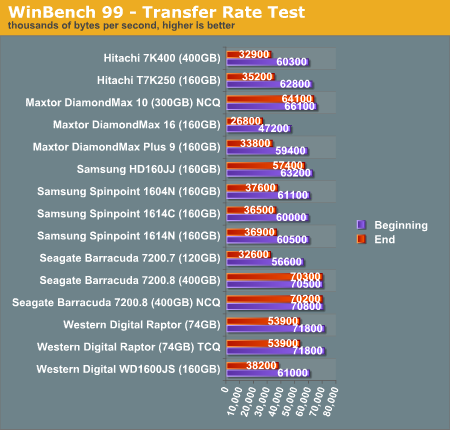
Samsungs HD160JJ holds its own during Winbench 99's Transfer Rate Test. The drive never drops below about 57.4MB/sec while the T7K250 has a 50% drop in transfer rate when it reaches the end of the test. The WD1600JS does a little better than the Hitachi drive but not as well as the HD160JJ's close to constant transfer rates throughout the read. Since the last track is on the inside of the platter, transfer rates are lower because of the proximity of each bit compared to those on the outer tracks. Because this test is synthetic, we have not put much emphasis on the results.
Real World Tests - File System Tasks
Synthetic benchmarks are not always the best gauge in measuring the "real" performance of hardware which is why we have incorporated a few real world tests in our storage reviews. One of our tests, the file system performance test, measures the drive's ability to handle file zip, unzip, and copy operations. This is a great measure of how one drive compares to another and we have put together a group of tasks which most of us typically use.
1. File Zip Test - We take a 300MB file and measure the time it takes for our test bed to compress it to ZIP format on our test drive. We then run the test again with 300 1MB files to see how the drive performs when working with multiple files.
2. File Unzip Test - Using the same methodology as the File Zip Test, we take a ZIP file of a single 300MB file as well as a ZIP file of 300 1MB files and measure the time it takes to uncompress each ZIP successfully.
3. File Copy Test - We measure how long it takes for the system with our test drive to copy a single 300MB file as well as 300 1MB files to a separate folder on the hard drive.
Take a look at the results...
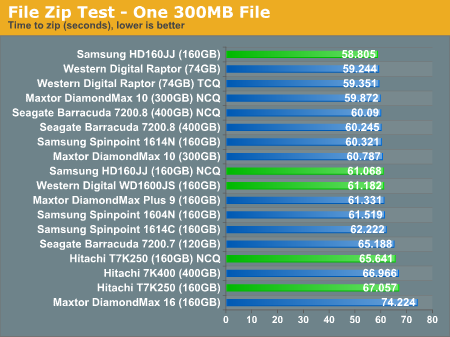
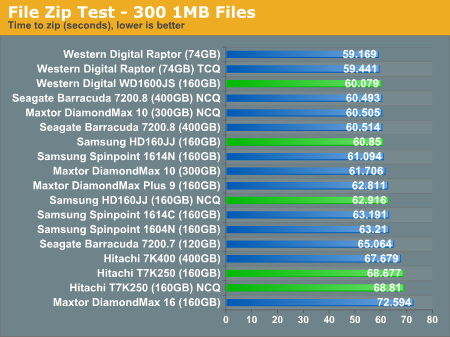
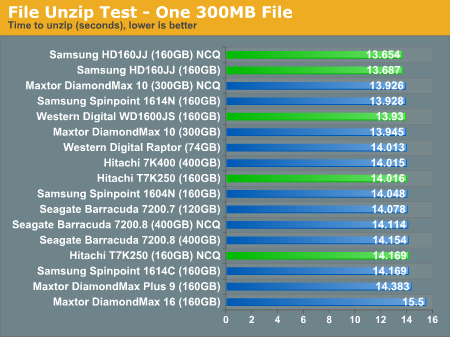
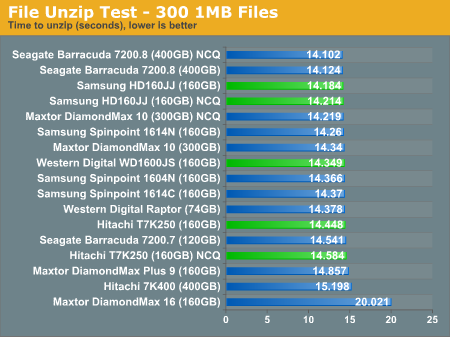
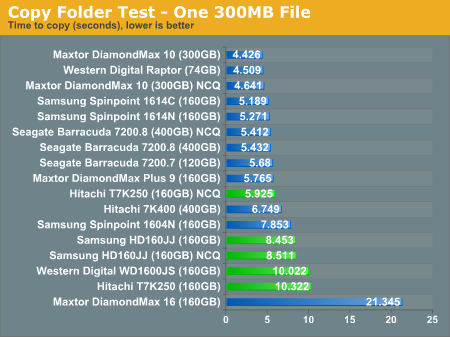
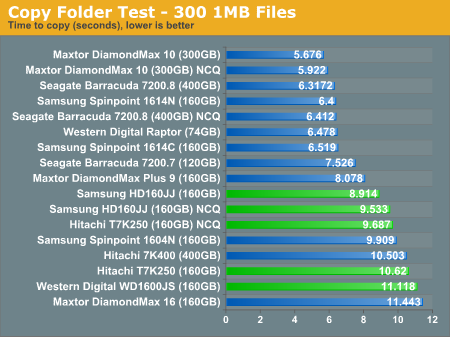
Our results for the file system task benchmarks did not really favor any of the SATA300 drives, but rather scattered the units across the charts. These tests show how each drive handles the various tasks of day to day file system operations.
Real World Tests - Application Load Times
In our Application Load Time tests, we measure the time it takes for each application to startup. For example, our benchmarking tool begins the stopwatch as soon as PhotoShopCS.exe is run and stops after the application has finished loading all of the plugins and filters and shuts down. We take the average of 3 runs with system reboots and hard disk defragmentations before each test run.
Application Load Times (average, seconds) |
|||||||
NCQ/TCQ Status |
PhotoShop CS |
Word 2003 |
Excel 2003 |
Access 2003 |
PowerPoint 2003 |
Winner |
|
| Hitachi T7K250 | w/out NCQ |
8.953 |
2.422 |
1.953 |
2.203 |
2.203 |
|
w/NCQ |
7.984 |
2.375 |
2.609 |
2.766 |
2.109 |
x |
|
| Samsung HD160JJ | w/out NCQ |
8.703 |
2.609 |
2.984 |
3.031 |
2.116 |
|
w/NCQ |
8.601 |
2.554 |
2.887 |
3.115 |
2.245 |
||
| Western Digital WD1600JS | N/A |
8.938 |
2.469 |
2.562 |
2.484 |
2.438 |
|
Hitachi's T7K250 came out as the winner of this round. Photoshop CS usually takes about 8-9 seconds, on average, to load its DLL's and plugins. With NCQ turned on, Photoshop CS finished these tasks 1 second quicker. This 1 second may not seem like such a big deal when it comes to loading applications, but when multitasking scenarious come into play NCQ may shave off a great deal of time.
Real World Tests - Game Level Load Times
We have changed our Game Level Loading Time test to include two of the latest games, Doom 3 and Half-Life 2. Because of their high resolution textures and the large levels, the loading time for the levels of each game are long enough to help show a difference between each drive.
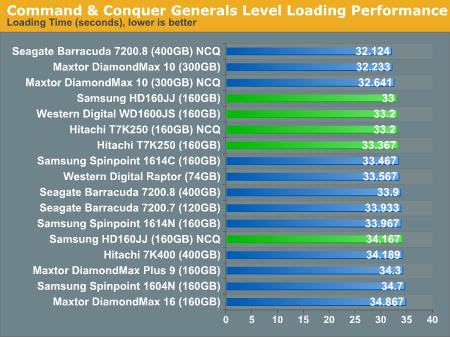
We have also included an older strategy game Command & Conquer: Generals because of its longer level load times. Though the game is a couple years old it still proves to be a good measure of performance data loading performance.
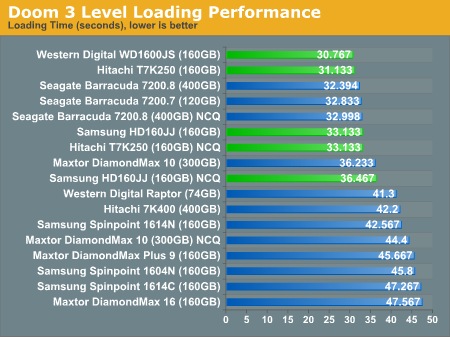
Though 30.767 seconds may not seem like much of a performance boost from Seagate's Barracudas' ~32sec chart toppers, Western Digital's WD1600JS came in at first which is a huge improvement over its 10,000RPM Raptor cousin. And even with NCQ enabled, the HD160JJ and T7K250 were not able to keep up quite as well with 33-36sec loading times
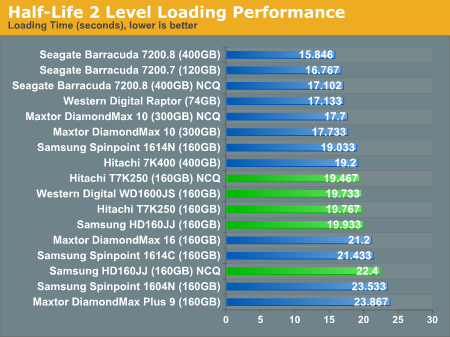
The Barracudas still hang on to first place spots when loading Half-Life 2's d1_canals_01 map. Our SATA300 drives barely broke the 20sec mark.
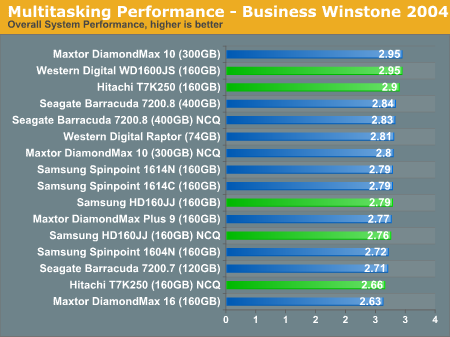
Multitasking Performance - Business Winstone 2004
So far NCQ proves to be a a feature that could easily be nonexistent when running single tasks at a time. Because NCQ is a technology which is designed to handle random requests for data, the only way to efficiently test it is to throw a few applications at and running a few tasks at the same time. This will definitely give a hard drive a workout.
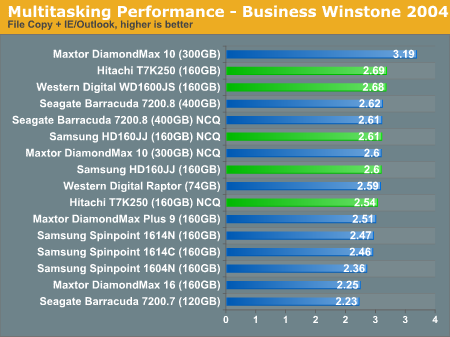
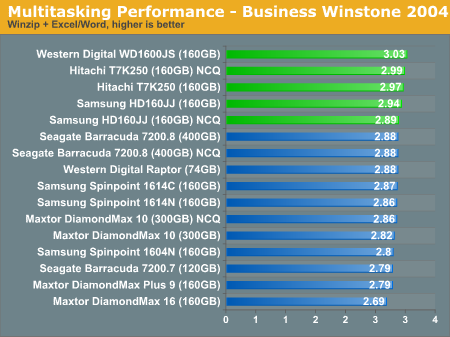
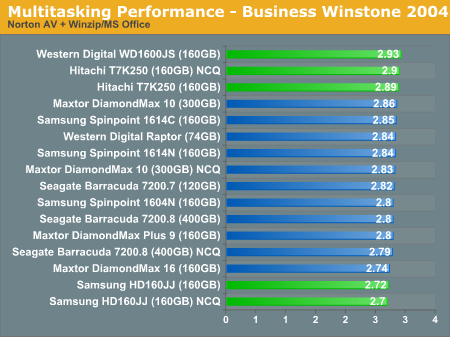
Business Winstone 2004 includes a multitasking test as a part of its suite, which does the following:
"This test uses the same applications as the Business Winstone test, but runs some of them in the background. The test has three segments: in the first, files copy in the background while the script runs Microsoft Outlook and Internet Explorer in the foreground. The script waits for both foreground and background tasks to complete before starting the second segment. In that segment, Excel and Word operations run in the foreground while WinZip archives in the background. The script waits for both foreground and background tasks to complete before starting the third segment. In that segment, Norton AntiVirus runs a virus check in the background while Microsoft Excel, Microsoft Project, Microsoft Access, Microsoft PowerPoint, Microsoft FrontPage, and WinZip operations run in the foreground."
Real World Tests - Multitasking Performance
To provide a real world example of multitasking we use run Outlook and import 450MB of emails into an account. We then time how long it takes our benchmarking utlity to zip a single 300MB file. To compare our results we calculate the difference between the multitasked process and the single task file zip process.
Outlook + File Zip 1 300MB File |
||||
NCQ/TCQ Status |
Multitasked |
File Zip Only |
% Difference |
|
| Hitachi T7K250 | w/out NCQ |
76.543 |
67.057 |
12.39% |
w/NCQ |
79.815 |
65.641 |
21.6% |
|
| Samsung HD160JJ | w/out NCQ |
71.484 |
58.805 |
21.6% |
w/NCQ |
73.554 |
61.068 |
20.4% |
|
| Western Digital WD1600JS | N/A |
74.371 |
61.182 |
21.6% |
Very disappointing. Hitachi's T7K250 performed better than the rest in this real world multitasking test...with NCQ turned off! Now, drive manufacturers list NCQ as a native feature, but it does not seem to work too well in real world situations. As we look at products in the future, we hope to see atleast some improvement given by Native Command Queuing.
Thermal and Acoustics
Heat and sound are also two very important factors in drive performance especially when considering where they will be used. A loud hard drive which becomes warm very quickly may not be the best choice for home theater PCs or any PC without adequate cooling and the noise alone could be a bit annoying. Take a look at how each drive performed as far as heat and noise output goes.
Thermal
Temperature readings are taken directly off of the hard disk drives topside above the platters.
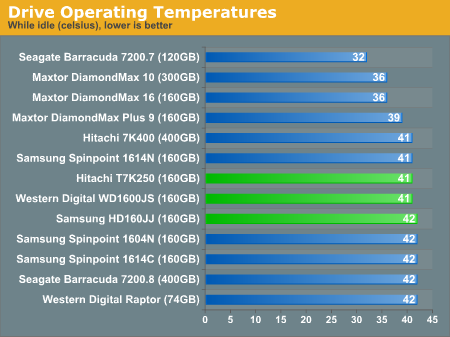
The overall idle temperatures of each drive are not extremely high lingering at about 41-42 degrees celsius. But...
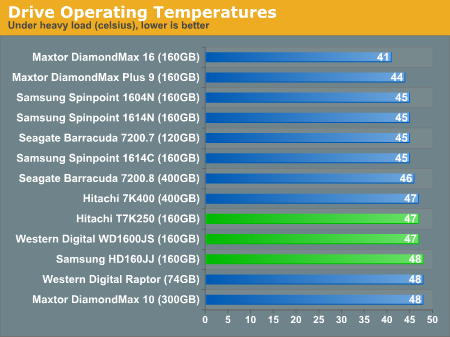
...when comparing them to each drive's operating temperatures, they come close to being the warmest running drives on the list at 47-48 degrees, at the same heat level as the 10,000RPM Raptor and 16MB DiamondMax 10..
Acoustics
To measure the sound output of each drive we have taken decibel readings of each drive at their startup phase as well as the sound output while there is disk activity.
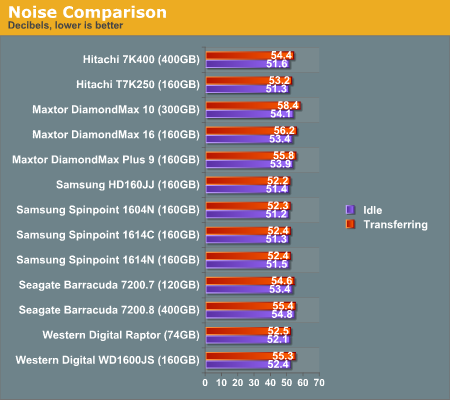
Sound output is never an issue if a high quality sealed case is used to house the PC's components but it can get annoying with a few hard disks churning away. Each of the SATA300 drives produced a reasonable amount of noise, not really as quiet as the SATA150 SpinPoint series, but nowhere as loud as Maxtor's DiamondMax 10.
Final Words
With SATA150 units flooding the market and SATA300 slowly making its way into the world we should start seeing reductions in the main bottleneck of a PC. And though it is proven that hard disk drives, atleast the mechanical, magnetic type, will never reach the speeds of quicker, solid state memory, we will continue to see improvements in technology and hopefully be able to loosen the bottleneck as much as possible.
With SATA300 we have seen improvements when it comes to multimedia and content creation. During the SYSMark and Winstone Content Creation benchmarks, we saw these units perform the best out of a long list of SATA150, some with NCQ implemented, as well as a 10,000RPM Raptor and the DiamondMax 10 with a 16MB buffer.
These 2nd generation SATA drives, however, did struggle in other areas, such as game level loading times and real world file system tasks. And Samsung's HD160JJ came in at last place in Business Winstone 2004's Multitasking Performance benchmarks.
So what do we think of Hitachi's T7K250, Samsung's HD160JJ, and Western Digital's WD1600JS? For now, SATA300 does wonders for multimedia and content creation. The higher transfer rates help in audio/video data throughput more than in office productivity applications due to the requirements for large amounts of data to be moved. In time, however, we should see improvements in drivers to help reach the true potentials for the new SATA standard.
If you like to keep up with the standards than the new SATA300 drives are a great addition to the storage arsenal, but for now SATA150 has yet to reach maturity and higher capacity SATA300 drives should be on their way soon enough. Holding out may not be such a bad idea for consumers who value disk space more than higher transfer rates.


