ASUS Silent Square Pro: Compact Embedded-Fan Heatpipe Tower
by Wesley Fink on April 16, 2007 2:30 AM EST- Posted in
- Cases/Cooling/PSUs
Scaling of Cooling Performance
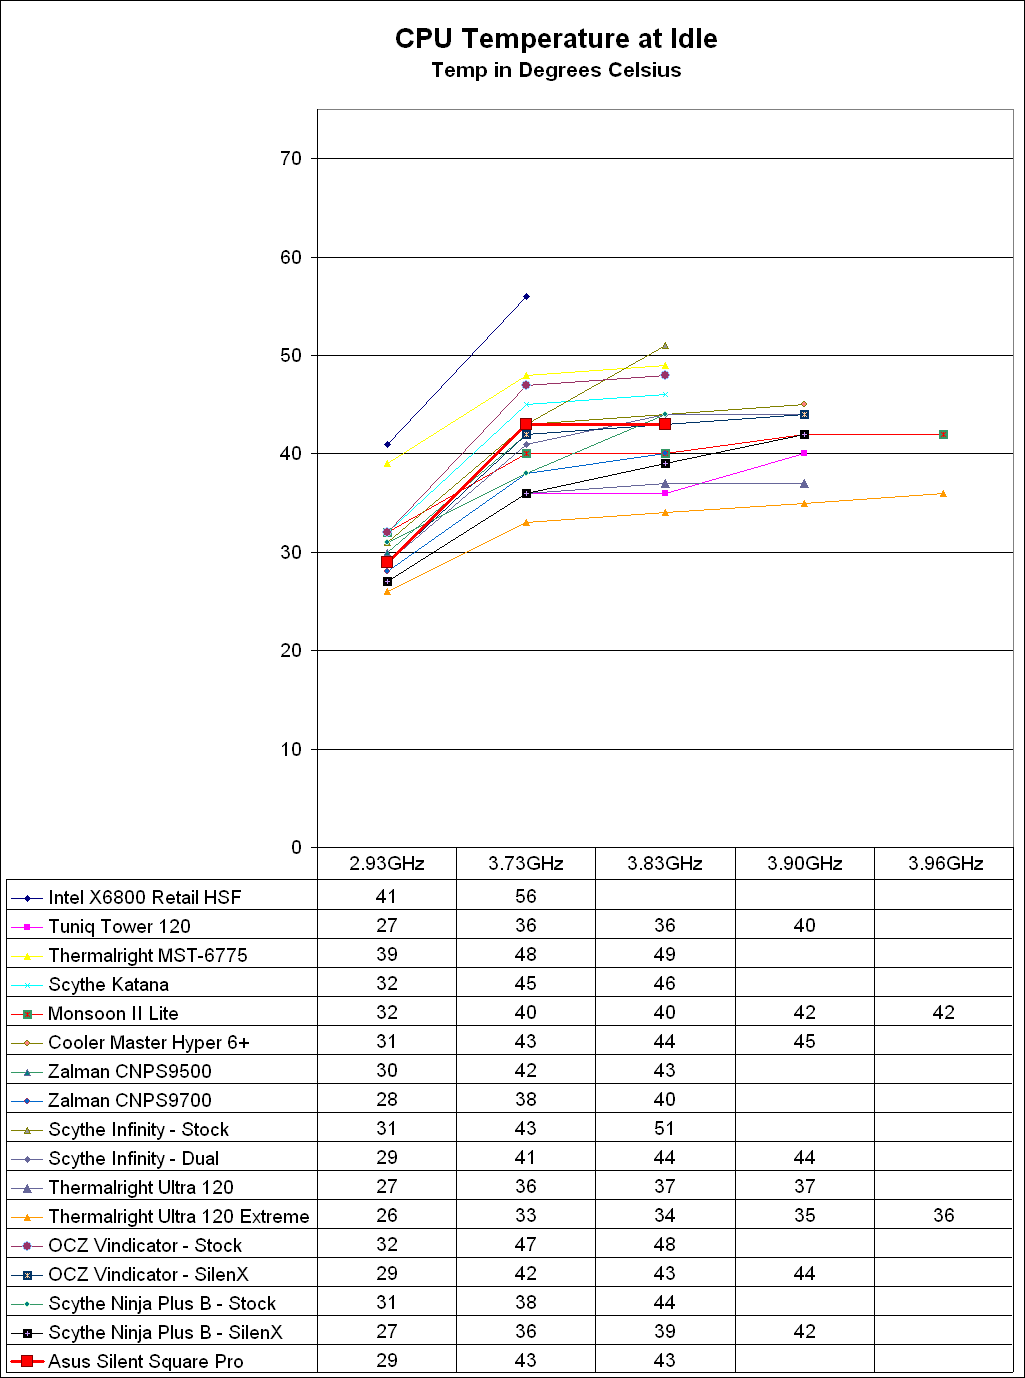
The Thermalright Ultra 120 Extreme has been the top performer so far in CPU cooling at stock speeds. As overclocks are raised, the Ultra 120 with the Scythe SFLEX fan maintains its cooling advantage. The ASUS Silent Square Pro is below average in cooling efficiency as CPU speeds are increased - even with the modified installation to improve socket 775 cooling performance.
At 2.93GHz the retail HSF is running at 41C, compared to 29C with the Silent Square Pro. This is a delta of 12C and an excellent performance. The delta with the stock fan to Intel retail remains similar at idle as the CPU speed is increased. By 3.73GHz the idle with the retail fan is 56C compared to the Silent Square stock at 43C - a delta of 13C
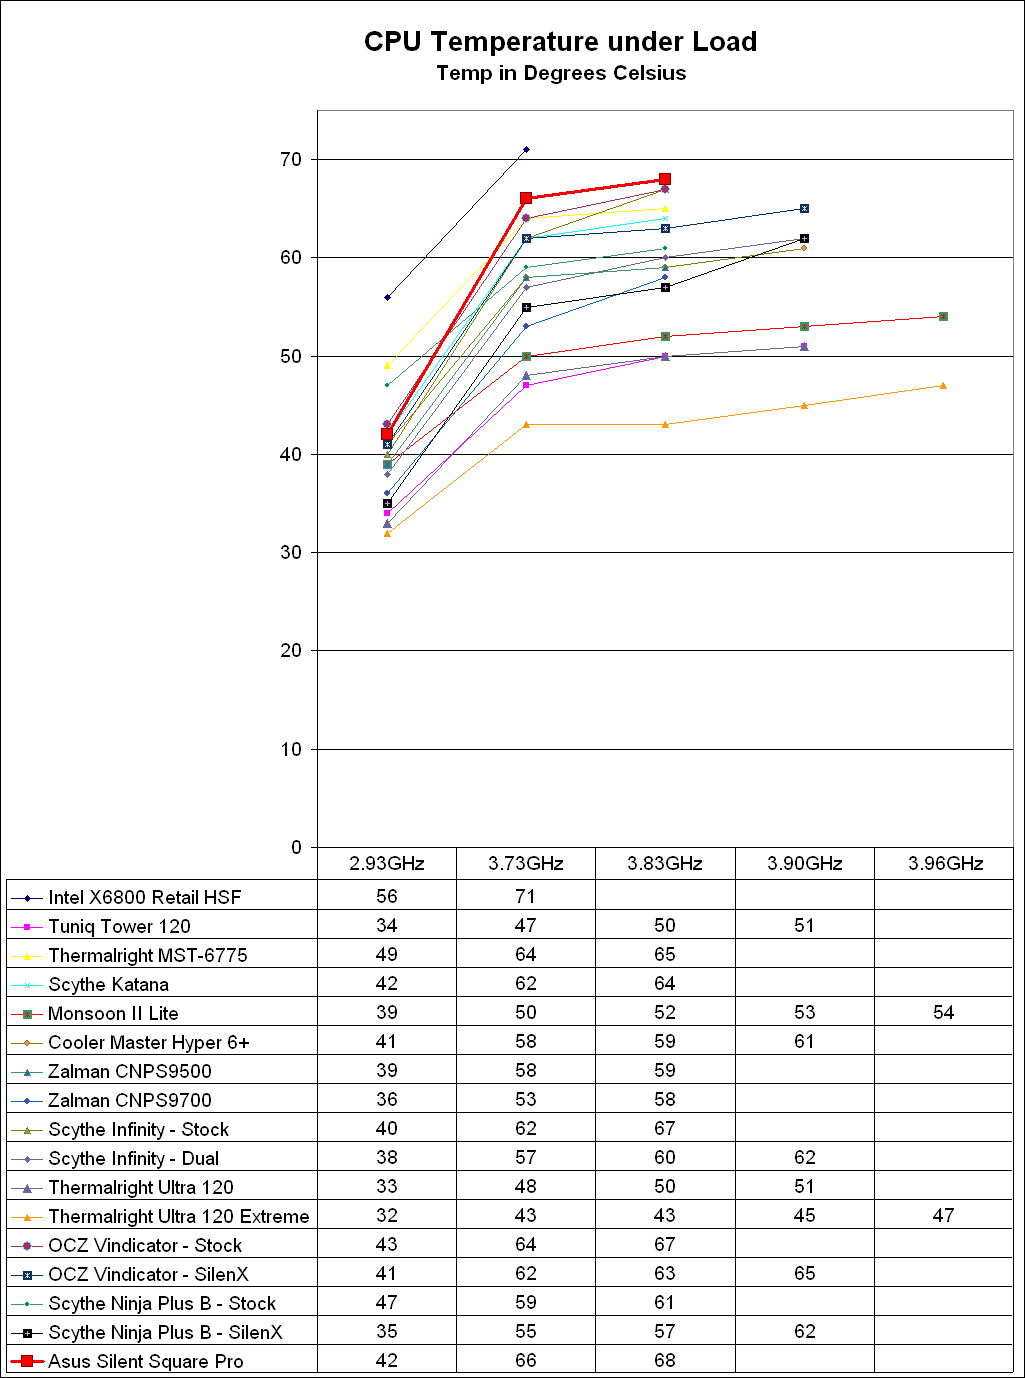
Cooling efficiency of the ASUS Silent Square Pro was then tested under load conditions, where much poorer cooling performance was observed. Results are compared to the retail HSF and other recently tested CPU coolers. The Silent Square Pro generated results very comparable to the Zalman 9500. The 9500 is a cooler which excels in cooling at stock speeds, but which is not nearly as efficient once the CPU is overclocked to higher frequencies - at least when compared to the best coolers tested at AnandTech.
The ASUS Silent Square topped out a stable clock speed of 3.81 GHz - only a little better than the Intel Retail cooler at 3.73GHz and poorer than the 3.90GHz reached with stability with the better heatpipe towers in our cooling performance tests. 3.90 GHz is the highest overclock the Tuniq, Thermalright Ultra 120, OCZ Vindicator, and push-pull Scythe Infinity could reach with stability. At 3.81GHz under load the Silent Square was at 68C compared to the Tuniq Tower 120 at a similar speed at 50C, and the top Thermalright Ultra 120 Extreme/Scythe SFLEX at 43C.
Our test methodology uses real gaming at overclocked speeds to test the cooling efficiency of the unit under test. From this perspective the performance of ASUS Silent Square Pro is a disappointment. Even with the modified mount to improve cooling, the overclocked gaming cooling is below average among top heatpipe towers tested at AnandTech.
As stated many times, the overclocking abilities of the CPU will vary at the top, depending on the CPU. This particular CPU does higher FSB speeds than any X6800 we have tested, but the 3.9GHz top speed with the top tier heatpipe towers is pretty average among the X6800 processors we have tested with Tuniq cooling. A few of the other processors tested with the best air coolers reach just over 4 GHz, but the range has been 3.8 to 4.0GHz. Stock cooling generally tops out 200 to 400 MHz lower, depending on the CPU, on the processors tested in our lab.
The Thermalright Ultra 120 Extreme has been the top performer so far in CPU cooling at stock speeds. As overclocks are raised, the Ultra 120 with the Scythe SFLEX fan maintains its cooling advantage. The ASUS Silent Square Pro is below average in cooling efficiency as CPU speeds are increased - even with the modified installation to improve socket 775 cooling performance.
 |
| Click to enlarge |
At 2.93GHz the retail HSF is running at 41C, compared to 29C with the Silent Square Pro. This is a delta of 12C and an excellent performance. The delta with the stock fan to Intel retail remains similar at idle as the CPU speed is increased. By 3.73GHz the idle with the retail fan is 56C compared to the Silent Square stock at 43C - a delta of 13C
Cooling efficiency of the ASUS Silent Square Pro was then tested under load conditions, where much poorer cooling performance was observed. Results are compared to the retail HSF and other recently tested CPU coolers. The Silent Square Pro generated results very comparable to the Zalman 9500. The 9500 is a cooler which excels in cooling at stock speeds, but which is not nearly as efficient once the CPU is overclocked to higher frequencies - at least when compared to the best coolers tested at AnandTech.
 |
| Click to enlarge |
The ASUS Silent Square topped out a stable clock speed of 3.81 GHz - only a little better than the Intel Retail cooler at 3.73GHz and poorer than the 3.90GHz reached with stability with the better heatpipe towers in our cooling performance tests. 3.90 GHz is the highest overclock the Tuniq, Thermalright Ultra 120, OCZ Vindicator, and push-pull Scythe Infinity could reach with stability. At 3.81GHz under load the Silent Square was at 68C compared to the Tuniq Tower 120 at a similar speed at 50C, and the top Thermalright Ultra 120 Extreme/Scythe SFLEX at 43C.
Our test methodology uses real gaming at overclocked speeds to test the cooling efficiency of the unit under test. From this perspective the performance of ASUS Silent Square Pro is a disappointment. Even with the modified mount to improve cooling, the overclocked gaming cooling is below average among top heatpipe towers tested at AnandTech.
As stated many times, the overclocking abilities of the CPU will vary at the top, depending on the CPU. This particular CPU does higher FSB speeds than any X6800 we have tested, but the 3.9GHz top speed with the top tier heatpipe towers is pretty average among the X6800 processors we have tested with Tuniq cooling. A few of the other processors tested with the best air coolers reach just over 4 GHz, but the range has been 3.8 to 4.0GHz. Stock cooling generally tops out 200 to 400 MHz lower, depending on the CPU, on the processors tested in our lab.


24 Comments
View All Comments
Avalon - Tuesday, April 17, 2007 - link
Good review. Useless cooler.I'm still going to throw my vote out there for you guys possibly reviewing the Coolermaster HyperTX. That thing is supposed to cool extremely well while providing awesome mosfet cooling.
poohbear - Monday, April 16, 2007 - link
thanks for the review as heatsink reviews are always good to see! however, could u start using bar graphs in your reviews as they're MUCH easier to read then the ones u choose to use. Much simpler to view the info instead of sifting through all the names on the side and numbers on the right. please and thank u.Wesley Fink - Monday, April 16, 2007 - link
The bar graph idea sounds good, but the charts are trend line charts with 4 or 5 points for each cooler and fan configuration. It would take at least 5 bar graphs to replace each chart, and then the trend would also be lost. We have added a "click to enlarge" feature to the charts to make them more usable for those who closely scrutinize the temperature data.Frumious1 - Monday, April 16, 2007 - link
Every now and then some whiner will come along and dislike the scaling graphs, Wes. Just ignore them! Anyone that can't understand the intent of a scaling graph needs a lesson in reading comprehension anyway. My only thought is maybe some sorting of the data in the scaling graphs would be useful. They crurently seem to be sorted by when you reviewed the coolers, and most people probably could care less about the chronological aspects.At some point, you're going to need to start dropping coolers from those scaling graphs as well. That's my opinion at least - they're already very crowded! Maybe select the "best" coolers (or just a reasonable baseline group) and just leave those in the scaling graphs, with the complete list of coolers in the other charts? You could have the Thermalright Ultra 120 Extreme (is that out yet!?), Tuniq 120, Cooler Master Hyper 6+, Monsoon Lite II, Scythe Ninja B, and the lowly Intel retail. Then just add the specific cooler being tested. Right now there's definitely an "information overload" aspect ot the scaled charts, and it will only get worse with time as more HSFs are added.
/$0.02
strikeback03 - Monday, April 16, 2007 - link
Or possibly the best few coolers in each price bracket, along with the tested cooler, and a link to a large image of all of the tested coolers. Something interactive, where you could turn individual coolers on and off, whould be nice, though I don't know if there is software that would allow these to be easily made.JarredWalton - Monday, April 16, 2007 - link
I know our graphing engine is currently undergoing some development/design work, but when that will be complete and what it will offer I do not yet know. If we could get something interactive, that would be pretty cool. Right now, our engine doesn't handle scaling graphs at all, which is why we just use Excel to generate those manually. We can hope, though! :)NARC4457 - Monday, April 16, 2007 - link
It feels like the noise measurement methodology needs a tweak since there are many coolers that are sitting right at the noise floor. I know that you are testing these in real-world conditions, with components that enthusiasts are likely to use. But I guess it just feels like the test is becoming less meaningful if the results are the same across many coolers.I don't really have a suggestion here, because I don't think people would like it either if you simply stated that the cooler was not louder than ambient without showing the method and
Wesley Fink - Monday, April 16, 2007 - link
We will be revamping our test bed when we do the 120mm fan roundup. We are currently evaluatig components to find a little lower noise floor and to priduce some consistent test methods that don't get spoofed by variable speed PS fans. Thanks for your comments.flipmode - Monday, April 16, 2007 - link
Thanks for another HSF article - these are valuable contributions to the enthusiast scene. But I have to ask if you can start cropping and upscaling your graphs - they're darn near unreadable now that you've made such a wonderful effort to test 20 coolers. I want to actually be able to read what you've take the time to present.Scythe Ninja Fanboy
crimson117 - Monday, April 16, 2007 - link
Or provide a link to a larger version of each graph.