The Microsoft Surface Pro 4 Review: Raising The Bar
by Brett Howse on October 21, 2015 9:00 AM ESTDisplay
From the outside, the Surface Pro 3 and Surface Pro 4 displays are deceptively similar. Yes, the new model is slightly larger at 12.3-inches but has the same 3:2 aspect ratio as the 12-inch display in the Surface Pro 3. But what the form factor hides is all of the work that has gone into improving the display at both the panel level and the overall display stack. In fact Microsoft has consistently improved on their displays, starting with their zero air gap laminated displays on the older Surface Pro models. So what changes do we have in store over the Surface Pro 3 display with a new panel?
The most obvious change is that the new display has a much higher resolution. The Surface Pro 3 was 2160x1440, and for Surface Pro 4 that has jumped up to 2736x1824. It doesn’t look like a huge change, but the new panel has almost two million more pixels and the pixel density jumped up to 267 PPI. You really would have a hard time discerning individual pixels on this panel but if you did they would look like this:

Despite the increase in resolution, Microsoft has stuck with a standard RGB stripe which is important because if they had gone with PenTile RGBW it is unlikely they would be able to achieve their other goals for this display. Microsoft is aiming for full sRGB coverage on all Surface Pro 4 models with each one being calibrated at the factory. We’ve heard such claims before, but they don’t always pan out, but I’ll get to that in a minute. The importance of factory calibration cannot be overstated. Yes, you can add ICC profiles to Windows to help with color accuracy, but unless you have a 3D lookup table (LUT), this generally only helps grayscale accuracy. Plus, many programs ignore ICC profiles anyway. So having it calibrated with a hardware LUT is the right way to go.
The display is an 8-bit panel, which not only helps Microsoft to hit their sRGB target but improves overall image reproduction. Coincidentally enough, this is especially evident with the new Windows 10 default background, as a 6-bit panel can show a lot of dithering in the smoke around the window whereas the Surface Pro 4 suffers no such indignities.
Another point about this display is that Microsoft is saying it has the thinnest optical stack ever for Surface Pro. This does a couple of things. It obviously lets them make the tablet thinner, but it also helps reduce parallax when using the pen, which is a big part of Surface. But one of the nicest changes is that it makes the display feel like it’s right under your finger. Generally, when I look at a notebook, I see a display that is somewhat sunken in the housing, but with Surface Pro 4 it really feels like it is right at the top. It looks great.
The final point about this display before we move on to testing it is battery life. High pixel density displays are already the single biggest power draw in a notebook or tablet, and moving to a higher density like Microsoft has done here can cause some significant issues with battery life since the backlight needs to be stronger to achieve the same level of brightness. One way to counter that is to use an Indium Gallium Zinc Oxide (IGZO) panel. The IGZO transistors are more transparent than amorphous silicon, and let more light through. Microsoft has gone this route, but in an unexpected way. IGZO panels are traditionally from Sharp, but this is the first IGZO display I have seen from Samsung. Samsung signed a joint partnership with Sharp earlier this year to build IGZO panels and I believe this is the first device to use one.
With the preamble out of the way, let’s dig into testing the display. We use SpectraCal’s CalMAN 5 software suite for display testing, with a custom workflow. For the actual tests, we use an X-Rite i1Display Pro colorimeter for brightness and contrast readings, and an X-Rite i1Pro spectrophotometer for measuring the color accuracy.
Brightness and Contrast
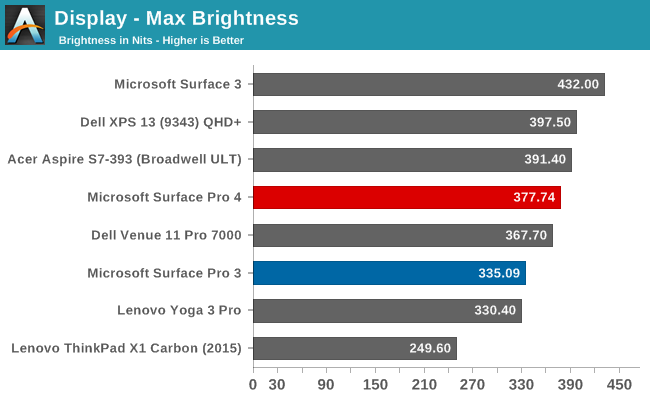
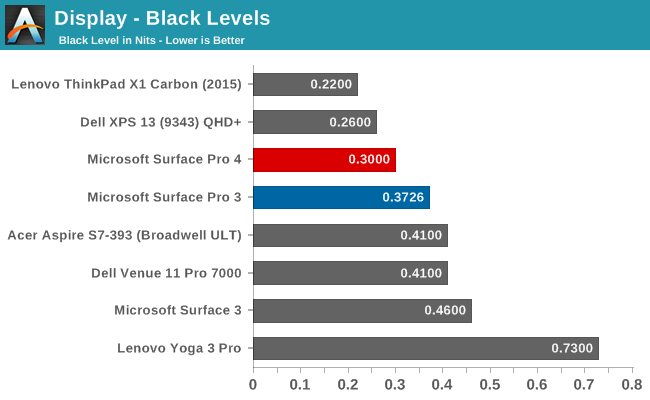
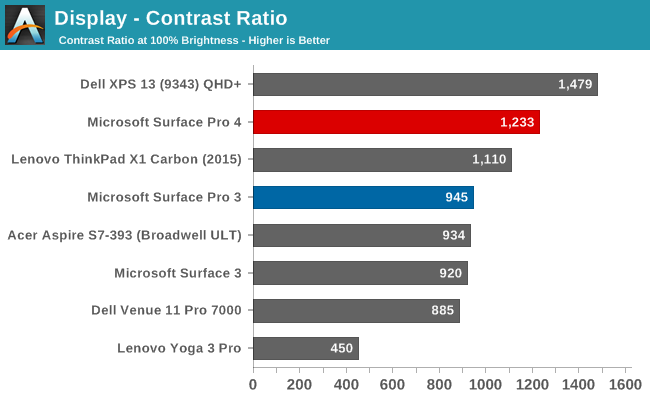
Despite the higher resolution, Microsoft has been able to increase the peak brightness to 377 nits, and at the same time they have also increase black levels. This leads to a much better contrast ratio of 1277:1 on the Surface Pro 4. The display also gets very dim, going all the way down to 12 nits if you need to use it in a dark room. Playing back movies on the Surface Pro 4 I immediately noticed how much better the blacks were and how much more detail I could see because of it in a dark movie.
Grayscale Accuracy
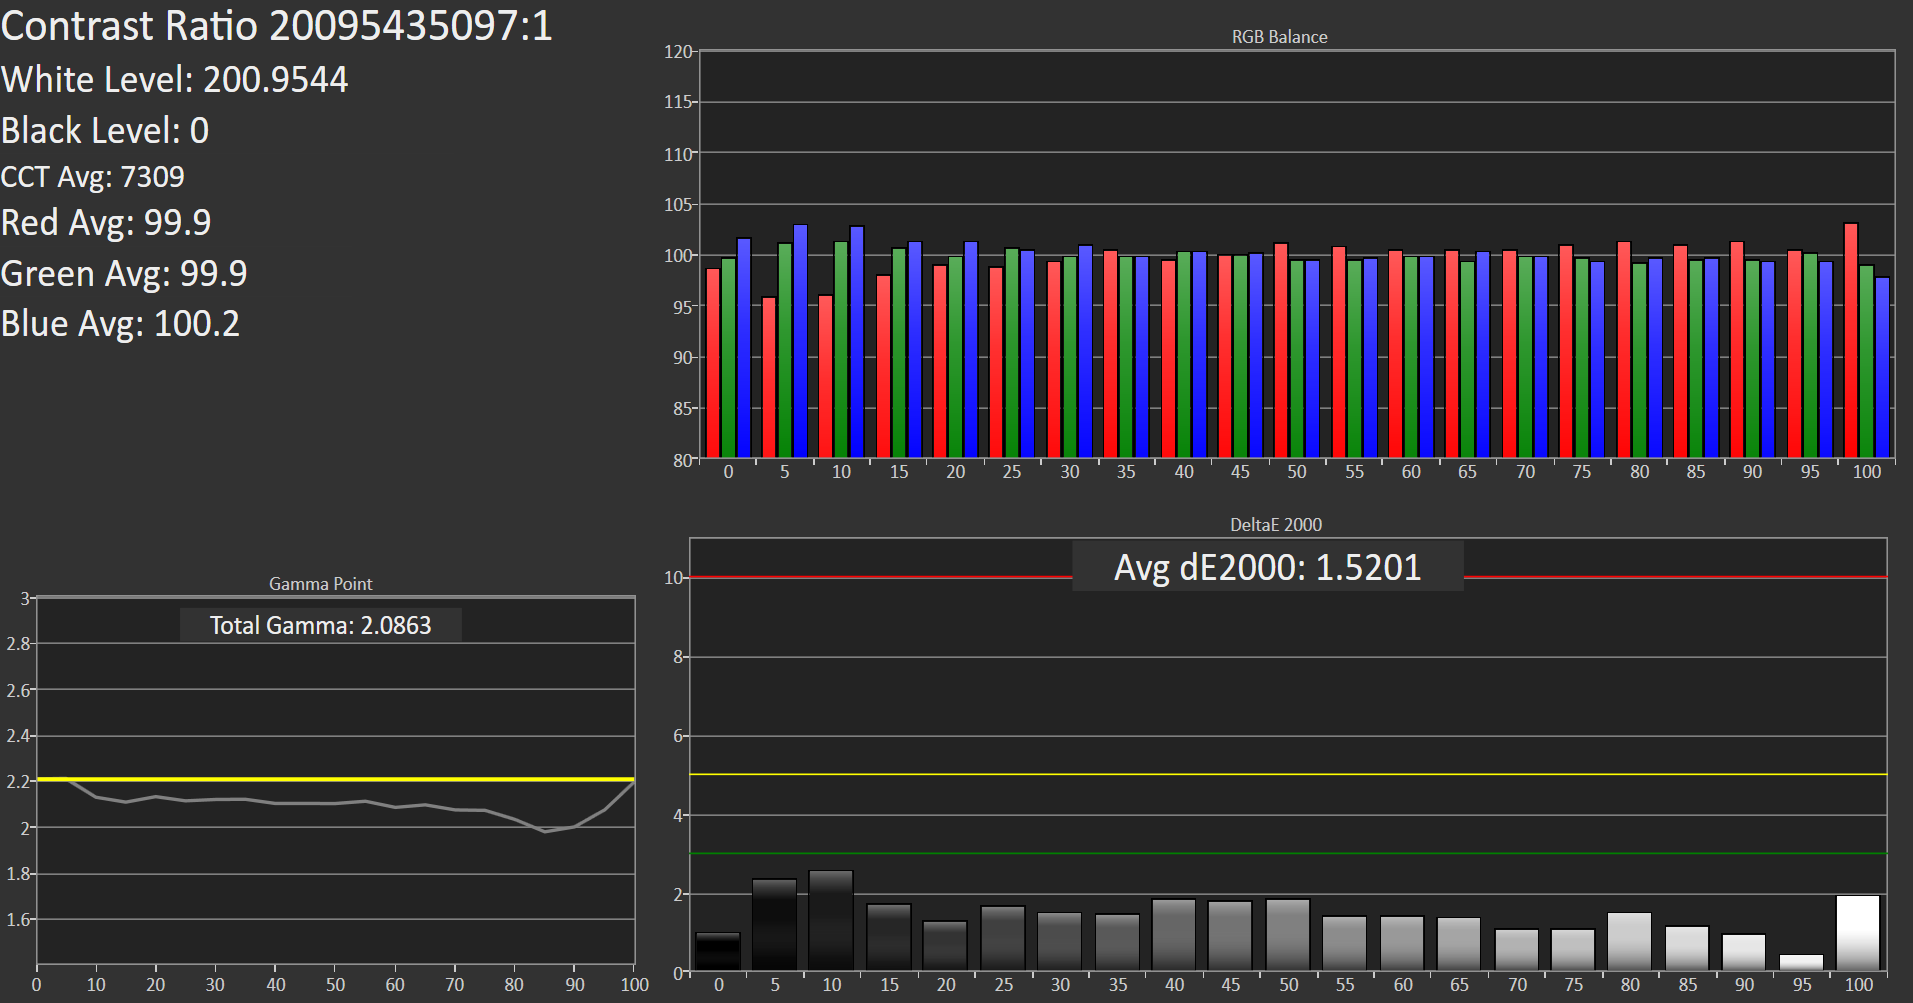
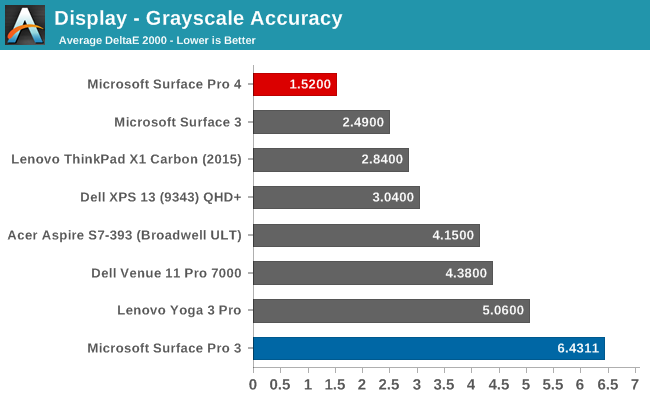
The biggest change from the Surface Pro 3 is how much improved the grayscale accuracy is with the Surface Pro 4. Last year’s model had a good saturation profile, but it was let down by inaccurate grayscale performance. The Surface Pro 4 on the other hand has fantastic grayscale, with an average around 1.5. In fact none of the sub-tests exceed 3 dE (the green bar) in our testing, which is the generally considered the cut-off point for visible inaccuracies. As a result the Surface Pro 4 delivers great grayscale accuracy across the board.
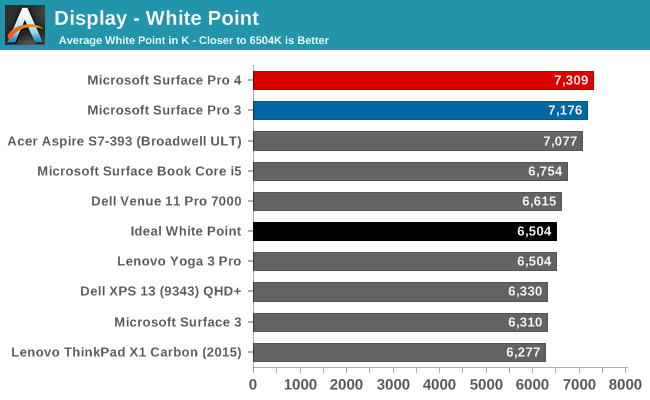
The one weakness here for the tablet's display is in its white point. The Surface Pro 3 was already a little blue, and the Surface Pro 4 regresses a bit more white a white point about 800K above ideal.
Saturation Accuracy
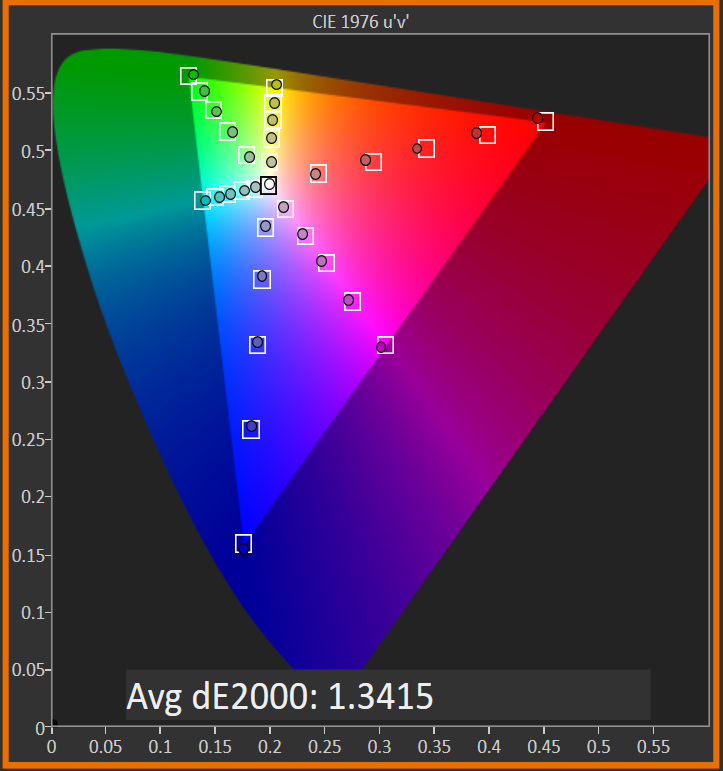
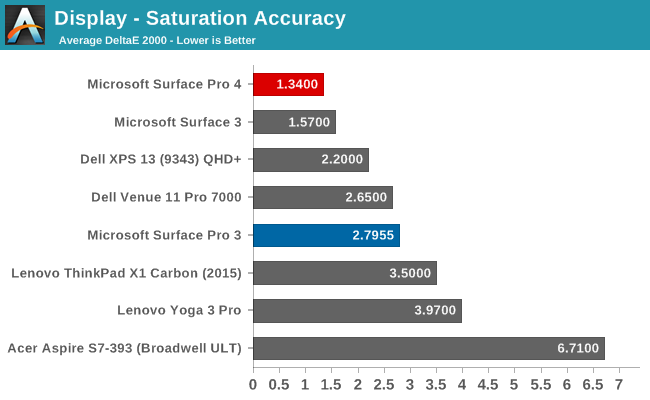
The Surface Pro 4 nails the sRGB gamut. None of the saturation tests got close to the 3 dE level, and the panel itself covers pretty much the entire sRGB color space.
Gretag MacBeth
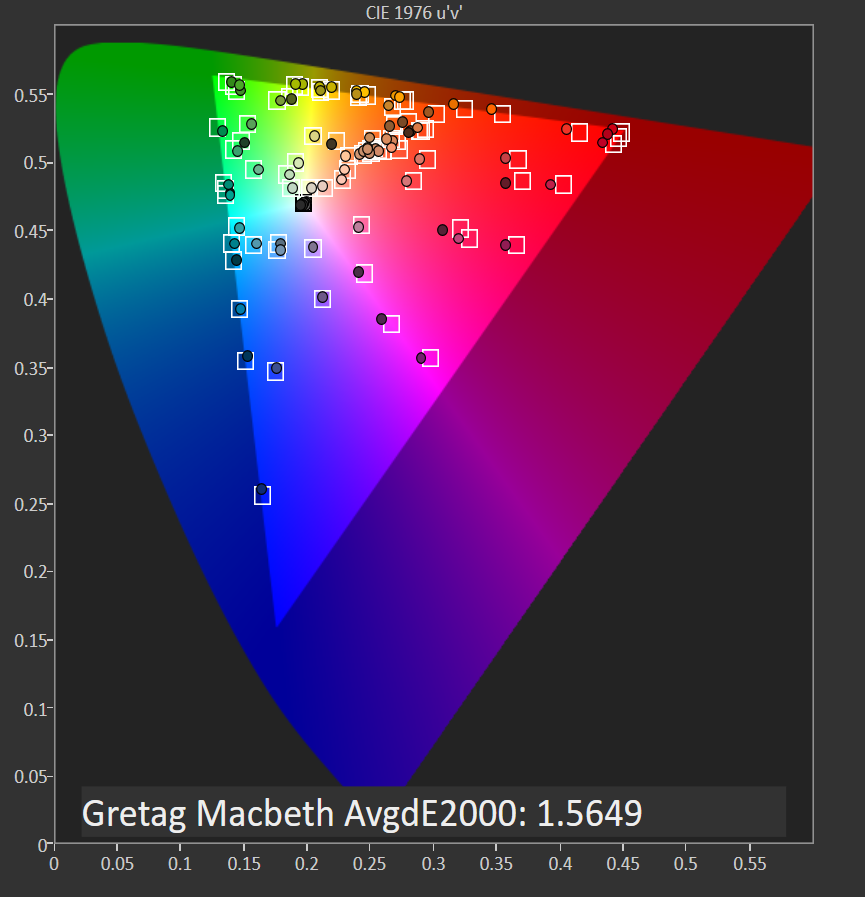
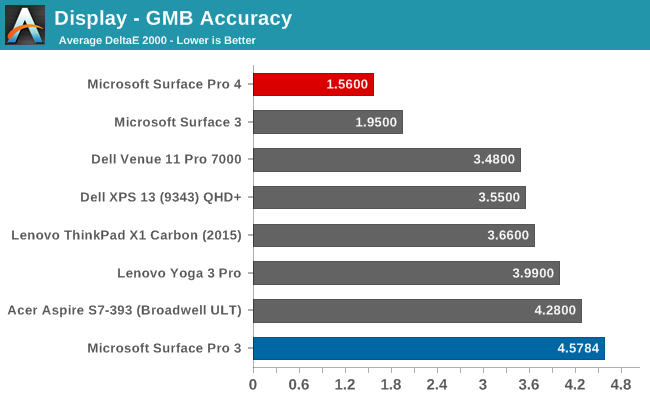
The GMB test is the most comprehensive. It tests many different colors including flesh tones which are important to a good experience. The Surface Pro 3 was dragged down on this test by its poor grayscale, but the Surface Pro 4 absolutely nails this test. Generally, when averages are under 3 dE like this one, there are still several colors that spike over the dE 3 level, and with the Surface Pro 4 there are only two spikes over 3 dE with both being a shade of orange. Neither spike is much over the visible level though with one being about 3.25 and the other being 3.5. On a test that checks so many colors, this is one of the best results I have seen.
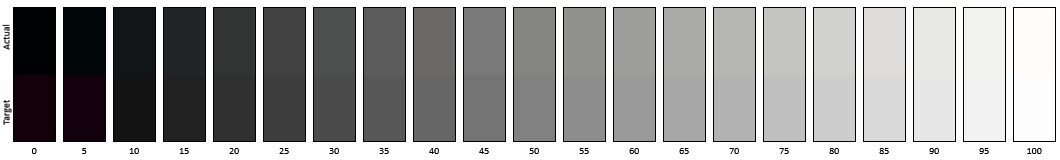
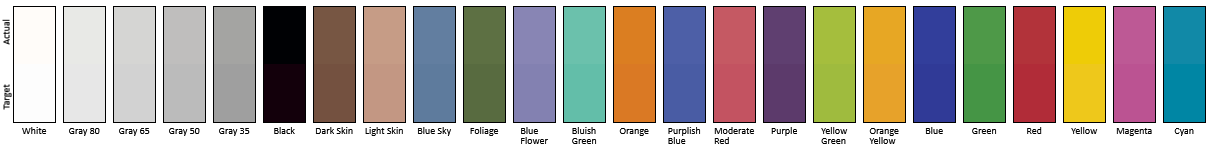
Color Comparator
To get a feel for what the different error levels represent, we have two color comparators. The bottom half is the expected color, and the top half is what the panel produces. Please note that these are relative levels, since any error in your own display will skew the results, but it gives a good look at what the accuracy means and can easily show poor grayscale effects.
Ultimately what we see with the Surface Pro 4 is that Microsoft has taken the display tech and moved it well past the Surface Pro 3. Color accuracy is fantastic, whites are whiter, blacks are blacker, and the panel almost feels like it is flush with the surface of the tablet. Microsoft put a lot of tech into the entire Surface Pro 4 display stack, including the panel itself and the custom PixelSense digitizer which handles both touch and pen. After several years of almost getting the display right, with Surface Pro 4 it looks like they have finally succeeded.


175 Comments
View All Comments
BMNify - Friday, October 23, 2015 - link
Thanks for an excellent review Brett, would be interesting to see the battery life tests with m3 version, hopefully you can get hold of it later and add the data to the table and also a pipeline post.Superlight - Friday, October 23, 2015 - link
Man ... Thanks for the PC Mag review. Anandtech has gone so far downhill :(((SaolDan - Friday, October 23, 2015 - link
Dude when i read your comment i went straight to pcmag.com. OMG what a disappointment that was. And the nonstop ads on my phone( Company issued iphone 6 which i hate btw. I was happier with my $35 lumia 635). Anandtech in my opinion is a good as it always has been. If you dont like the reviews here just go away.Klaus.88 - Friday, October 23, 2015 - link
I have to ask Anandtech: is it possible to have partial results of 3DMark benchamarks and similar? I need the graphic results.Thank you
Eleveneleven - Friday, October 23, 2015 - link
What is taking so long on the Surface Book review? Pretty much everyone else has theirs out. The Surface 4 review should have come out AFTER that. That's no where near as significant of a release.ezridah - Friday, October 23, 2015 - link
Read the beginning of the second paragraph:http://www.anandtech.com/show/9732/the-microsoft-s...
Eleveneleven - Monday, October 26, 2015 - link
So? He got that a week ago or longer. Where is his post production unit? A review should be up by now.Eleveneleven - Monday, October 26, 2015 - link
They're pretty much the only tech review site without a review on it. That looks really bad.val580 - Monday, October 26, 2015 - link
Yeah I mean I pay them a lot for Christ sake! Give my money back!IntelUser2000 - Sunday, October 25, 2015 - link
Guesses on the Core m3 and Core i7 with Iris 540:Core m3
-Performance should be quite a lot better and actually not far off from i5 SP3
-Battery life is probably similar to Core i5 versions. Ideally it should be better but lets see how good Intel does with it
-This is going to get stiff competition from the A9X chips. It'll probably get beaten in graphics but be better on CPU
Core i7 with Iris 540
-30-40% faster in graphics than Core i5 with HD 520. Closer to 30% if eDRAM affects TDP available to CPU/GPU too much, 40% if it doesn't. On the Iris Pro chips the 128MB costs them 3W, 3W is a lot for a 15W chip
-10-15% better than Core i5 CPU, with ~5% due to eDRAM
-Battery life might end up somewhat worse. eDRAM adds 0.25W power to idle power.