The Intel Broadwell Xeon E3 v4 Review: 95W, 65W and 35W with eDRAM
by Ian Cutress on August 26, 2015 9:00 AM ESTGaming Benchmarks: High End
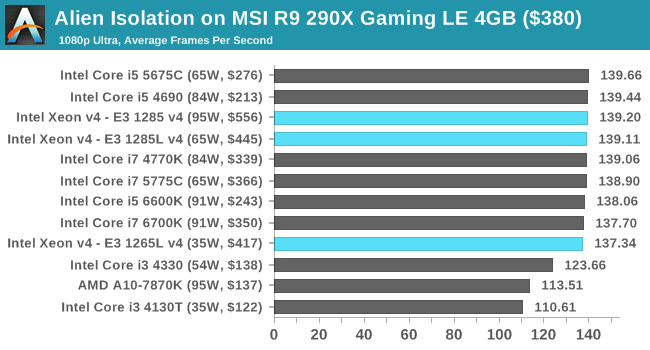
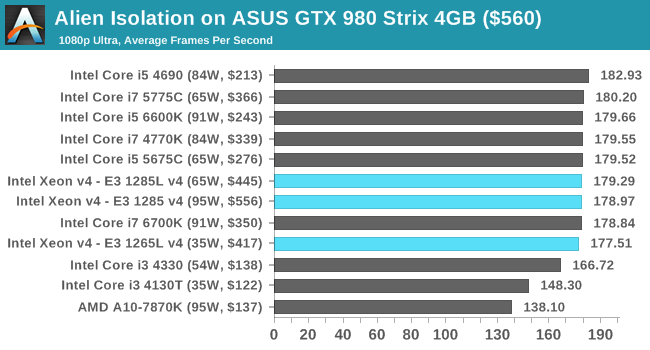
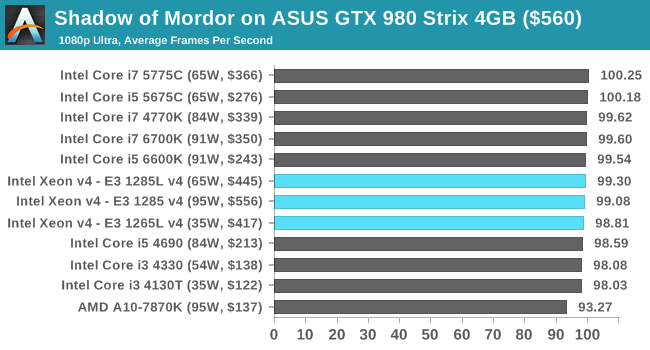
To satisfy our curiosity regarding high power and low power eDRAM based Xeons in gaming, we ran our regular suite through each processor. On this page are our results with the top models at their respective release dates – the GTX 980 and R9 290X. To answer some questions regarding our use of GTX 980s rather than GTX 980 Tis, the simple answer is that for long term platform testing, we need a consistent graphics setup which changes every couple of years. This is coupled with the difficulty of sourcing several cards at once from our contacts that have available budget to do so. At the time of this current cycle, the GTX 980 was NVIDIA’s top model and ASUS stepped up to the plate with a set of 980 Strix cards. Similarly, AMD provided directly two of MSI’s R9 290X 4GB models. When it comes time to update the cycle (and/or games), we try and test the new graphics on as many CPUs as possible. But this does take a substantial amount of time to set up each platform (X99, Z170, Z97, Z77, X79, X58, FM2+, AM3) and run the gauntlet of i7/i5/i3/FX/A10/A8 processors on each. That’s not to say it’s not fun, but it is a comparatively large time investment hence the perceived long generational delay (in terms of graphics) between GPU-on-CPU updates.
Alien: Isolation
If first person survival mixed with horror is your sort of thing, then Alien: Isolation, based off of the Alien franchise, should be an interesting title. Developed by The Creative Assembly and released in October 2014, Alien: Isolation has won numerous awards from Game Of The Year to several top 10s/25s and Best Horror titles, ratcheting up over a million sales by February 2015. Alien: Isolation uses a custom built engine which includes dynamic sound effects and should be fully multi-core enabled.
For low end graphics, we test at 720p with Ultra settings, whereas for mid and high range graphics we bump this up to 1080p, taking the average frame rate as our marker with a scripted version of the built-in benchmark.

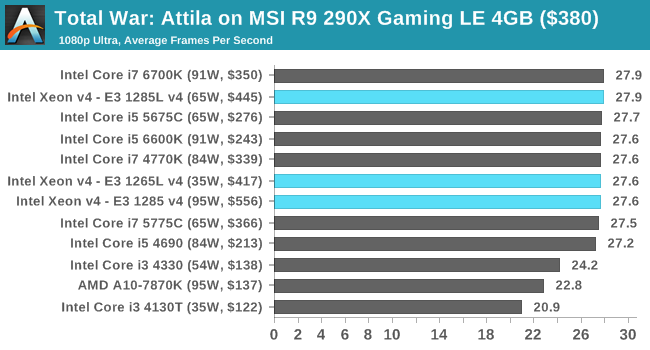
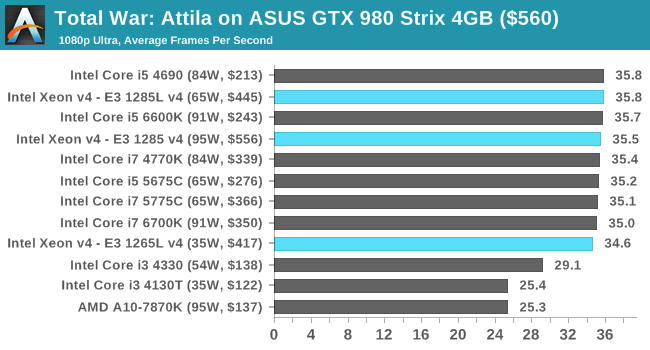
Total War: Attila
The Total War franchise moves on to Attila, another The Creative Assembly development, and is a stand-alone strategy title set in 395AD where the main story line lets the gamer take control of the leader of the Huns in order to conquer parts of the world. Graphically the game can render hundreds/thousands of units on screen at once, all with their individual actions and can put some of the big cards to task.
For low end graphics, we test at 720p with performance settings, recording the average frame rate. With mid and high range graphics, we test at 1080p with the quality setting. In both circumstances, unlimited video memory is enabled and the in-game scripted benchmark is used.

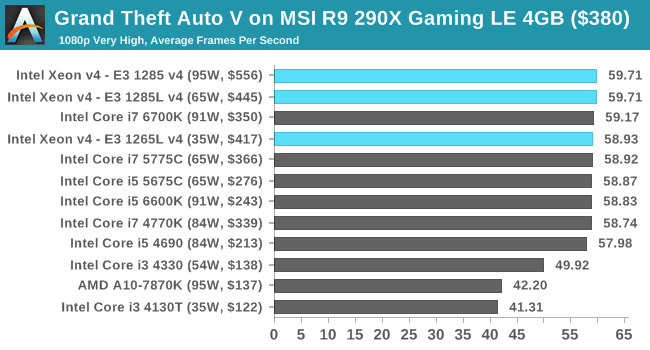
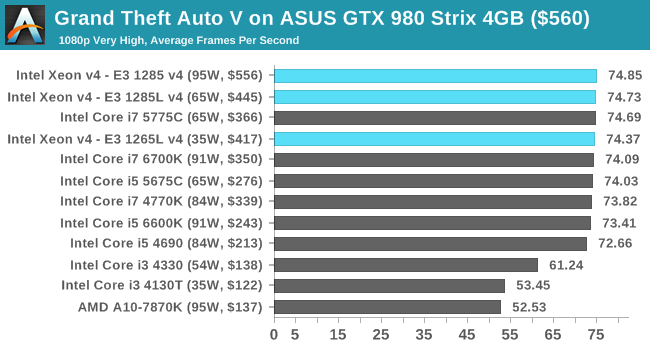
Grand Theft Auto V
The highly anticipated iteration of the Grand Theft Auto franchise finally hit the shelves on April 14th 2015, with both AMD and NVIDIA in tow to help optimize the title. GTA doesn’t provide graphical presets, but opens up the options to users and extends the boundaries by pushing even the hardest systems to the limit using Rockstar’s Advanced Game Engine. Whether the user is flying high in the mountains with long draw distances or dealing with assorted trash in the city, when cranked up to maximum it creates stunning visuals but hard work for both the CPU and the GPU.
For our test we have scripted a version of the in-game benchmark, relying only on the final part which combines a flight scene along with an in-city drive-by followed by a tanker explosion. For low end systems we test at 720p on the lowest settings, whereas mid and high end graphics play at 1080p with very high settings across the board. We record both the average frame rate and the percentage of frames under 60 FPS (16.6ms).

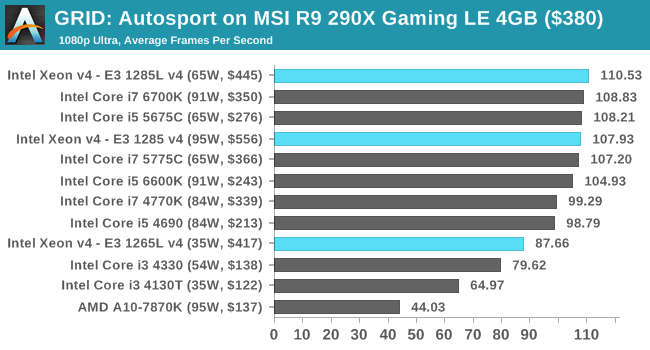
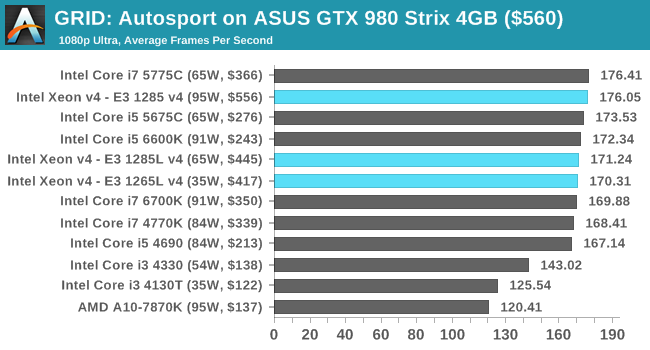
GRID: Autosport
No graphics tests are complete without some input from Codemasters and the EGO engine, which means for this round of testing we point towards GRID: Autosport, the next iteration in the GRID and racing genre. As with our previous racing testing, each update to the engine aims to add in effects, reflections, detail and realism, with Codemasters making ‘authenticity’ a main focal point for this version.
GRID’s benchmark mode is very flexible, and as a result we created a test race using a shortened version of the Red Bull Ring with twelve cars doing two laps. The car is focus starts last and is quite fast, but usually finishes second or third. For low end graphics we test at 1080p medium settings, whereas mid and high end graphics get the full 1080p maximum. Both the average and minimum frame rates are recorded.

Middle-Earth: Shadow of Mordor
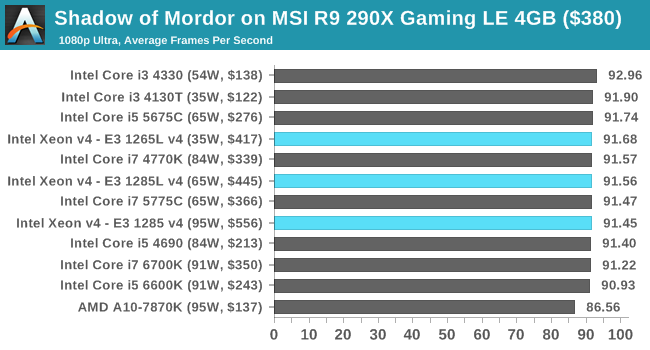
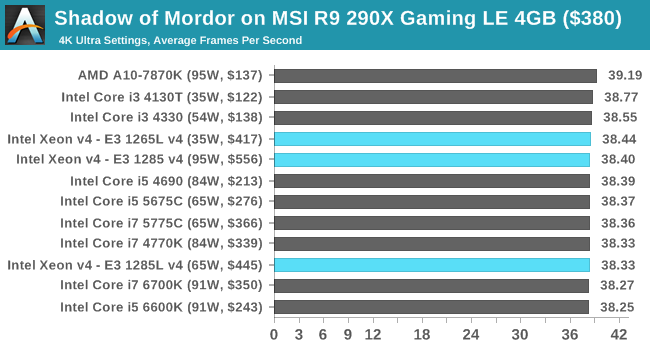
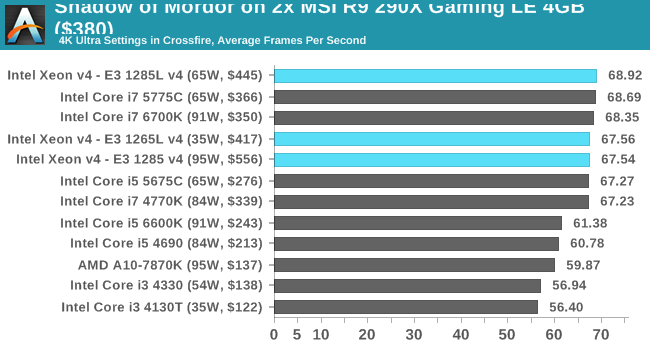
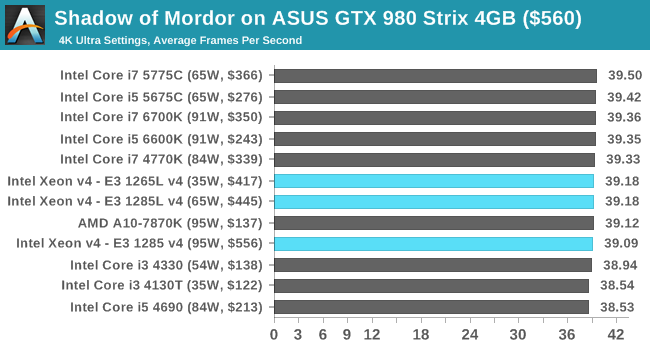
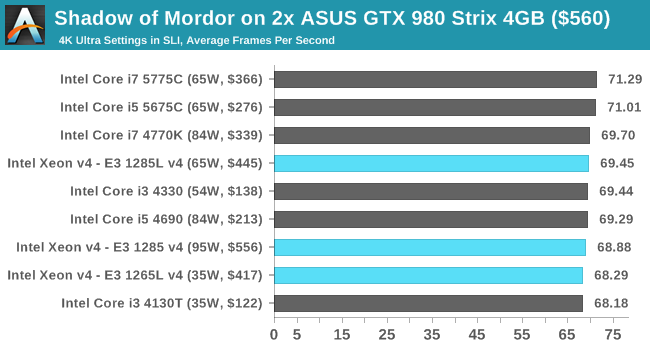
The final title in our testing is another battle of system performance with the open world action-adventure title, Shadow of Mordor. Produced by Monolith using the LithTech Jupiter EX engine and numerous detail add-ons, SoM goes for detail and complexity to a large extent, despite having to be cut down from the original plans. The main story itself was written by the same writer as Red Dead Redemption, and it received Zero Punctuation’s Game of The Year in 2014.
For testing purposes, SoM gives a dynamic screen resolution setting, allowing us to render at high resolutions that are then scaled down to the monitor. As a result, we get several tests using the in-game benchmark. For low end graphics we examine at 720p with low settings, whereas mid and high end graphics get 1080p Ultra. The top graphics test is also redone at 3840x2160, also with Ultra settings, and we also test two cards at 4K where possible.


72 Comments
View All Comments
Urizane - Wednesday, August 26, 2015 - link
The R7 240 used on that page isn't exactly fast. Actually, the A10 APU has more graphics hardware than that card, which shows in the results. The fact that Crystal Well parts can beat an A10 APU means that they also beat the R7 240.As far as the 4770R comparison goes, it seems I'm coming up with nothing useful from a quick search. Anandtech has numbers for the 4770R and numbers for the 5675C, but in none of the same benchmarks. Iris Pro 5200 (4770R) had 40 EUs that could turbo to 1.3 GHz and Iris Pro P6300 (E3-1285* v4) has 48 EUs that can turbo to 1.15 GHz (same for 5775C and 1.1 GHz for 5675C). I would think it would be a wash (some wins, some losses) between the two generations, but you're right. There would be some utility in having some hard numbers to compare the two.
alefsin - Wednesday, August 26, 2015 - link
I wish you also included e5-1630 v3 in your tests. It is slightly more expensive ($600 range I guess) but with 6 cores at 3.5 MHz is probably more attractive than the any of faster e3 series.tyger11 - Wednesday, August 26, 2015 - link
Yeah, that's the one I'm thinking about building my video workstation around, unless a 6 core skylake comes out soon.Mastadon - Thursday, August 27, 2015 - link
Skylake Xeons aren't due until 2017.JesseKramer - Wednesday, August 26, 2015 - link
According to Ark the e5-1630 v3 is a 4c8t part.http://ark.intel.com/products/82764/Intel-Xeon-Pro...
alefsin - Thursday, August 27, 2015 - link
Oh, sorry, my bad. I meant E5-1650 V3. I recently built a workstation with that for CFD analysis. 140 W is bit high these days but then again, there is no argument about the performance.Gigaplex - Wednesday, August 26, 2015 - link
"but the main parallel we should be making is the 95W of the E3-1285 v4 and the E3-1276 v3 at 84W. The E3 has some extra frequency (peaks at 4 GHz) and extra L3 cache, but the Xeon has eDRAM."The E3 vs the Xeon? They're both E3 Xeons.
MrSpadge - Wednesday, August 26, 2015 - link
"If I were thinking from the point of view of the motherboard manufacturer, they are more likely to overvolt a Xeon processor to ensure that stability rather than deal with any unstable platforms"Ian, this would be a really really poor move & explanation. You are literally paying Intel for the guaranteed stability of the Xeon. the CPU tells the mainboard exactly which voltage it wants. If a mainboard maker gives it more than this on purpose, he's sabotaging either the TDP and power efficiency, or the performance. Neither is good and could easily lead to lawsuits in the US (because the product wouldn't perform as promised).
In any way, you should be able to check this! You can test on different boards, with different software. You can read out & report the voltages of the CPUs under different load conditions. You can log & report the average CPU clocks during those tests. One would think such information is interesting when we're seemingly confronted with 2 of 3 CPUs consuming far more than promised by Intel and performing really good for that TDP.
Morawka - Wednesday, August 26, 2015 - link
i wish you guys would start putting the i7 4790K in these Skylake/Broadwell Comparisons because the clock speed is identical to the 6770K.Comparing the 6770K to the 4770K is not fair because clock speeds are different.
Oxford Guy - Wednesday, August 26, 2015 - link
Anandtech refuses to include the AMD FX 8 core in its results charts and instead only includes weaker APUs.