The Intel Broadwell Xeon E3 v4 Review: 95W, 65W and 35W with eDRAM
by Ian Cutress on August 26, 2015 9:00 AM ESTIntel Broadwell Xeon E3 v4 Conclusions
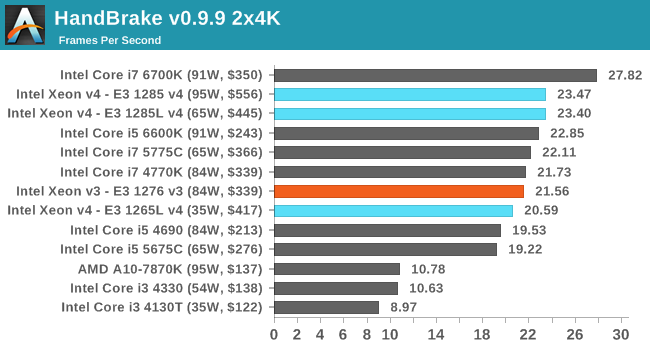
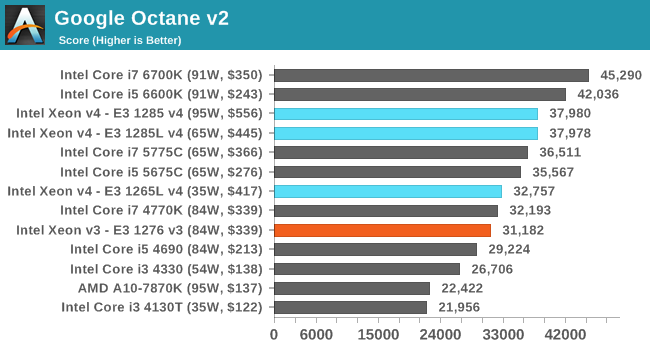
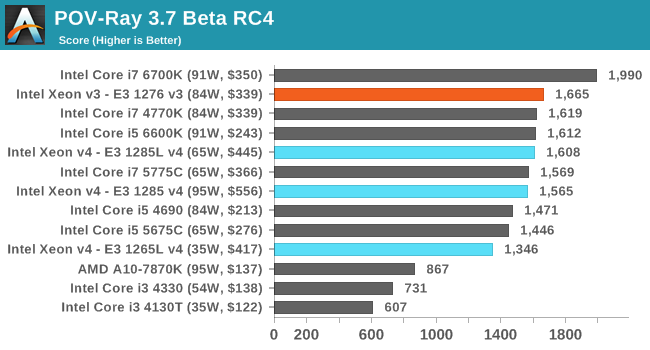
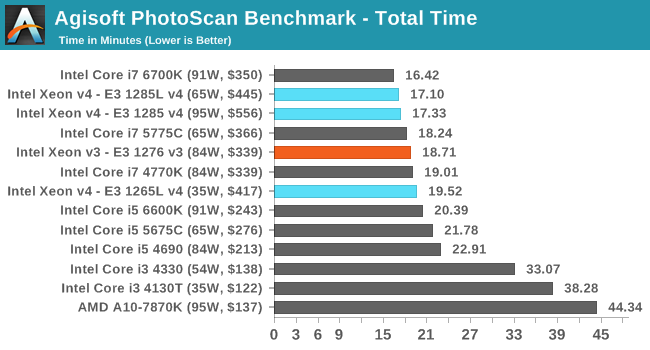
If you skipped to the end without looking at the benchmark data, we’re going to throw a few graphs in here for good measure.
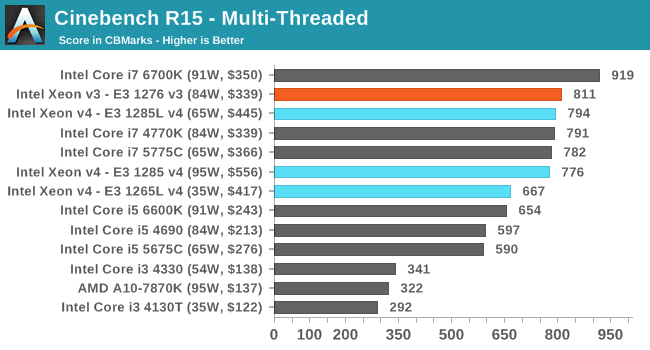
We said at the start of this review that one of the key parts to examine was the main parallel to the 95W of the E3-1285 v4 and the E3-1276 v3 at 84W due to their near similar (but not ideal) thermal design power metrics. The differentiator here is that the E3 v3 has some extra frequency, but the E3 v4 range has eDRAM.
At least, we thought this should be the battle to be had, but it is clear from the results that something else is more interesting. Comparing the E3-1285 v4 at 95W to its lower power variant, the E3-1285L v4 at 65W, we see that the low power variant scores better on almost all benchmarks.
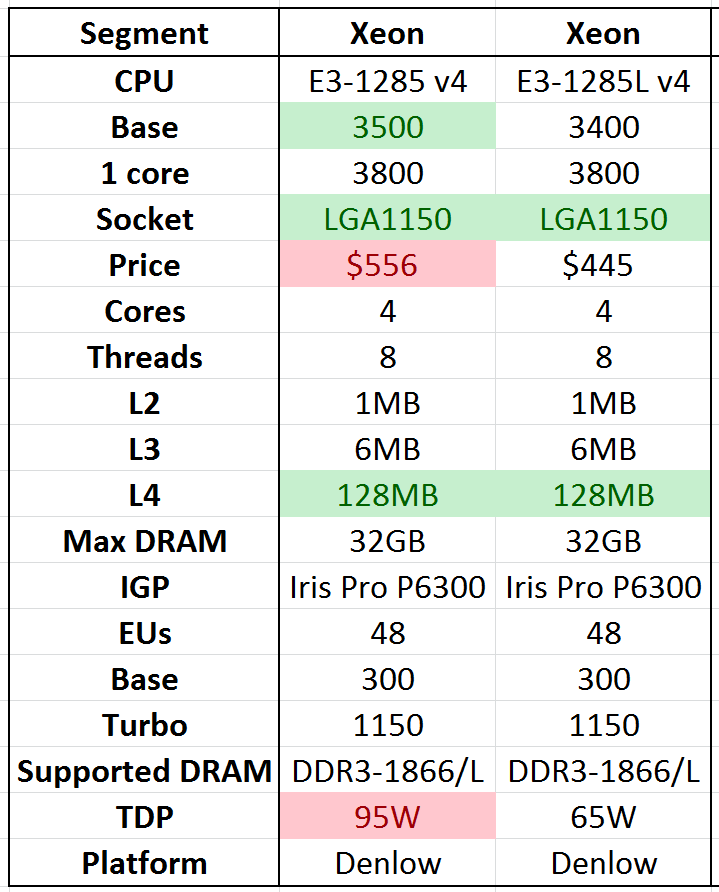
The only difference between these two processors aside from the 30W of TDP should be the 100 MHz gap in favor of the 95W part. We said at the beginning that this 100 MHz does not adequately explain 30W in the grand scheme of things, so the lower powered model must also have a substantially better voltage/frequency profile. This, as it happens, has some knock on side effects.
In a couple of CPU tests, the extra frequency wins. This boils down to only 3DPM and Sunspider, both tests that arguably are neither extensively pressing the processor nor exhaustive in their capabilities. But the lower power model, by virtue of the better binning, is able to keep its higher frequency turbo mode available for 100% of the time in our testing, ultimately giving a higher frequency and completing work quicker. This is despite the base frequency of the E3-1285 v4 being higher, and alluding to a variable turbo frequency profile based on power draw. To cap it off, the E3-1285L v4 is also $111 cheaper. So when the two processors are put side-by-side, the decision is obvious. We would choose the E3-1285L v4 every time.
This means the title fight should be between the 65W E3-1285L v4 and the E3-1276 v3 at 84W. Here it gets a little more edgy – the v4 here is technically 100 MHz above the i7-5775C which we looked at in our last Broadwell review, and we get more into a performance/power based efficiency discussion based on the TDP difference than the 95W vs 84W discussion.

In DRAM heavy scenarios such as WinRAR, which requires a large amount of cache to retain dictionary compression tables, the benefits of the eDRAM are easy to see. Benchmarks on the integrated graphics also win out due to the Iris Pro P6300. For discrete graphics, the Broadwell parts certain win over the v3 for efficiency at this point, with results between the two being almost identical. But the big one to note here is Photoscan in pure CPU mode, where Broadwell takes a minor lead – Photoscan uses a set of fifty two-dimensional photos with no depth information to create a three-dimensional imagine over several stages, so managing that data around the memory subsystem becomes a handful when there are 40,000 data points per picture in flight. This benchmark was suggested to us by an archivist at a national library who uses it to recreate models of the artifacts in their storage for external examination.
For all the other CPU tests, a dichotomy appears. The higher frequency v3 wins for compute driven performance, but data driven metrics (and efficiency) are the realm of Broadwell, Xeon or otherwise, as long as there is frequency to match.
As mentioned on the first page of the review, on the suggestion of a number of our readers and based on these interesting, we are looking into other avenues which are also data driven. Previously our Chrome compilation benchmark was a featured set piece in our testing, but has fallen away and a similar equivalent needs to be reintroduced. As a result, we are speaking to some users and looking into a series of tests of this nature that afford a repeatable and consistent point of analysis – ideally in an automated context if possible and encompassing a variety of projects and languages. At current there is no time framework for introduction, but September affords some time to focus on the project and then test a number of processors on it. Thoughts and suggestions should be forwarded to ian@anandtech.com.


72 Comments
View All Comments
imaheadcase - Wednesday, August 26, 2015 - link
Its the GPU the put on the CPU. I wonder why they don't have performance CPU without the GPU part. Gamers don't buy a CPU for the GPU since they have dedicated one already.Maybe im missing something, but seems like wasted space they could use for gamer orientated instructions.
MrSpadge - Wednesday, August 26, 2015 - link
The advantage of the 14 nm transistors is higher at lower voltages. The 6700K is so massively "overvolted" in stock mode, it's operating far above this sweet spot. That's why I would have loved to what those chips can achieve, regarding power consumption and efficiency, at ~4.0 GHz and minimum voltages. Alas, noone else seems to care about that. Most reviews are just showing full throttle operation. AT measured at lower OCs as well (thanks for that!), but apparently did not even try to go below 1.20 V either. That's higher than the stock voltage of Sandy Bridge..Oxford Guy - Wednesday, August 26, 2015 - link
High voltage overclocking is more likely to sell expensive products for cooling and has the added benefit of burning out chips, leading to even more sales.Ian Cutress - Thursday, August 27, 2015 - link
If you're burning out your processor by overclocking, you're doing it wrong.Oxford Guy - Wednesday, August 26, 2015 - link
The 4790K used more than 88 watts. That was marketing magic.typographie - Wednesday, August 26, 2015 - link
Average framerates don't really seem to tell us very much when seemingly every game tested is GPU-limited with an i5 or better. Would it be possible to post minimum framerates and/or frame time variance in future CPU gaming benchmarks? I suspect there would be more practically useful differences between CPUs in that data.MrSpadge - Wednesday, August 26, 2015 - link
Agreed - those benchmarks are pretty boring. Some website (forgot which one) showed minimum fps advantages of the 6700K to be massive (20 - 50%) for some games. This might be the more interesting metric.TallestJon96 - Wednesday, August 26, 2015 - link
I agree, give us average and either minimum or 99th percentile frame rates. Averages typically are GPU bound, but minimums are often more CPU heavy.I would prefer 99th percentile over minimum, as it is more consistent.
Ian Cutress - Thursday, August 27, 2015 - link
Our minimum results, on some benchmarks, seem to be all over the shot. It only takes one frame to drop a result down, which may or may not be inconsistent. We still have those values - check them over at anandtech.com/bench.In response to TallestJon96 below, I'm working on pulling 99th percentile data in a regular, consistent way.
satai - Wednesday, August 26, 2015 - link
I would be pretty interested in some compilation benchmarks - does cache trumph frequency?