Micron M600 (128GB, 256GB & 1TB) SSD Review
by Kristian Vättö on September 29, 2014 8:00 AM ESTRandom Read/Write Speed
The four corners of SSD performance are as follows: random read, random write, sequential read and sequential write speed. Random accesses are generally small in size, while sequential accesses tend to be larger and thus we have the four Iometer tests we use in all of our reviews.
Our first test writes 4KB in a completely random pattern over an 8GB space of the drive to simulate the sort of random access that you'd see on an OS drive (even this is more stressful than a normal desktop user would see). We perform three concurrent IOs and run the test for 3 minutes. The results reported are in average MB/s over the entire time.
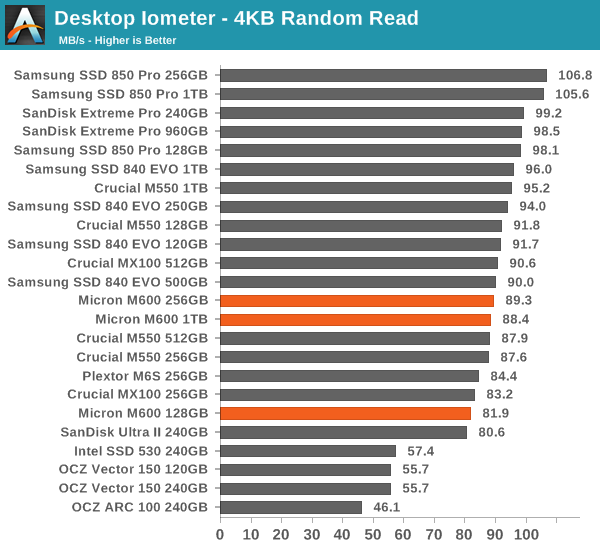
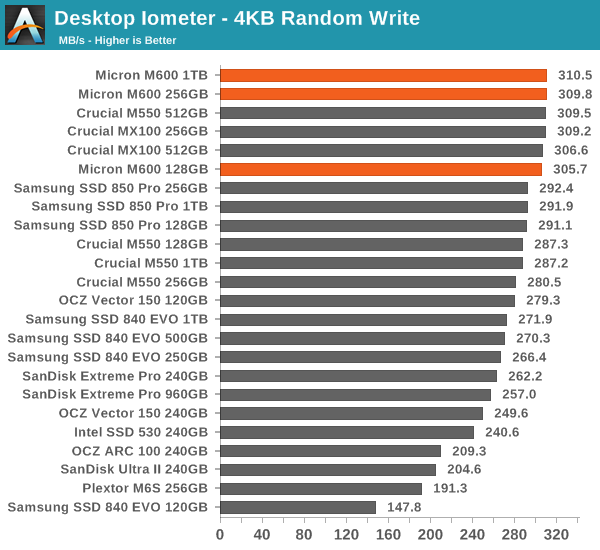
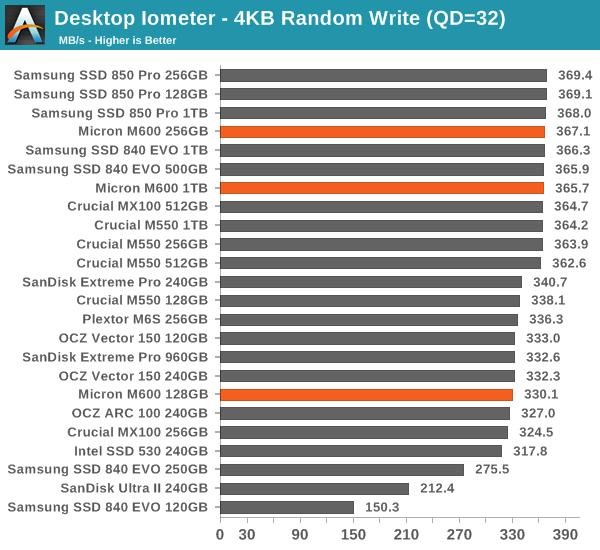
Random performance remains more or less unchanged from the MX100 and M550. Micron has always done well in random performance as long as the IOs are of bursty nature, but Micron's performance consistency under sustained workloads has never been top notch.
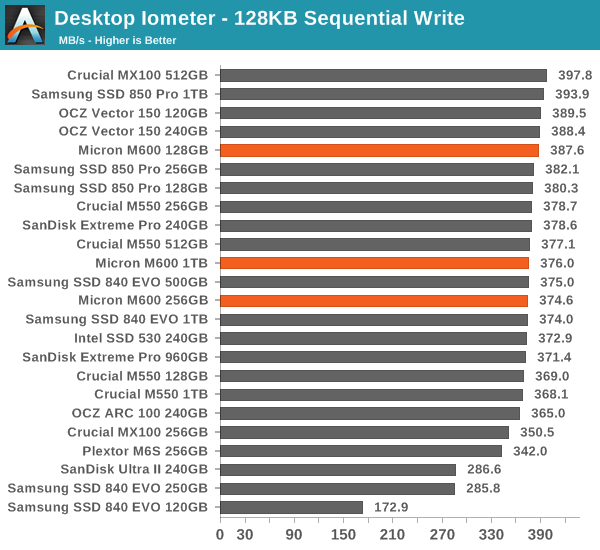
Sequential Read/Write Speed
To measure sequential performance we run a 1 minute long 128KB sequential test over the entire span of the drive at a queue depth of 1. The results reported are in average MB/s over the entire test length.
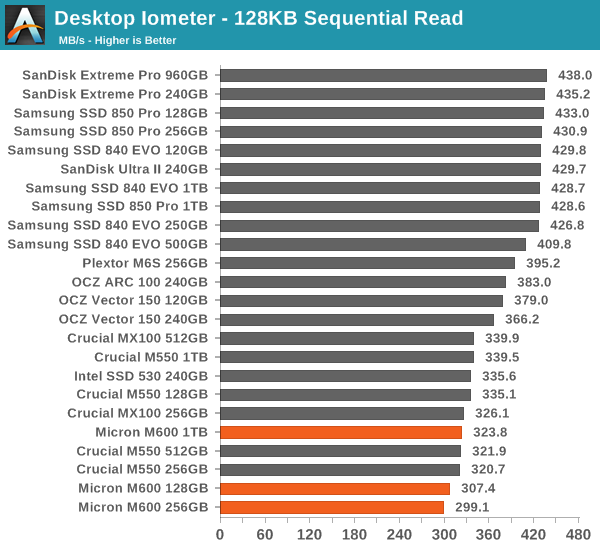
Sequential write performance sees a minor increase at smaller capacities thanks to Dynamic Write Acceleration, but aside from that there is nothing surprising in sequential performance.
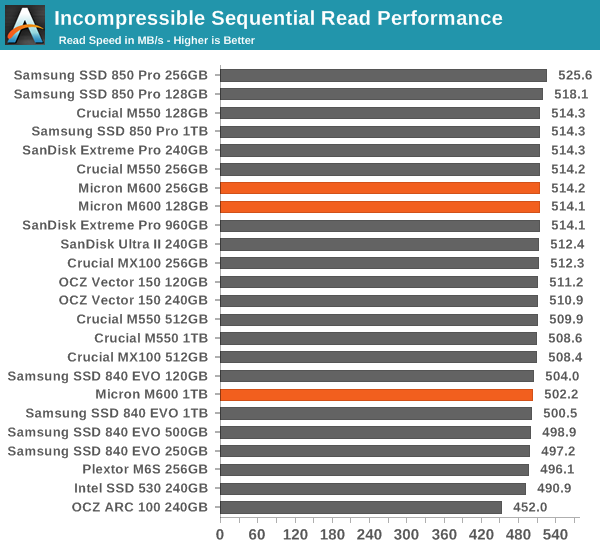
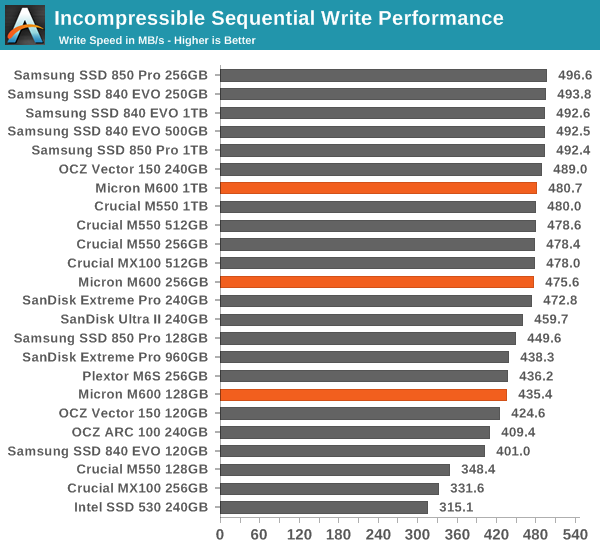
AS-SSD Incompressible Sequential Read/Write Performance
The AS-SSD sequential benchmark uses incompressible data for all of its transfers. The result is a pretty big reduction in sequential write speed on SandForce based controllers, but most other controllers are unaffected.


56 Comments
View All Comments
Kristian Vättö - Monday, September 29, 2014 - link
I thought I had that there, but looks like I forgot to add it in a hurry. Anyway, I've added it now :)MarcHFR - Tuesday, September 30, 2014 - link
Shodanshok,In fact DWA is not better for endurance, it's worst.
- Writting random writes in sequential form is already done on all SSD by write combining.
- DWA increase write amplification since the data is first wrote in "SLC" mode then rewrote in "MLC mode".
For 2 bit of data :
- 2 cells are used for SLC mode
- then 1 cell is used for MLC mode
vs
- 1 cell is used for MLC mode w/o DWA
Since write speed is rarely a problem in daily usage and since there is counterpart, i don't understand the positive reception for TurboWrite, nCache 2, Dynamic Write Acceleration, etc...
shodanshok - Tuesday, September 30, 2014 - link
Hi,it really depends on how the Write Acceleration is implemented. While it is true that badly designed WA caches can have a bad effect of flash endurance, a good designed one (and under a favorable workload) can lessen the load on the flash as a whole.
Micron is not discussing their pSLC implementation in detail, so let speak about Sandisk NCache which is more understood at the moment.
NCache works by reserving a fixed amount of NAND die to pSLC. This pSLC slice, while built on top of MLC cells, is good for, say, 10X the cycles of standard MLC (so ~30.000 cycles). The reason is simple: by using them as SLC, you have much higher margin for voltage drop.
Now, lets follow a write down to the flash. When a write arrive to the disk, it places the new data to the pSLC array. After that we have two possibilities:
1. no new write for the same LBA arrives in short time, so the pSLC array is flushed to the main MLC portion. Total writes with WA: 2 (1 pSLC / 1 MLC) - without WA: 1 (MLC)
2. if a new write is recorder for the same LBA _before_ the pSLC array is flushed, the new write will overwrite the data stored in the pSLC portion. After some idle time, the pSLC array is flushed to the MCL one. Total writes with WA: 3 (2 pSLC / 1 MLC) - without WA: 2 (MLC)
In the rewrite scenario (n.2) the MLC portion see only a single write vs the two MLC writes of the no-WA drive. While it is true that the pSLC portion sustain increased stress, its longevity is much longer than the main MLC array so it should not be a problem is their cycles are "eaten" faster. On the other hand, the MLC array is much more prone to flash wearing, so any decrease in writes are very welcomed.
This rewrite behavior is the exact reason behind SanDisk's quoted write amplification number, which is only 0.8: without Write Acceleration, a write amplification less then 1.0 can be achieved only using come compression/deduplication scheme.
Regards.
MarcHFR - Tuesday, September 30, 2014 - link
As you said it's really depend on the workload for nCache 2, write vs rewrite.But another point of view is that for example a 120 GB Ultra II with 5 GB nCache 2.0 could be a 135 GB Ultra II without NAND die reserved to nCache 2.0.
shodanshok - Tuesday, September 30, 2014 - link
True, but rewrite is quite pervasive.For example, any modern, journaled filesystem will constantly rewrite an on-disk circular buffer.
Databases use a similar concept (double-write) with another on-disk circular buffer.
The swapfile is constantly rewritten
...
Anyway, it surely remain a matter of favorable vs unfavorable workload.
Regards.
Cerb - Tuesday, September 30, 2014 - link
Only some FSes, usually with non-default settings, will double-write any file data, though. What most do is some form of meta-data journaling, where new writes preferably go into free space (one more reason not to fill your drives all the way up!), and the journal logs the writing of the new state. But, the data itself is not in the journal. EXT3/4 can be set write twice, but don't by default. NTFS, JFS, and XFS, among others, simply don't have such a feature at all. So, the additional writing is pretty minimal, being just metadata. You're not likely to be writing GBs/day to the FS journal.Databases generally should write everything twice, though, so that they never are in an unrecoverable state, if the hardware is functioning correctly.
AnnonymousCoward - Monday, September 29, 2014 - link
I have yet to get an answer to this question: what's the point of doing purely synthetic and relative-performance tests, and how does that tell the reader the tangible difference of these drives?You don't test video cards in terms of IOPS or how fast they pound through a made-up suite. You test what matters: fps.
You also test what matters for CPUs: encoding time, gaming fps, or CAD filter time.
With phones, you test actual battery time or actual page loading time.
With SSDs, why would you not test things like how fast Windows loads, program load time, and time to transfer files? That matters more than any of the current tests! Where am I going wrong, Kristian?
Kristian Vättö - Monday, September 29, 2014 - link
Proper real world testing is subject to too many variables to be truly reproducible and accurate. Testing Windows boot time and app load time is something that can be done, but the fact is that in a real world scenario you will be having more than one app running at a time and a countless number of Windows background processes. Once more variables are introduced to the test, the results become less accurate unless all variables can be accurately measured, which cannot really be done (at least not without extensive knowledge of Windows' architecture).The reasoning is the same as to why we don't test real-time or multiplayer gaming performance. It's just that the test scenarios are not fully reproducible unless the test is scripted to run the exact same scenario over and over again (like the built-in game benchmarks and our Storage Benches).
That said, I've been working on making our Storage Bench data more relevant to real world usage and I already have a plan on how to do that. It won't change the limitations of the test (it's still trace-based with no TRIM available, unfortunately), but I hope to present the data in a way that is more relevant than just pure MB/s.
AnnonymousCoward - Tuesday, September 30, 2014 - link
Thanks for your reply.You said it yourself: boot time and app load time can be done. These are 2 of the top 5 reasons people buy SSDs. To get around the "uncontrolled" nature, just do multiple trials and take the average.
Add a 3rd test: app load time while heavy background activity is going on, such as copying a 5GB file to an HDD.
4th test: IrfanView batch conversion; time to re-save 100 JPEG files.
All of those can be done on a fresh Windows install with minimal variables.
AnnonymousCoward - Tuesday, September 30, 2014 - link
To expand on my 3rd test: kick off a program that scans your hard drive (like anti-spyware or anti-virus) and then test app load time.You might be overestimating the amount of disk transfers that go on during normal computer usage. Right now, for example, I've got 7 programs open, and task manager shows 0% CPU usage on all 4 cores. It takes the same time to launch any app now as when I have 0 other programs open. So I think the test set I described would be quite representative of real life, and a massive benefit over what you're currently testing.