SanDisk X300s (512GB) Review
by Kristian Vättö on August 21, 2014 2:15 PM ESTAnandTech Storage Bench 2013
Our Storage Bench 2013 focuses on worst-case multitasking and IO consistency. Similar to our earlier Storage Benches, the test is still application trace based – we record all IO requests made to a test system and play them back on the drive we are testing and run statistical analysis on the drive's responses. There are 49.8 million IO operations in total with 1583.0GB of reads and 875.6GB of writes. I'm not including the full description of the test for better readability, so make sure to read our Storage Bench 2013 introduction for the full details.
| AnandTech Storage Bench 2013 - The Destroyer | ||
| Workload | Description | Applications Used |
| Photo Sync/Editing | Import images, edit, export | Adobe Photoshop CS6, Adobe Lightroom 4, Dropbox |
| Gaming | Download/install games, play games | Steam, Deus Ex, Skyrim, Starcraft 2, BioShock Infinite |
| Virtualization | Run/manage VM, use general apps inside VM | VirtualBox |
| General Productivity | Browse the web, manage local email, copy files, encrypt/decrypt files, backup system, download content, virus/malware scan | Chrome, IE10, Outlook, Windows 8, AxCrypt, uTorrent, AdAware |
| Video Playback | Copy and watch movies | Windows 8 |
| Application Development | Compile projects, check out code, download code samples | Visual Studio 2012 |
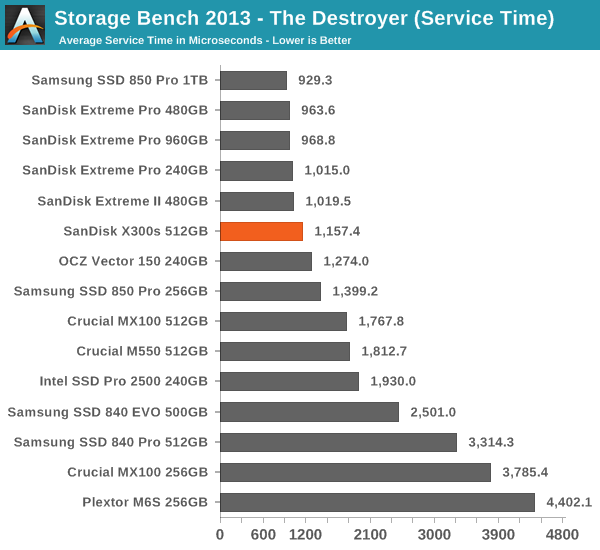
We are reporting two primary metrics with the Destroyer: average data rate in MB/s and average service time in microseconds. The former gives you an idea of the throughput of the drive during the time that it was running the test workload. This can be a very good indication of overall performance. What average data rate doesn't do a good job of is taking into account response time of very bursty (read: high queue depth) IO. By reporting average service time we heavily weigh latency for queued IOs. You'll note that this is a metric we have been reporting in our enterprise benchmarks for a while now. With the client tests maturing, the time was right for a little convergence.
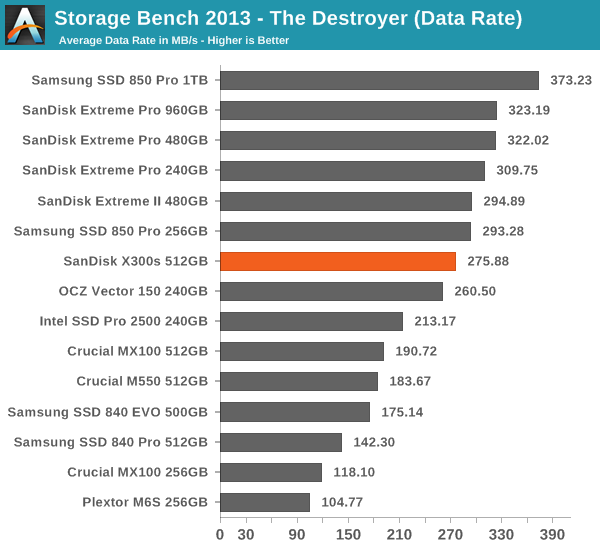
Due to the lower over-provisioning, the X300s ends up being slightly slower than the Extreme Pro and Extreme II. Still, the X300s is a solid performer and faster than e.g. Intel's SSD Pro 2500, which is Intel's offering to the business market. Ultimately the 850 Pro is the fastest SED on the market but the X300s provides a more complete set of features with the inclusion of Wave's EMBASSY Security Control.


34 Comments
View All Comments
Death666Angel - Tuesday, August 26, 2014 - link
I'm totally not getting the new drop down menus in the consistency part of the review. I only get one set of data points in the chart even though I can select 2 (different) items. It changes whether I change the first or second part. Can someone explain what it shows me when?doylecc - Tuesday, August 26, 2014 - link
The drop down menus in the consistency part of the review are not working properly. The only way I could make the charts show the performance of the 25% over-provisioning was to choose another SSD from the menu (I chose the A-Data since it is right next to the X300) then change back to the X300. When I did that the chart would update.I had to repeat with the default over-provisioning menu to get the chart to change back. This is a pain and needs to be corrected!
Kristian Vättö - Wednesday, August 27, 2014 - link
I've noticed that too. Let me see if there is something we can do to fix it -- my HTML skills are limited to copy-pasting so I need to ask someone else to have a look at the code.Gonemad - Wednesday, August 27, 2014 - link
I wonder if encryption would affect deduplication in any kind of setup. As far as I know, repeatable patterns that can be compressed are exactly the thing that encryption prevents, and any deduplication effort must happen before the drive is encrypted. Will encryption ALWAYS be transparent?