MSI Z97 Guard-Pro Review: Entry Level Z97 at $110
by Ian Cutress on August 20, 2014 6:00 AM EST- Posted in
- Motherboards
- Intel
- MSI
- Z97
System Benchmarks
Power Consumption
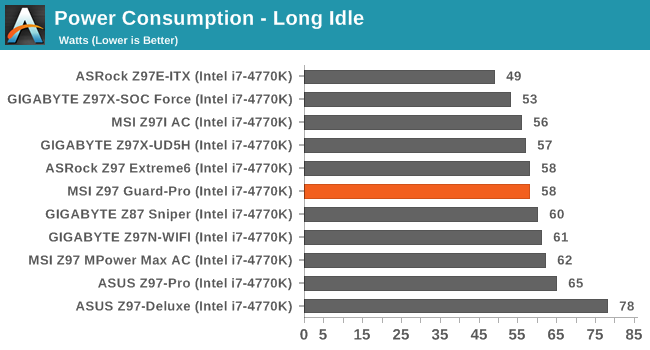
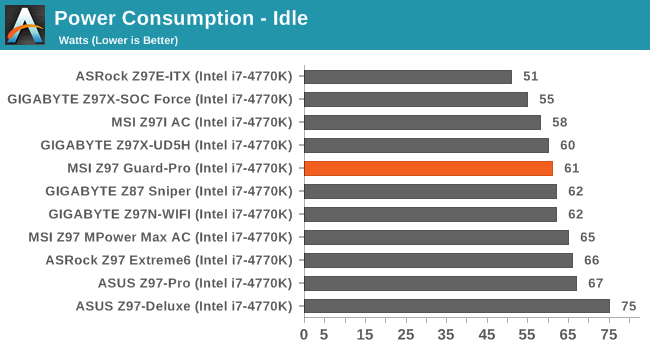
Power consumption was tested on the system while in a single MSI GTX 770 Lightning GPU configuration with a wall meter connected to the OCZ 1250W power supply. This power supply is Gold rated, and as I am in the UK on a 230-240 V supply, leads to ~75% efficiency > 50W, and 90%+ efficiency at 250W, suitable for both idle and multi-GPU loading. This method of power reading allows us to compare the power management of the UEFI and the board to supply components with power under load, and includes typical PSU losses due to efficiency. These are the real world values that consumers may expect from a typical system (minus the monitor) using this motherboard.
While this method for power measurement may not be ideal, and you feel these numbers are not representative due to the high wattage power supply being used (we use the same PSU to remain consistent over a series of reviews, and the fact that some boards on our test bed get tested with three or four high powered GPUs), the important point to take away is the relationship between the numbers. These boards are all under the same conditions, and thus the differences between them should be easy to spot.
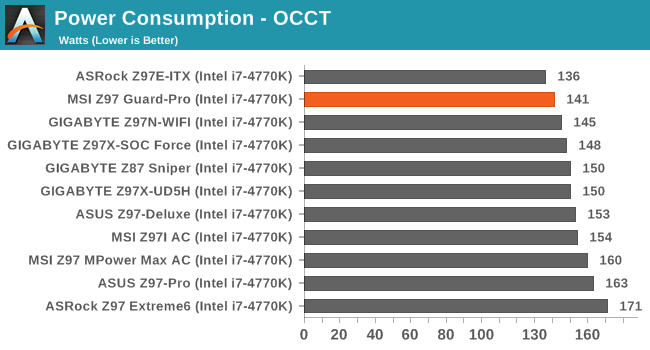
141W for full load gives the Z97 Guard-Pro a good result.
Windows 7 POST Time
Different motherboards have different POST sequences before an operating system is initialized. A lot of this is dependent on the board itself, and POST boot time is determined by the controllers on board (and the sequence of how those extras are organized). As part of our testing, we look at the POST Boot Time using a stopwatch. This is the time from pressing the ON button on the computer to when Windows 7 starts loading. (We discount Windows loading as it is highly variable given Windows specific features.)
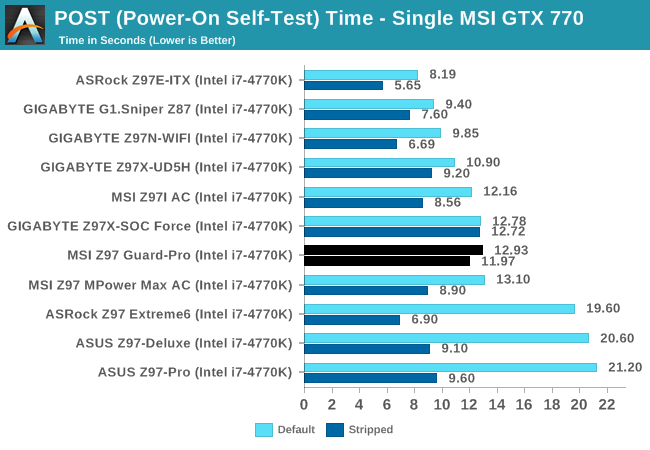
We still have an odd scenario with Z97 being reasonably high with POST times on average. With Intel’s 8-series, 12 seconds was a good benchmark; the Z97-Guard Pro ran 13 seconds at standard and 12 seconds when stripped.
Rightmark Audio Analyzer 6.2.5
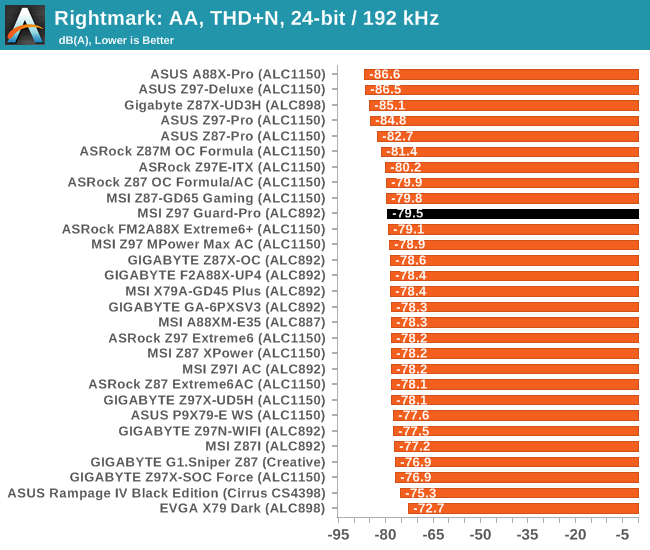
Rightmark:AA indicates how well the sound system is built and isolated from electrical interference (either internally or externally). For this test we connect the Line Out to the Line In using a short six inch 3.5mm to 3.5mm high-quality jack, turn the OS speaker volume to 100%, and run the Rightmark default test suite at 192 kHz, 24-bit. The OS is tuned to 192 kHz/24-bit input and output, and the Line-In volume is adjusted until we have the best RMAA value in the mini-pretest. We look specifically at the Dynamic Range of the audio codec used on board, as well as the Total Harmonic Distortion + Noise.
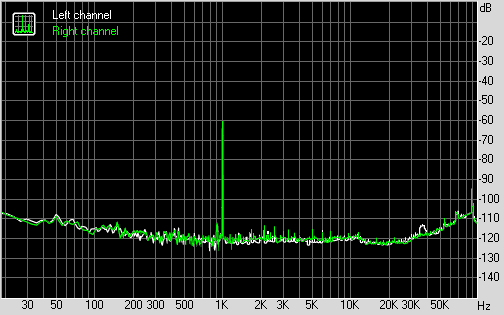
Dynamic Range of the Z97 Guard-Pro
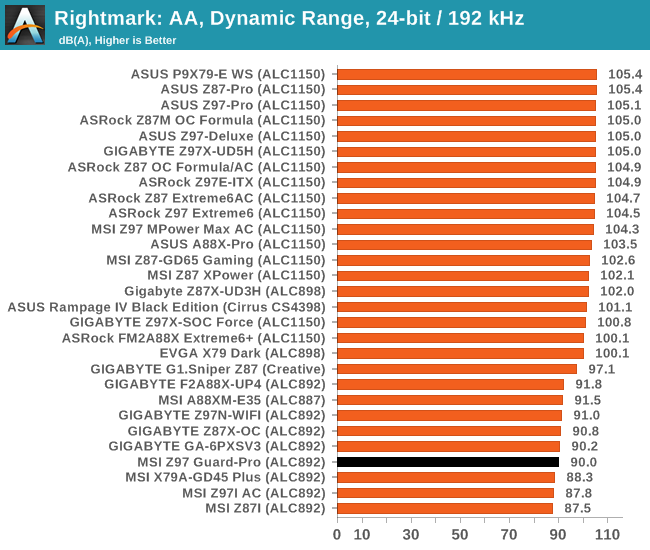
The ALC892 codec is not the best of Realtek’s lineup, and on the Z97 Guard-Pro it does not perform to the best of its ability in the dynamic range, which seems to be a common issue on MSI motherboards.
USB Backup
For this benchmark, we transfer a set size of files from the SSD to the USB drive using DiskBench, which monitors the time taken to transfer. The files transferred are a 1.52 GB set of 2867 files across 320 folders – 95% of these files are small typical website files, and the rest (90% of the size) are small 30 second HD videos. In an update to pre-Z87 testing, we also run MaxCPU to load up one of the threads during the test which improves general performance up to 15% by causing all the internal pathways to run at full speed.
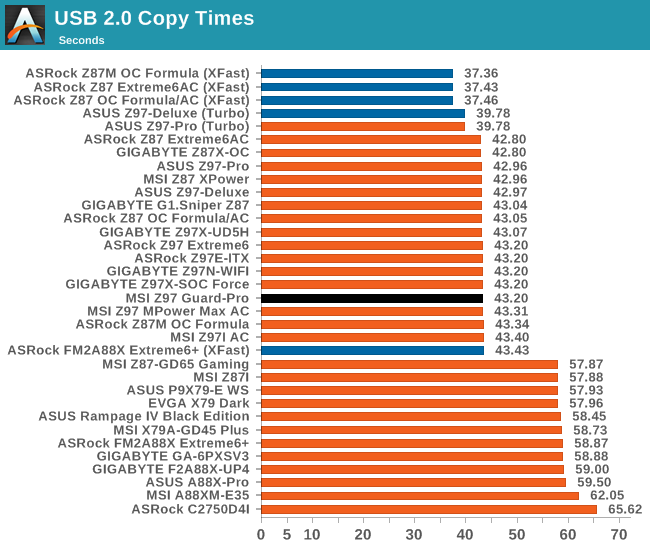
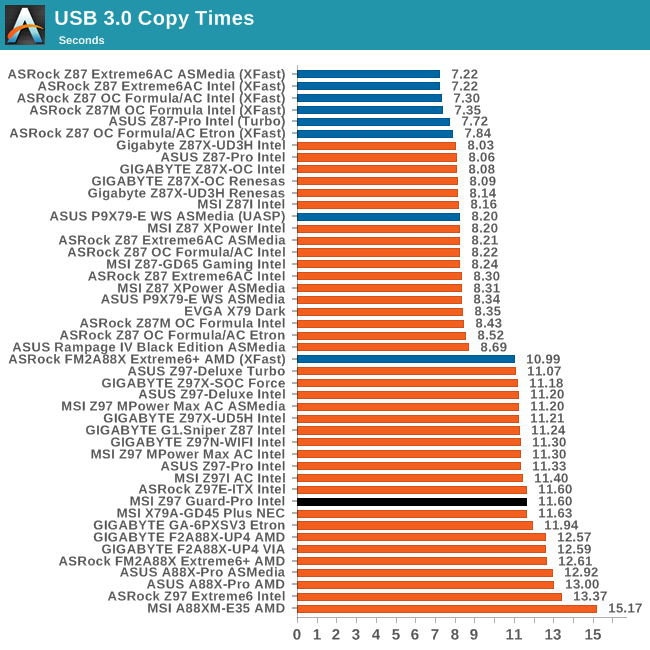
With a lower cost motherboard one might expect a regression in performance against the high end, but in the USB performance graphs at least, the MSI Z97 Guard-Pro is in the mix witht he other Z97 motherboards.
DPC Latency
Deferred Procedure Call latency is a way in which Windows handles interrupt servicing. In order to wait for a processor to acknowledge the request, the system will queue all interrupt requests by priority. Critical interrupts will be handled as soon as possible, whereas lesser priority requests such as audio will be further down the line. If the audio device requires data, it will have to wait until the request is processed before the buffer is filled.
If the device drivers of higher priority components in a system are poorly implemented, this can cause delays in request scheduling and process time. This can lead to an empty audio buffer and characteristic audible pauses, pops and clicks. The DPC latency checker measures how much time is taken processing DPCs from driver invocation. The lower the value will result in better audio transfer at smaller buffer sizes. Results are measured in microseconds.
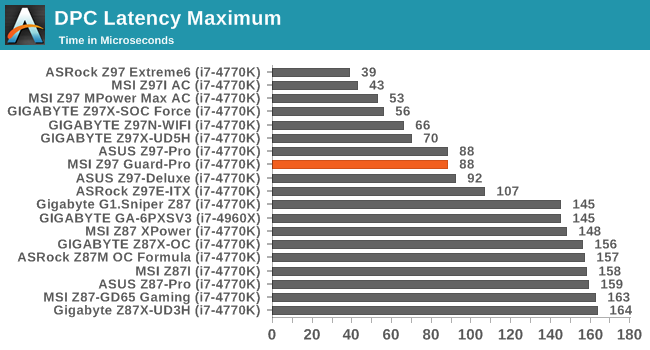
DPC Latency with Intel’s 9-series continues to be a positive feature of the chipset with the Guard-Pro scoring under 100 microseconds.


41 Comments
View All Comments
Etherion - Sunday, February 19, 2017 - link
What a disappointment. Got this MB with a pcie 1to3 switch with the hope of running 8 gpus on it. Sadly it can't handle more than 7. Once I plug in the 8th GPU regardless of configuration it can't boot past bios splash screen. So the cheap asrock h97 anniversary is better.