Free Cooling: the Server Side of the Story
by Johan De Gelas on February 11, 2014 7:00 AM EST- Posted in
- Cloud Computing
- IT Computing
- Intel
- Xeon
- Ivy Bridge EP
- Supermicro
How We Tested
To determine the optimal point between data center temperature and system cooling performance, we created a controlled temperature testing environment, called a "HotBox". Basically, we placed a server inside an insulated box. The box consists of two main layers: at the bottom is the air inlet where a heating element is placed. The hot air is blown inside the box and is then sucked into the front of the server on the second layer. This way we can simulate that inlet air comes from below, as in most data centers. Inlet and outlet are separated and insulated from each other, simulating the hot and cold aisles. Two thermistors measure the temperature of the inlet, one on the right and on the left, just behind the front panel.
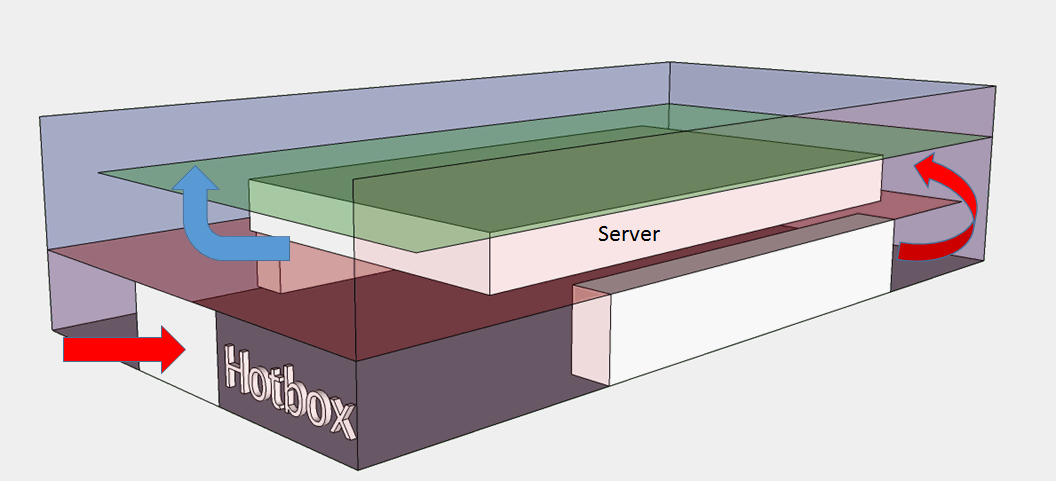
Just behind the motherboard, close to back of the server, a pair of thermistors monitors the outlet temperature. And we'd like to thank Wannes De Smet who designed the hotbox!
The servers is fed by a standard European 230V (16 Amps max.) power line. We use the Racktivity ES1008 Energy Switch PDU to measure power consumption. Measurement circuits of most PDUs assume that the incoming AC is a perfect sine wave, but it never is. However, the Rackitivity PDU measures true RMS current and voltage at a very high sample rate: up to 20,000 measurements per second for the complete PDU.
Datamining on Hardware
Building the "Hotbox" was one thing; getting all the necessary data on the other hand is a serious challenge. A home-made PCB collects the data of the thermistors. Our vApus stress testing software interfaces with ESXi to collect hardware usage counters and temperatures; fan speeds are collected from the BMC; and power numbers from the Racktivity PDU. This is all done while placing a realistic load on the ESXi virtual machines. The excellent programming work of Dieter of the Sizing Servers Lab resulted in a large amount of data in our Excel sheets.
To put a realistic load on the machine we use our own real-life load generator called vApus. With vApus we capture real user interaction with a website, add some parameters that can be randomized, and then replay that log a number of times.
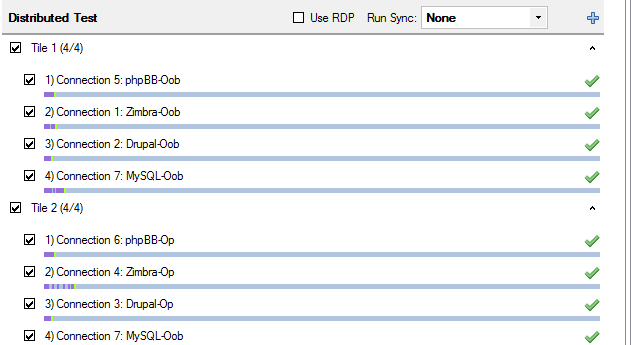
The workload consists of four VMs:
- Drupal LAMP VM running sizingservers.be website
- Zimbra 8 VM
- phpBB LAMP VM running clone of real website
- OLAP (news aggregator database)
The Drupal site gets regular site visitors mixed with the posting of new blog entries and sending email, resulting in a moderate system load. The Zimbra load is disk-intensive, consisting of users creating and sending emails, replying, creating appointments, tasks and contacts. The phpBB workload has a moderate CPU and network load, viewing and creating forum threads with rich content. Finally, the OLAP workload is based on queries from a news aggregator and is mostly CPU bound. These four VMS form one Tile (similar to VmMark "tiles"). We ran two tiles in each test, resulting in a load of 10% to 80%.


48 Comments
View All Comments
bobbozzo - Tuesday, February 11, 2014 - link
"The main energy gobblers are the CRACs"Actually, the IT equipment (servers & networking) use more power than the cooling equipment.
ref: http://www.electronics-cooling.com/2010/12/energy-...
"The IT equipment usually consumes about 45-55% of the total electricity, and total cooling energy consumption is roughly 30-40% of the total energy use"
Thanks for the article though.
JohanAnandtech - Wednesday, February 12, 2014 - link
That is the whole point, isn't it? IT equipment uses power to be productive, everything else is supporting the IT equipment and thus overhead that you have to minimize. From the facility power, CRACs are the most important power gobblers.bobbozzo - Tuesday, February 11, 2014 - link
So, who is volunteering to work in a datacenter with 35-40C cool aisles and 40-45C hot aisles?Thud2 - Wednesday, February 12, 2014 - link
80,0000, that's sounds like a lot.CharonPDX - Monday, February 17, 2014 - link
See also Intel's long-term research into it, at their New Mexico data center: http://www.intel.com/content/www/us/en/data-center...puffpio - Tuesday, February 18, 2014 - link
On the first page you mention "The "single-tenant" data centers of Facebook, Google, Microsoft and Yahoo that use "free cooling" to its full potential are able to achieve an astonishing PUE of 1.15-1."This article says that Facebook has a achieved a PUE of 1.07 (https://www.facebook.com/note.php?note_id=10150148...
lwatcdr - Thursday, February 20, 2014 - link
So I wonder when Google will build a data center in say North Dakota. Combine the ample wind power with cold and it looks like a perfect place for a green data center.Kranthi Ranadheer - Monday, April 17, 2017 - link
Hi Guys,Does anyone by chance have a recorded data of Temperature and processor's speed in a server room? Or can someone give me the information about the high-end and low-end values measured in any of the server rooms respectively, considering the equation temperature v/s processor's speed?