ASUS Maximus VI Impact Review: ROG and Mini-ITX
by Ian Cutress on November 22, 2013 10:00 AM ESTComputational Benchmarks
Readers of our motherboard review section will have noted the trend in modern motherboards to implement a form of MultiCore Enhancement / Acceleration / Turbo (read our report here) on their motherboards. This does several things – better benchmark results at stock settings (not entirely needed if overclocking is an end-user goal), at the expense of heat and temperature, but also gives in essence an automatic overclock which may be against what the user wants. Our testing methodology is ‘out-of-the-box’, with the latest public BIOS installed and XMP enabled, and thus subject to the whims of this feature. It is ultimately up to the motherboard manufacturer to take this risk – and manufacturers taking risks in the setup is something they do on every product (think C-state settings, USB priority, DPC Latency / monitoring priority, memory subtimings at JEDEC). Processor speed change is part of that risk which is clearly visible, and ultimately if no overclocking is planned, some motherboards will affect how fast that shiny new processor goes and can be an important factor in the purchase.
For reference, the Maximus VI Impact in this review did enable MCT during the benchmarks.
Point Calculations - 3D Movement Algorithm Test
The algorithms in 3DPM employ both uniform random number generation or normal distribution random number generation, and vary in various amounts of trigonometric operations, conditional statements, generation and rejection, fused operations, etc. The benchmark runs through six algorithms for a specified number of particles and steps, and calculates the speed of each algorithm, then sums them all for a final score. This is an example of a real world situation that a computational scientist may find themselves in, rather than a pure synthetic benchmark. The benchmark is also parallel between particles simulated, and we test the single thread performance as well as the multi-threaded performance.
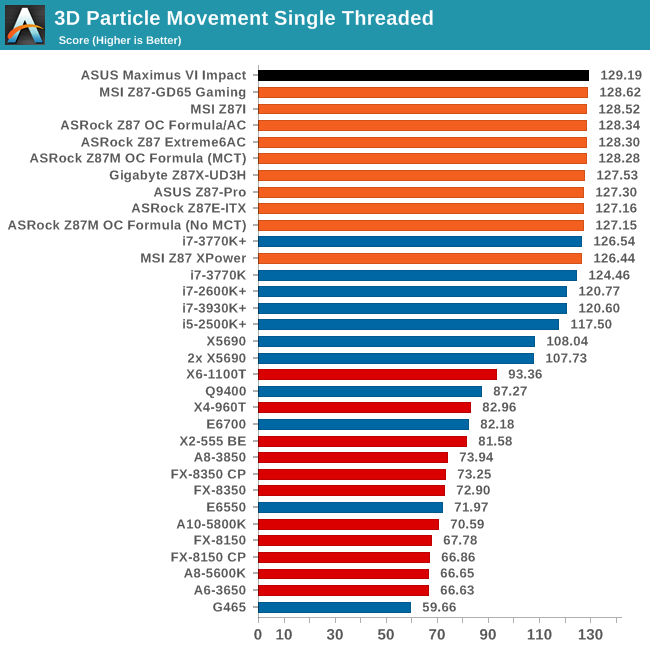
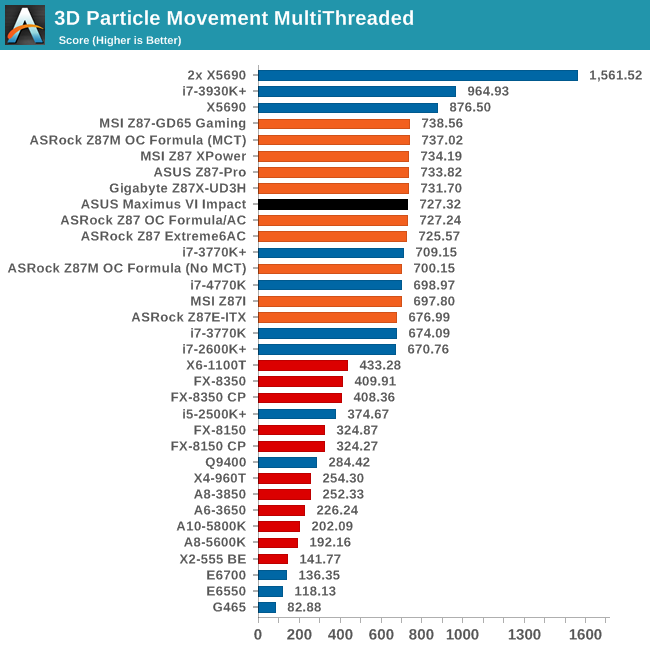
For single threaded optimization of FP calculations, the M6I seems to be right on the money. Multithreaded seems to be middle of the field in 3DPM.
Compression - WinRAR 4.2
With 64-bit WinRAR, we compress the set of files used in the USB speed tests. WinRAR x64 3.93 attempts to use multithreading when possible, and provides as a good test for when a system has variable threaded load. WinRAR 4.2 does this a lot better! If a system has multiple speeds to invoke at different loading, the switching between those speeds will determine how well the system will do.
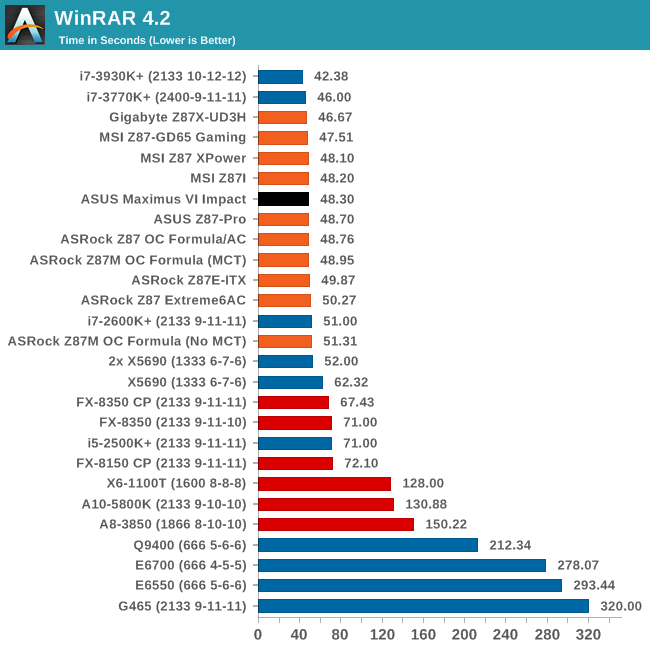
WinRAR also comes across midfield, with similar times to the Z87 Pro.
Image Manipulation - FastStone Image Viewer 4.2
FastStone Image Viewer is a free piece of software I have been using for quite a few years now. It allows quick viewing of flat images, as well as resizing, changing color depth, adding simple text or simple filters. It also has a bulk image conversion tool, which we use here. The software currently operates only in single-thread mode, which should change in later versions of the software. For this test, we convert a series of 170 files, of various resolutions, dimensions and types (of a total size of 163MB), all to the .gif format of 640x480 dimensions.
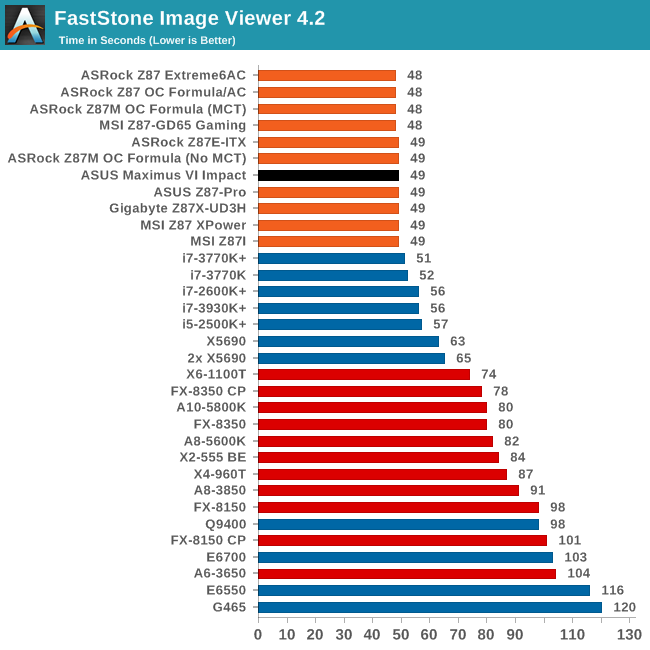
Every Z87 motherboard seems to score either 48 or 49 seconds in FastStone, and the M6I is no different.
Video Conversion - Xilisoft Video Converter 7
With XVC, users can convert any type of normal video to any compatible format for smartphones, tablets and other devices. By default, it uses all available threads on the system, and in the presence of appropriate graphics cards, can utilize CUDA for NVIDIA GPUs as well as AMD WinAPP for AMD GPUs. For this test, we use a set of 33 HD videos, each lasting 30 seconds, and convert them from 1080p to an iPod H.264 video format using just the CPU. The time taken to convert these videos gives us our result.
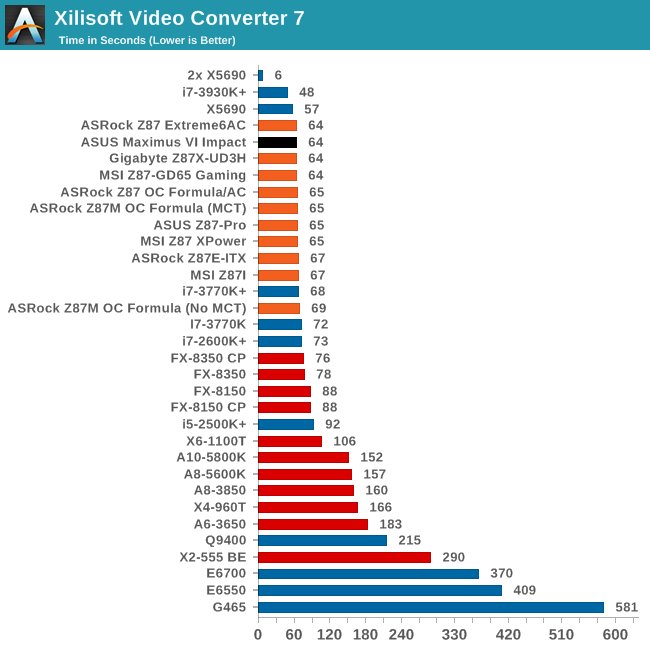
ASUS is in the leading pack around 64 seconds for XVC.
Video Conversion - x264 HD Benchmark
The x264 HD Benchmark uses a common HD encoding tool to process an HD MPEG2 source at 1280x720 at 3963 Kbps. This test represents a standardized result which can be compared across other reviews, and is dependent on both CPU power and memory speed. The benchmark performs a 2-pass encode, and the results shown are the average of each pass performed four times.
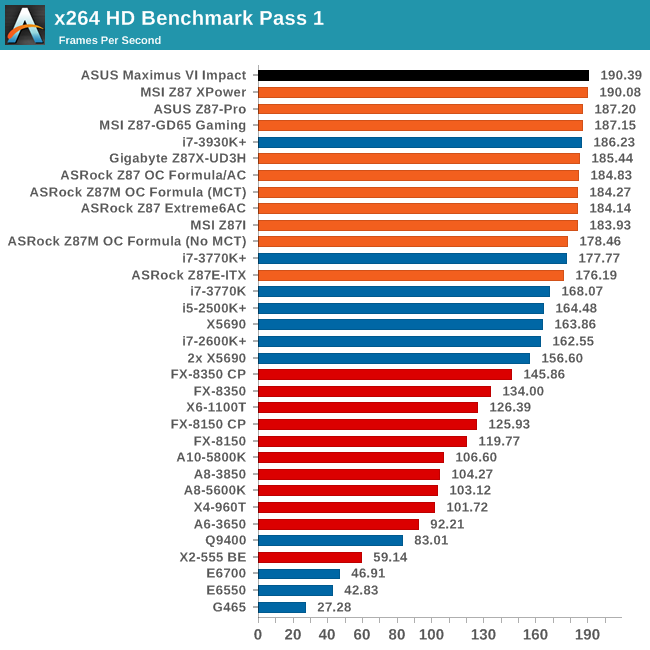
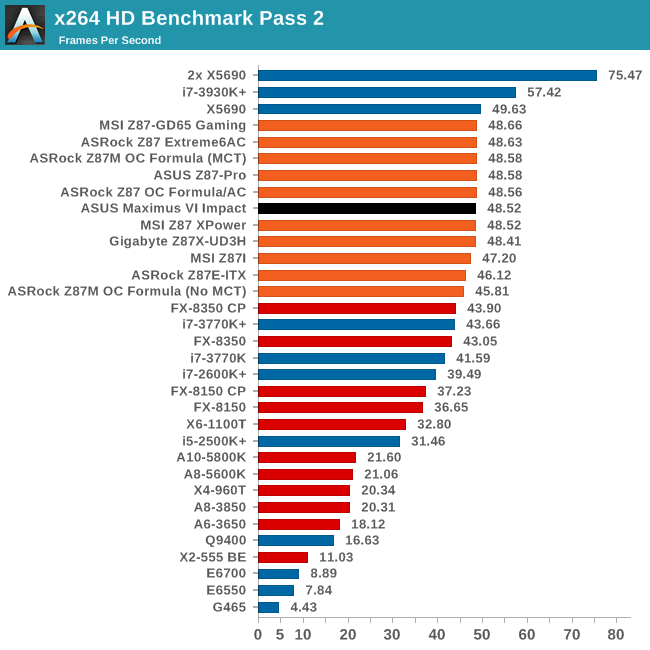
There still seems to be some room at the top in the first pass, with the M6I taking the crown. The second pass seems to have hit an asymptotic limit around 48.6 FPS for the 4770K.
Grid Solvers - Explicit Finite Difference
For any grid of regular nodes, the simplest way to calculate the next time step is to use the values of those around it. This makes for easy mathematics and parallel simulation, as each node calculated is only dependent on the previous time step, not the nodes around it on the current calculated time step. By choosing a regular grid, we reduce the levels of memory access required for irregular grids. We test both 2D and 3D explicit finite difference simulations with 2n nodes in each dimension, using OpenMP as the threading operator in single precision. The grid is isotropic and the boundary conditions are sinks. Values are floating point, with memory cache sizes and speeds playing a part in the overall score.
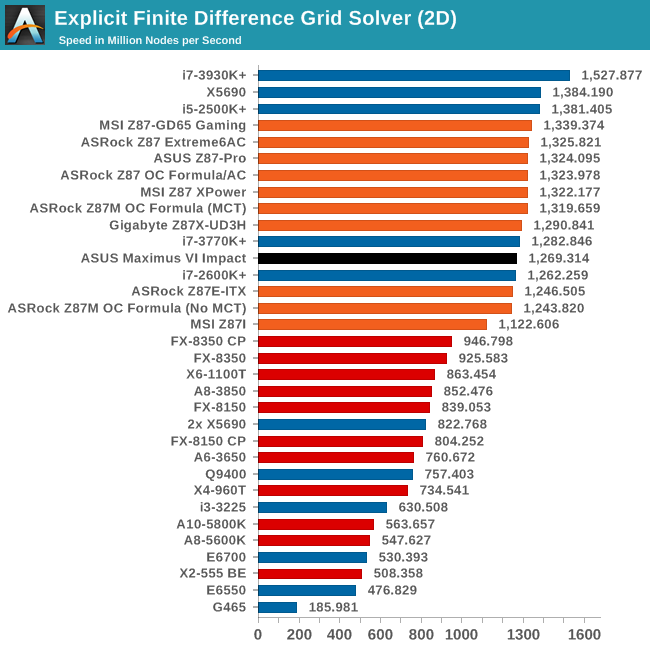
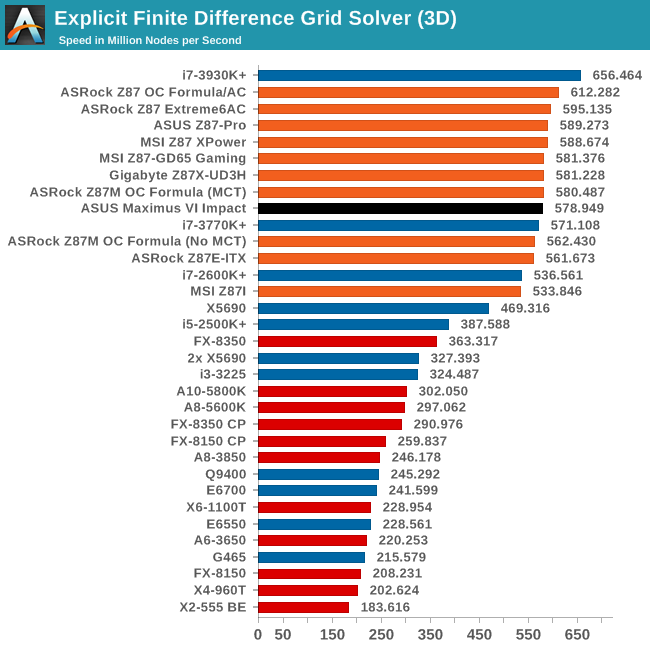
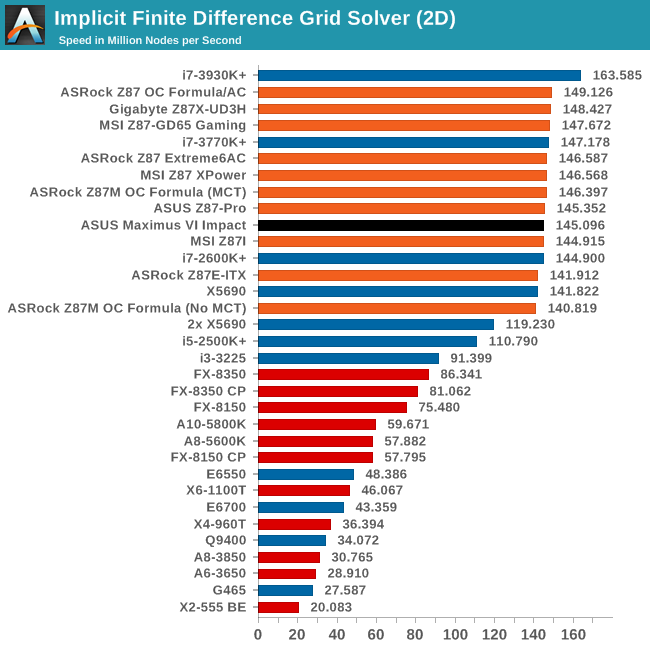
The M6I seems to hit a rough patch with our Ex-FD simulations, 2D being particularly affected.
Grid Solvers - Implicit Finite Difference + Alternating Direction Implicit Method
The implicit method takes a different approach to the explicit method – instead of considering one unknown in the new time step to be calculated from known elements in the previous time step, we consider that an old point can influence several new points by way of simultaneous equations. This adds to the complexity of the simulation – the grid of nodes is solved as a series of rows and columns rather than points, reducing the parallel nature of the simulation by a dimension and drastically increasing the memory requirements of each thread. The upside, as noted above, is the less stringent stability rules related to time steps and grid spacing. For this we simulate a 2D grid of 2n nodes in each dimension, using OpenMP in single precision. Again our grid is isotropic with the boundaries acting as sinks. Values are floating point, with memory cache sizes and speeds playing a part in the overall score.
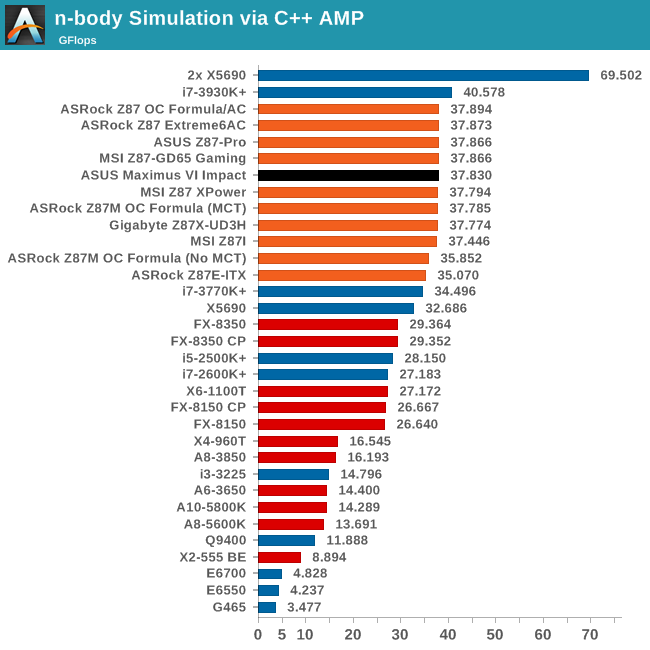
Point Calculations - n-Body Simulation
When a series of heavy mass elements are in space, they interact with each other through the force of gravity. Thus when a star cluster forms, the interaction of every large mass with every other large mass defines the speed at which these elements approach each other. When dealing with millions and billions of stars on such a large scale, the movement of each of these stars can be simulated through the physical theorems that describe the interactions. The benchmark detects whether the processor is SSE2 or SSE4 capable, and implements the relative code. We run a simulation of 10240 particles of equal mass - the output for this code is in terms of GFLOPs, and the result recorded was the peak GFLOPs value.


69 Comments
View All Comments
chaosbloodterfly - Saturday, November 23, 2013 - link
20% in power would require that you at least have dual sli 760 or crossfire 7870 set up to meet the lower 20%, triple setups of 780/titan or new r9 290/290x for the top range. absolute top would require dual xeon 12 core and triple crossfire r9 290x in a massive case to handle the extra loops and radiator/resevoir needed to cool that beastly of a system and reign in noise. for the top crown you'd need a cosmos II or 950d sized mini fridge case to handle it all.That's more like the top 1%...
chrnochime - Sunday, November 24, 2013 - link
Top 20% means 19%-20% too, so any single 770/780/290/290X will do. There's a large performance delta between 10%->5%, and another huge jump from 5% to 1%. Remember that just because the percentage increases by 5% does NOT mean the performance delta increases by just as little.chrnochime - Sunday, November 24, 2013 - link
And please, tri-fire and tri-sli? At the very top 1% it's either quad-SLI/quadfire or go home. You want to sound you're all that, at least put in the effort LOLAlienwarez5678 - Wednesday, December 11, 2013 - link
I am pretty happy with my Fractal node 304 with an Impact board, 16Gb ram, 3 SSD drives and a GTX780TI at the moment runs everything.nichismo - Monday, April 14, 2014 - link
uh no.can it do SLI? quad channel memory? can you add a raid controller? not to mention any sub PCI, PCIe or mPCIe oriented expansion device with a GPU installed?
didnt think so.
dcoca - Friday, January 9, 2015 - link
I know this is an old post, both I have this board and also the x99 platform.. gaming and 3dMark both platforms are the same in performance, and score 93 percent above the restZak - Tuesday, December 17, 2013 - link
Anyone who thinks computers (any other inanimate objects) are sexy, needs help.anactoraaron - Friday, November 22, 2013 - link
I hate being 'that guy', but what's up with no Nexus 5 review?A5 - Friday, November 22, 2013 - link
Brian and Anand do all the phone reviews. Bug them about it on twitter if you want, but Ian probably isn't going to be able to answer that.anactoraaron - Friday, November 22, 2013 - link
That's right. Sorry about that (to Ian). To the twitters I go...