Intel SSD 530 (240GB) Review
by Kristian Vättö on November 15, 2013 1:45 PM EST- Posted in
- Storage
- SSDs
- Intel
- Intel SSD 530
Random Read/Write Speed
The four corners of SSD performance are as follows: random read, random write, sequential read and sequential write speed. Random accesses are generally small in size, while sequential accesses tend to be larger and thus we have the four Iometer tests we use in all of our reviews.
Our first test writes 4KB in a completely random pattern over an 8GB space of the drive to simulate the sort of random access that you'd see on an OS drive (even this is more stressful than a normal desktop user would see). I perform three concurrent IOs and run the test for 3 minutes. The results reported are in average MB/s over the entire time. We use both standard pseudo randomly generated data for each write as well as fully random data to show you both the maximum and minimum performance offered by SandForce based drives in these tests. The average performance of SF drives will likely be somewhere in between the two values for each drive you see in the graphs. For an understanding of why this matters, read our original SandForce article.
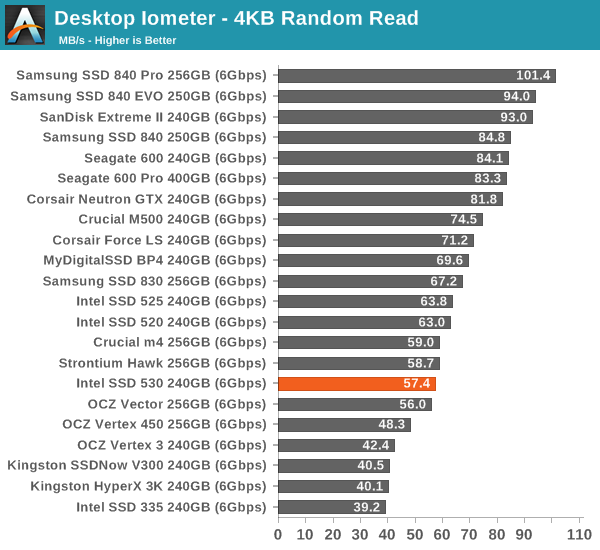
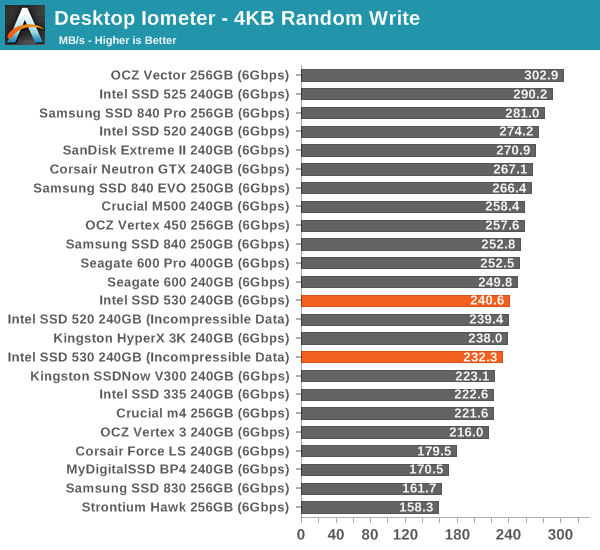
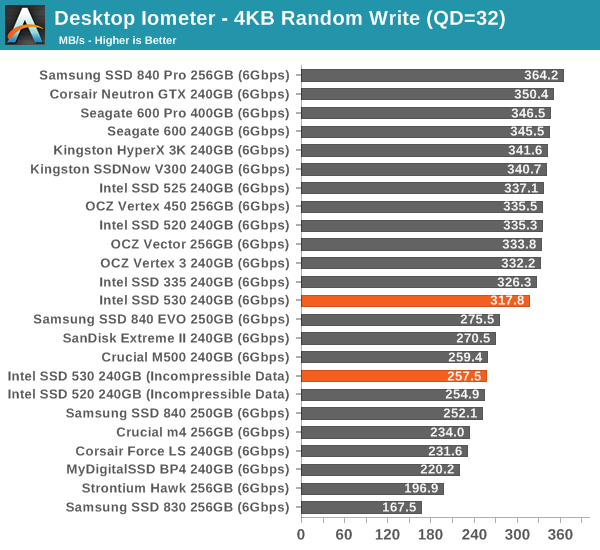
Random speeds are slightly down from SSD 520/525. The decrease could be NAND related as it's a fact that read and program times go up as we move to smaller lithographies, which will then translate to decrease in overall performance. However, compared to the SSD 335 performance is better but we're dealing with a higher bin of IMFT's 20nm NAND, so that's not a surprise.
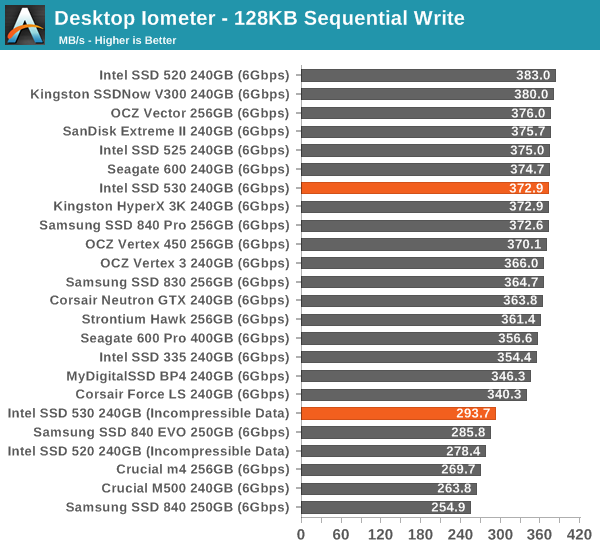
Sequential Read/Write Speed
To measure sequential performance I ran a 1 minute long 128KB sequential test over the entire span of the drive at a queue depth of 1. The results reported are in average MB/s over the entire test length.
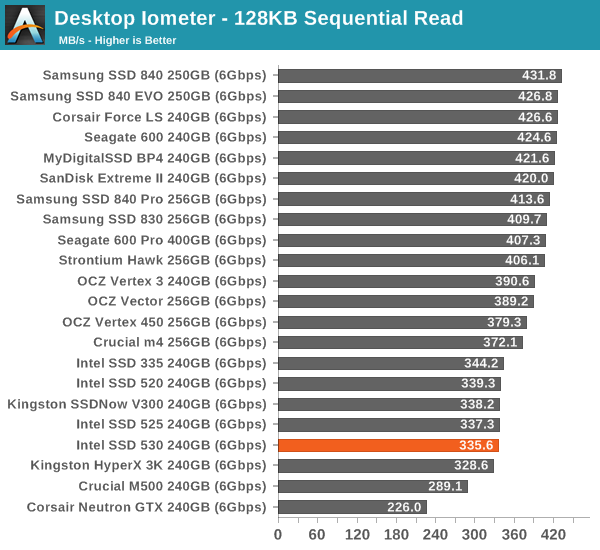
Read performance has never been one of SandForce's biggest strengths but write performance is top of the class (except when dealing with incompressible data).
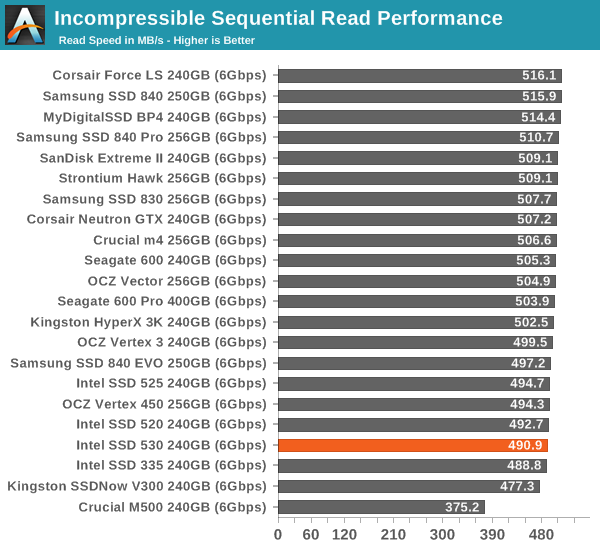
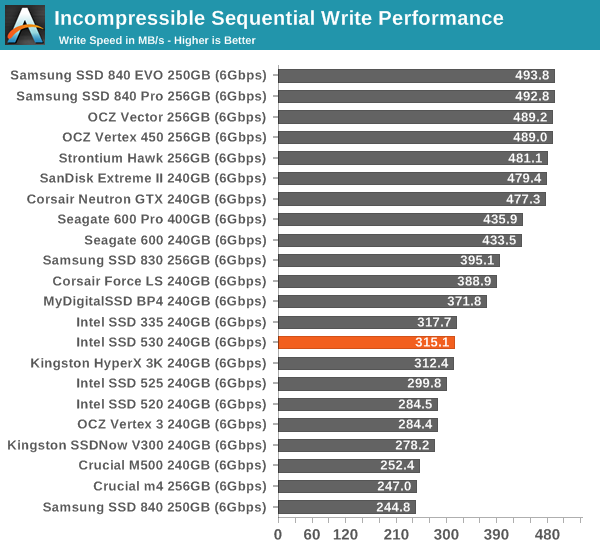
AS-SSD Incompressible Sequential Read/Write Performance
The AS-SSD sequential benchmark uses incompressible data for all of its transfers. The result is a pretty big reduction in sequential write speed on SandForce based controllers.


60 Comments
View All Comments
AnnonymousCoward - Monday, November 18, 2013 - link
I enjoyed the review, but why can't you have a single real world benchmark??? You compare CPUs based on the time it takes to encode/decode, and fps in games. That tells readers the quantified difference. Your SSD data tells the reader nothing about Windows startup time, file copy time, and program load time. This has been an overlook on Anandtech from Day 1. I've brought this up multiple times in these comments, but you guys somehow don't get it.dhisumdhisum - Tuesday, November 19, 2013 - link
Debroah, will you marry me? I don't work, I am a bum.dac7nco - Tuesday, November 19, 2013 - link
Greatest reply ever.Bullwinkle J Moose - Saturday, November 23, 2013 - link
Technically, that was a proposal...The reply has not yet been given
Tjalve - Wednesday, November 20, 2013 - link
I have actually don that kind of testing. But i use 20min idle time.http://www.nordichardware.se/SSD-Recensioner/svens...
The text is in swedish so use google translate to translate to english. But scroll down and qlik on the links.
But check the diffrence between test 6 and 7 in the graphs.
nicolaim - Wednesday, November 27, 2013 - link
MyDigitalSSD sells M.2 SSDs at retail, so saying M.2 SSDs are OEM-only is incorrect.mi1stormilst - Friday, December 6, 2013 - link
The Intel 530 is $169.99 on newegg today ... tack on the 10% discount code floating around (NAFSAVETENDEC6W) for newegg and you have a bargain at $155.98 shipped!!!PKR - Sunday, December 8, 2013 - link
With my Macbook pro Mid 2010, and Intel 530 240gb with DC12 firmware, I think this ssd is slow - I am only getting about 200 mbps write and 260 mbps read speed. Very disappointed, as I the reviews online pointed to speeds in the range of 500 mbps.I tried the installation two ways - one by cloning the system partition using carbon copy cloner, and another using a fresh install from super-drive and updating .. In both cases, speed didn't change.
If it matters, I have 4 partitions on the drive. The system partition is of size 100gb, with about 40gb free space after migrating my content.
Wolfpup - Monday, December 16, 2013 - link
I switched from Intel to Micron/Crucial after Intel switched to Sandforce controllers...I'd still pick this over OTHER sandforce drives, but I'm still picking an M500 over this...