Choosing a Gaming CPU October 2013: i7-4960X, i5-4670K, Nehalem and Intel Update
by Ian Cutress on October 3, 2013 10:05 AM ESTCPU Benchmarks
Point Calculations - 3D Movement Algorithm Test
The algorithms in 3DPM employ both uniform random number generation or normal distribution random number generation, and vary in various amounts of trigonometric operations, conditional statements, generation and rejection, fused operations, etc. The benchmark runs through six algorithms for a specified number of particles and steps, and calculates the speed of each algorithm, then sums them all for a final score. This is an example of a real world situation that a computational scientist may find themselves in, rather than a pure synthetic benchmark. The benchmark is also parallel between particles simulated, and we test the single thread performance as well as the multi-threaded performance.
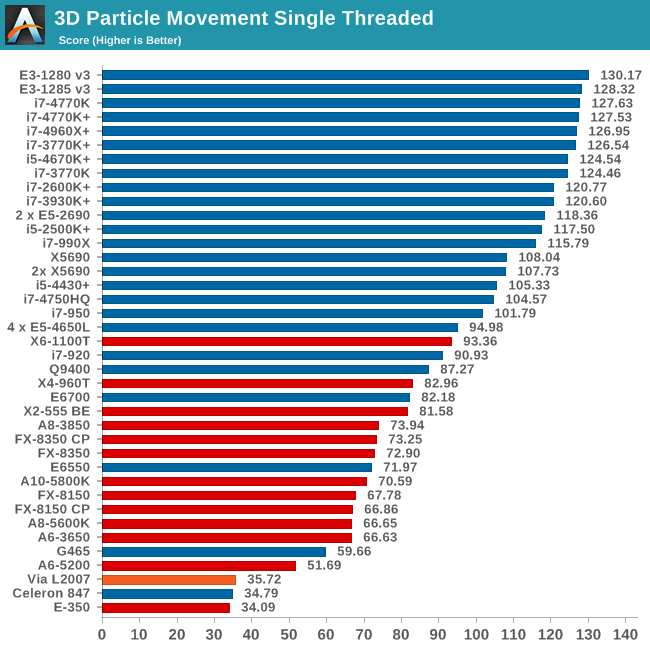
For single thread performance, the higher MHz Haswell CPUs sit on top of the list - interestingly enough it is the Xeons. Comparing these to the i7-4960X, which also sits at 4 GHz, shows the generational difference in this purely multithreaded test. The 100 MHz difference between the i5-4670K and the i7-4770K shows up as two points in this test. The s1366 CPUs are staggered between a score of 90.93 and 115.79, with the i7-920 falling short of the X6-1100T. Due to the IPC difference the i7-990X is behind the i5-2500K and anything older at a similar MHz.
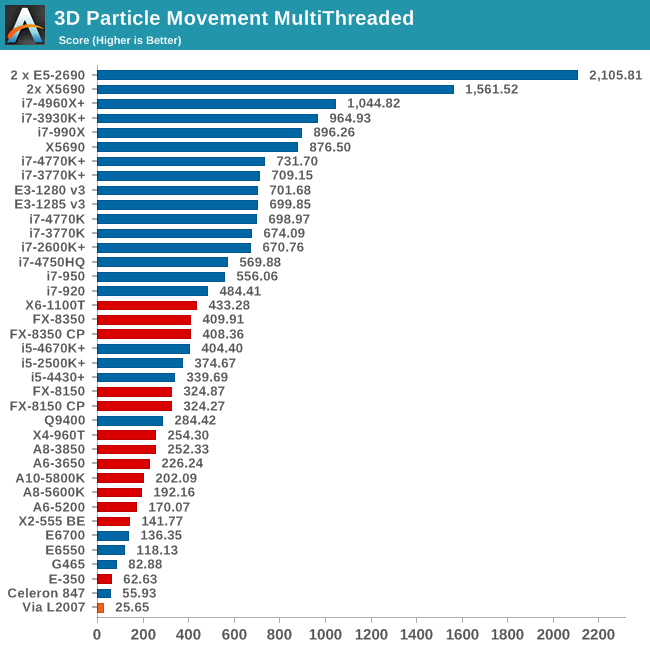
For the multithreaded test, cores and MHz with FP performance win out here, so the i5-4670K, even in a motherboard with Multi-Core Turbo, sits behind the eight threads of the FX-8350 and six threads of the X6-1100T. The i7-4770K scores another 75%, along with the Xeons. In terms of the Nehalem CPUs, the i7-990X performs an extra 200 points higher than the latest Haswell CPUs due to its six core / twelve thread design. Unfortunately the i7-920/i7-950 are a little behind, with the i7-2600K offering a noticable boost.
Compression - WinRAR x64 3.93 + WinRAR 4.2
With 64-bit WinRAR, we compress the set of files used in the USB speed tests. WinRAR x64 3.93 attempts to use multithreading when possible, and provides as a good test for when a system has variable threaded load. WinRAR 4.2 does this a lot better! If a system has multiple speeds to invoke at different loading, the switching between those speeds will determine how well the system will do.
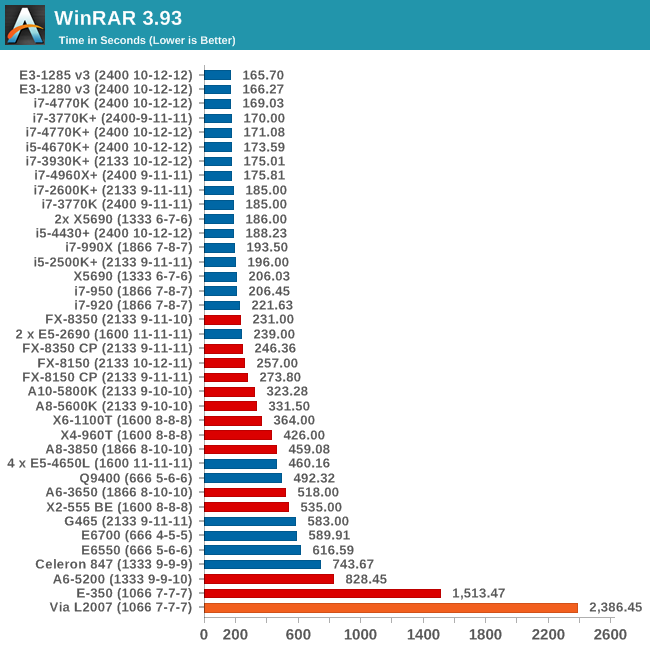
The only downside with WinRAR is that when you're dealing with slow CPUs, they are very slow! The quad core Nehalem CPUs are kept on track by the FX-8350 using this older version of WinRAR, although it seems the higher IPC wins out here over cores with the 4.0 GHz Haswell Xeons scoring best.
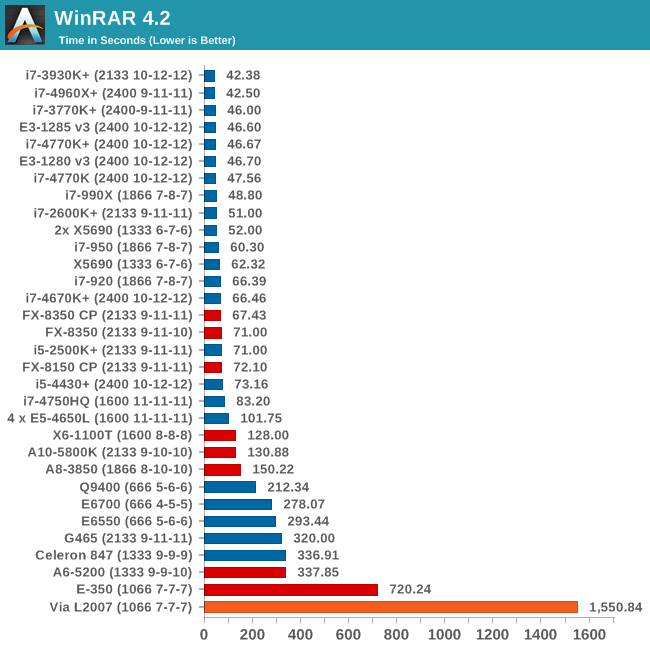
The improvements in WinRAR 4.2 due to optimisations and multi-threading result in more cores giving better results. The i7-990X does well here, although Sandy Bridge-E and Ivy Bridge-E take the top spots. Due to the threading advantage WinRAR takes, the i7-4770K gets a 20 second advantage of its non-hyperthreaded cousin, the i5-4670K.
Image Manipulation - FastStone Image Viewer 4.2
FastStone Image Viewer is a free piece of software I have been using for quite a few years now. It allows quick viewing of flat images, as well as resizing, changing color depth, adding simple text or simple filters. It also has a bulk image conversion tool, which we use here. The software currently operates only in single-thread mode, which should change in later versions of the software. For this test, we convert a series of 170 files, of various resolutions, dimensions and types (of a total size of 163MB), all to the .gif format of 640x480 dimensions.
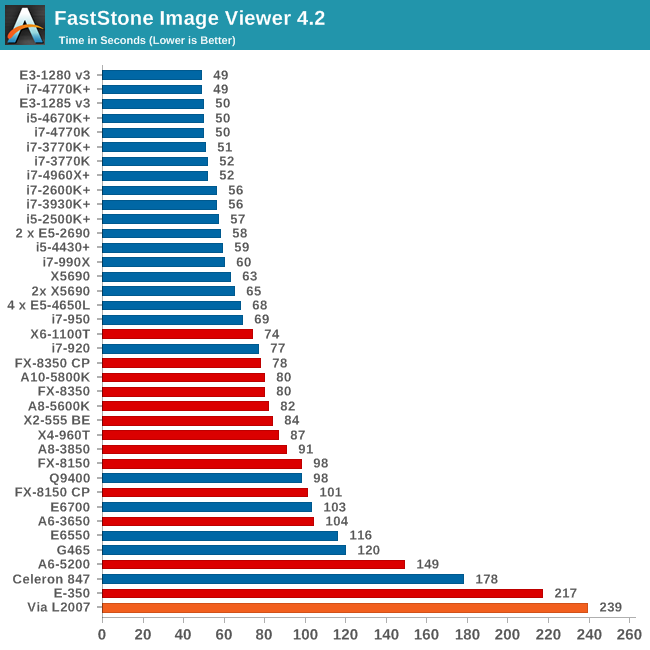
FastStone loves single threaded IPC and MHz, so it's no surprise for the Haswell CPUs to be on top, with no discernable difference between the i5-4670K and the i7-4770K. The old school Nehalems take a knock, with the i7-920 being almost a full 60% slower than the top scores.
Video Conversion - Xilisoft Video Converter 7
With XVC, users can convert any type of normal video to any compatible format for smartphones, tablets and other devices. By default, it uses all available threads on the system, and in the presence of appropriate graphics cards, can utilize CUDA for NVIDIA GPUs as well as AMD WinAPP for AMD GPUs. For this test, we use a set of 33 HD videos, each lasting 30 seconds, and convert them from 1080p to an iPod H.264 video format using just the CPU. The time taken to convert these videos gives us our result.
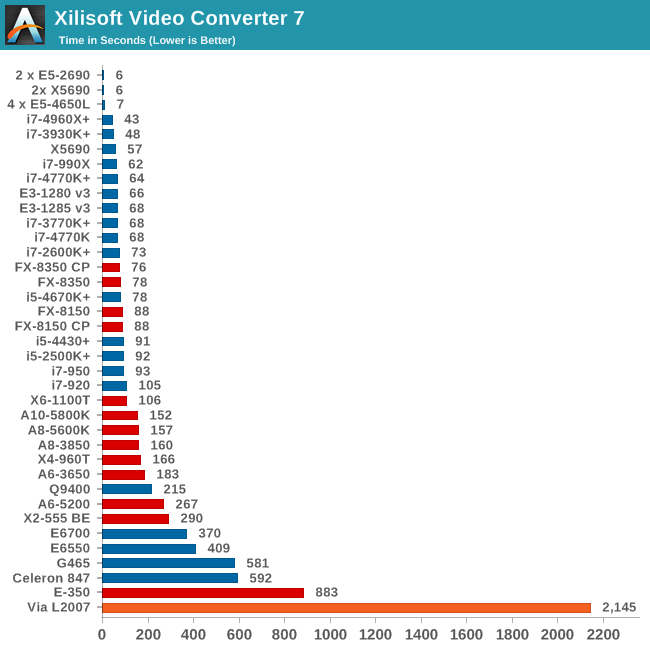
For fully multithreaded video conversion, a combination of cores, IPC and MHz take top spots, hence the i7-4960X is the consumer CPU to get. The i7-990X has a smaller advantage over the quad core Haswells this time, and here is one benchmark where the i5-4670K falls behind the FX-8350s due to the integer nature of the workload. Interestingly enough the i5-4430 slots in with an i5-2500K due to IPC increases despite lower power consumption and MHz.
Rendering – PovRay 3.7
The Persistence of Vision RayTracer, or PovRay, is a freeware package for as the name suggests, ray tracing. It is a pure renderer, rather than modeling software, but the latest beta version contains a handy benchmark for stressing all processing threads on a platform. We have been using this test in motherboard reviews to test memory stability at various CPU speeds to good effect – if it passes the test, the IMC in the CPU is stable for a given CPU speed. As a CPU test, it runs for approximately 2-3 minutes on high end platforms.
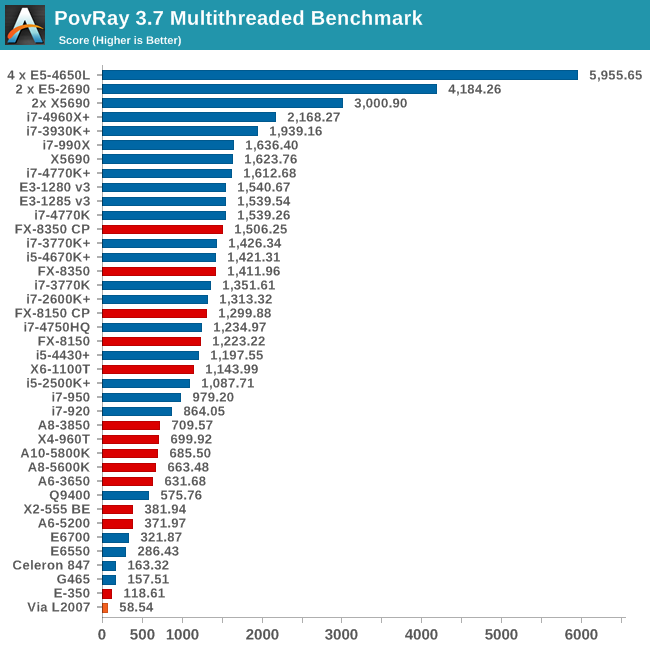
PovRay is another 'multithreading takes all', as shown by our 4P testing on E5-4650L CPUs. The i7-990X still shows its worth, being as quick as the i7-4770K at least, although the i7-920 and i7-950 are further down the pecking order.
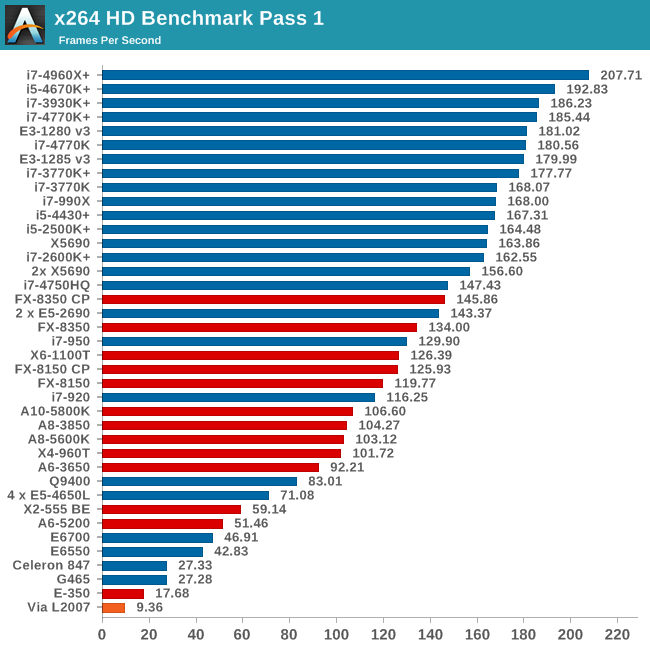
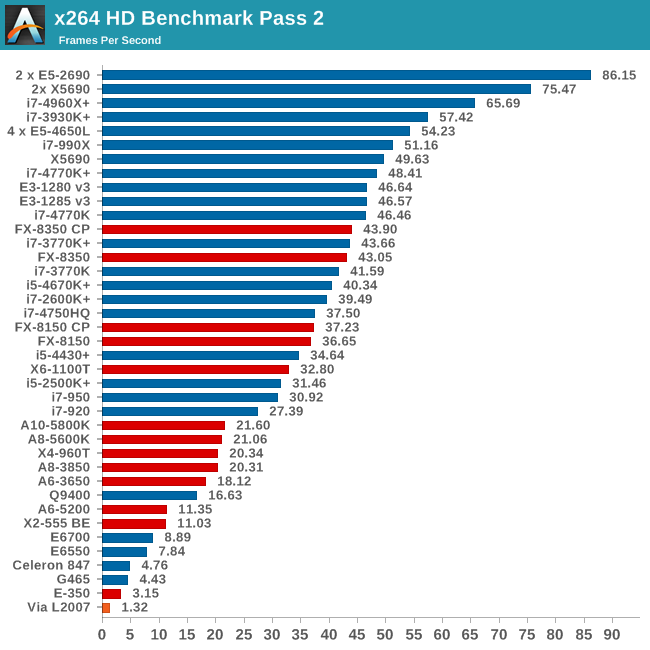
Video Conversion - x264 HD Benchmark
The x264 HD Benchmark uses a common HD encoding tool to process an HD MPEG2 source at 1280x720 at 3963 Kbps. This test represents a standardized result which can be compared across other reviews, and is dependent on both CPU power and memory speed. The benchmark performs a 2-pass encode, and the results shown are the average of each pass performed four times.
Grid Solvers - Explicit Finite Difference
For any grid of regular nodes, the simplest way to calculate the next time step is to use the values of those around it. This makes for easy mathematics and parallel simulation, as each node calculated is only dependent on the previous time step, not the nodes around it on the current calculated time step. By choosing a regular grid, we reduce the levels of memory access required for irregular grids. We test both 2D and 3D explicit finite difference simulations with 2n nodes in each dimension, using OpenMP as the threading operator in single precision. The grid is isotropic and the boundary conditions are sinks. Values are floating point, with memory cache sizes and speeds playing a part in the overall score.
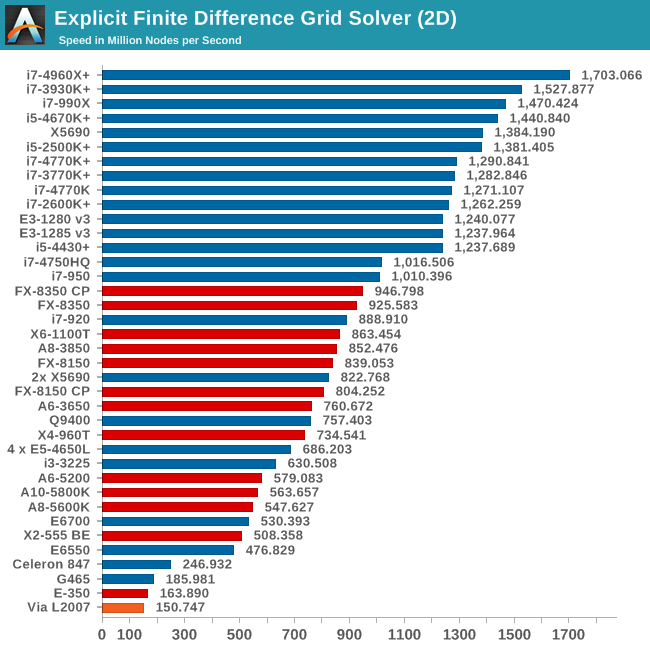
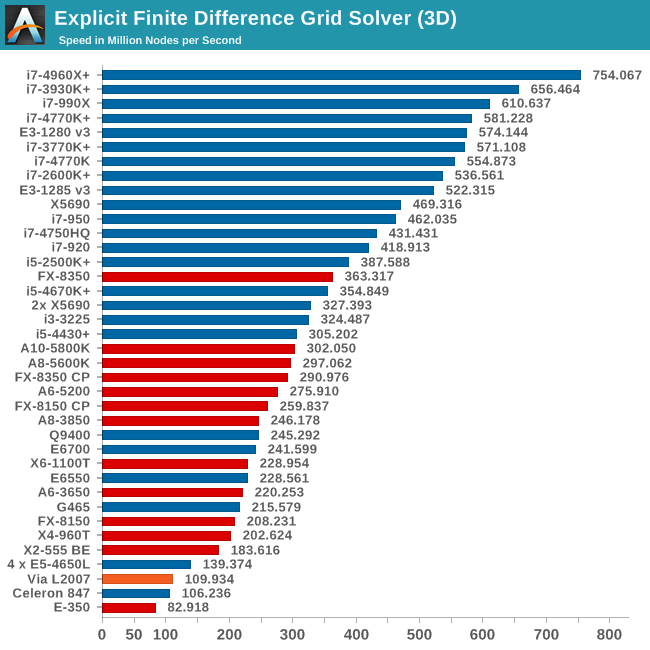
Grid solvers do love a fast processor and plenty of cache in order to store data. When moving up to 3D, it is harder to keep that data within the CPU and spending extra time coding in batches can help throughput. Our simulation takes a very naïve approach in code, using simple operations, but that doesn't stop the single socket, highly threaded CPUs taking top spots. The i5-4670K takes a surprising twist in 2D, outpacing the i7-4770K.
Grid Solvers - Implicit Finite Difference + Alternating Direction Implicit Method
The implicit method takes a different approach to the explicit method – instead of considering one unknown in the new time step to be calculated from known elements in the previous time step, we consider that an old point can influence several new points by way of simultaneous equations. This adds to the complexity of the simulation – the grid of nodes is solved as a series of rows and columns rather than points, reducing the parallel nature of the simulation by a dimension and drastically increasing the memory requirements of each thread. The upside, as noted above, is the less stringent stability rules related to time steps and grid spacing. For this we simulate a 2D grid of 2n nodes in each dimension, using OpenMP in single precision. Again our grid is isotropic with the boundaries acting as sinks. Values are floating point, with memory cache sizes and speeds playing a part in the overall score.
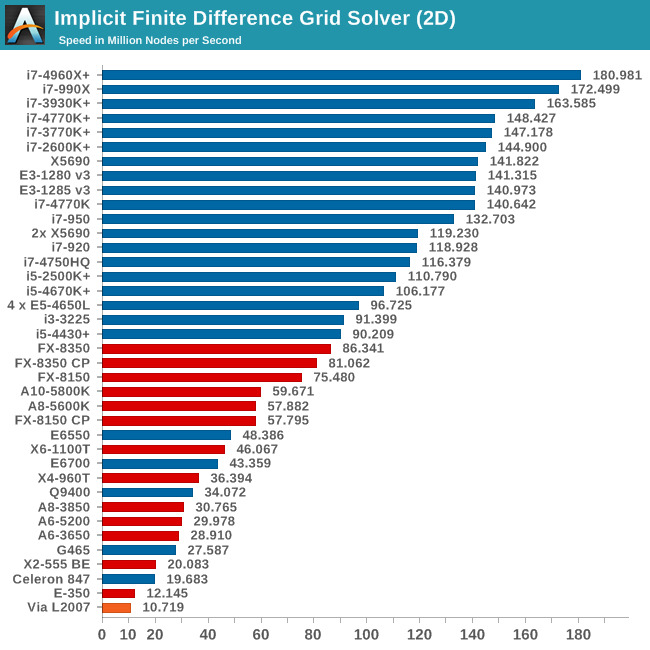
If anything, large caches matter more in implicit simulation, in line with both cores and threads. The i5-4430 is on the lower rungs of the Intel bloc, but the 990X is at the top.
Point Calculations - n-Body Simulation
When a series of heavy mass elements are in space, they interact with each other through the force of gravity. Thus when a star cluster forms, the interaction of every large mass with every other large mass defines the speed at which these elements approach each other. When dealing with millions and billions of stars on such a large scale, the movement of each of these stars can be simulated through the physical theorems that describe the interactions. The benchmark detects whether the processor is SSE2 or SSE4 capable, and implements the relative code. We run a simulation of 10240 particles of equal mass - the output for this code is in terms of GFLOPs, and the result recorded was the peak GFLOPs value.
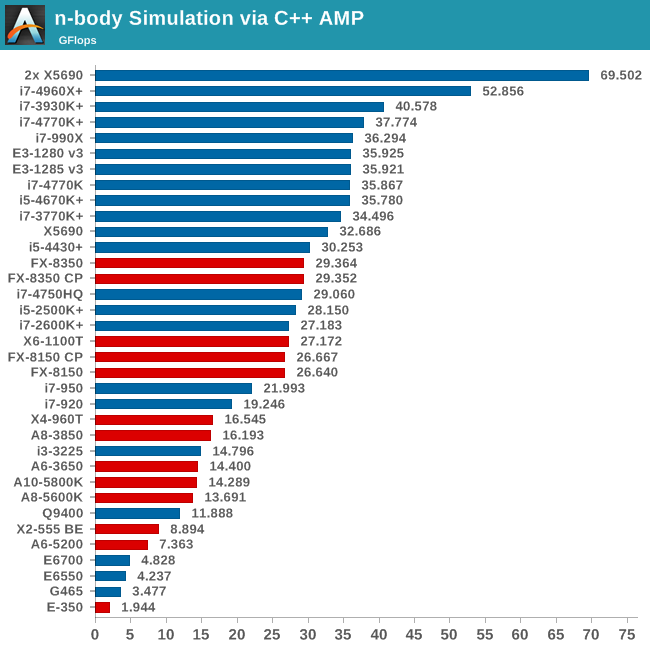
Due to extension enhancements, we see that a quad core Haswell Xeon scores roughly the same as the hex-core Nehalem, with the i5-4430 not far behind. If anything, the i7-920 and i7-950 take a nose dive here, and it's worth investing even in an i5-4430 for a 50% performance enhancement.


137 Comments
View All Comments
BrightCandle - Thursday, October 3, 2013 - link
So again we see tests with games that are known not to scale with more CPU cores. There are games however that show clear benefits, your site simply doesn't test them. Its not universally true that more cores or HT make a difference but maybe it would be a good idea to focus on those games we know do benefit like Metro last light, Hitman absolution, Medal of honour warfighter and some areas of Crysis 3.The problem here is that its the games that support more multithreading, so to give true impression you need to test a much wider and modern set of games. To do otherwise is pretty misleading.
althaz - Thursday, October 3, 2013 - link
To test only those games would be more misleading, as the vast majority of games are barely multithreaded at all.erple2 - Thursday, October 3, 2013 - link
Honestly, if the stats for single GPU's weren't all at about the same level, this would be an issue. It isn't until you get to multiple GPU's - an area that you start to see some differentiation. But that level begins to become very expensive very quickly. I'd posit that if you're already into multiple high-end video cards, the price difference between dual and quad core is relatively insignificant anyway, so the point is moot.Pheesh - Thursday, October 3, 2013 - link
appreciate the review, but it seems like the choice of games and settings makes the results primarily reflect a GPU constrained situation (1440p max settings for a CPU test?). It would be nice to see some of the newer engines which utilize more cores as most people will be buying CPU for titles in the future. I'm personally more interested in the delta between the CPU's when in CPU bound situations. Early benchmarks of next gen engines have shown larger differences between 8 threads vs 4 threads.cbrownx88 - Friday, October 4, 2013 - link
amenTheJian - Sunday, October 6, 2013 - link
Precisely. Also only 2% of us even own 1440p monitors and I'm guessing the super small % of us in a terrible economy that have say $550 to blow on a PC (the price of the FIRST 1440p monitor model you'd actually recognize the name of on newegg-asus model (122reviews) – and the only one with more than 12reviews) would buy anything BUT a monitor that would probably require 2 vid cards to fully utilize anyway. Raise your hand if you're planning on buying a $550 monitor instead of say, buying a near top end maxwell next year? I see no hands. Since 98% of us are on 1920x1200 or LESS (and more to the point a good 60% are less than 1920x1080), I'm guessing we are all planning on buying either a top vid card, or if you're in the 60% or so that have UNDER 1080p, you'll buy a $100-200 monitor (1080p upgrade to 22in-24in) and a $350-450 vid card to max out your game play.Translation: These results affect less than 2% of us and are pointless for another few years at the very least. I'm planning on buying a 1440p monitor but LONG after I get my maxwell. The vid card improves almost everything I'll do in games. The monitor only works well if I have the VID CARD muscle ALREADY. Most people of the super small 2% running 1440p or up have two vid cards to push the monitors (whatever they have). I don't want to buy a monitor and say "oh crap, all my games got super slow" for the next few years (1440p for me is a purchase once a name brand is $400 at 27in – only $150 away…LOL). I refuse to run anything but native and won't turn stuff off. I don't see the point in buying a beautiful monitor if I have to turn in into crap to get higher fps anyway... :)
Who is this article for? Start writing articles for 98% of your readers, not 2%. Also you'll find the cpu's are far more important where that 98% is running as fewer games are gpu bound. I find it almost stupid to recommend AMD these days for cpus and that stupidity grows even more as vid cards get faster. So basically if you are running 1080p and plan to for a while look at the cpu separation on the triple cards and consider that what you'll see as cpu results. If you want a good indication of what I mean, see the first or second 1440p article here and CTRL-F my nick. I listed all the games previously that part like the red sea leaving AMD cpus in the dust (it's quite a bit longer than CIV 5...ROFL). I gave links to the benchmarks showing all those games.
http://www.anandtech.com/comments/6985/choosing-a-...
There's the comments section on the 2nd 1440p article for the lazy people :)
Note that even here in this article TWO of the games aren't playable on single cards...LOL. 34fps avg in metro 2033 means you'll be hitting low 20's or worse MINIMUM. Sleeping dogs is already under 30fps AVG, so not even playable at avg fps let alone MIN fps you will hit (again TEENS probably). So if you buy that fancy new $550+ monitor (because only a retard or a gambler buys a $350 korean job from ebay etc...LOL) get used to slide shows and stutter gaming for even SINGLE 7970's in a lot of games never mind everything below sucking even more. Raise your hand if you have money for a $550 monitor AND a second vid card...ROFL. And these imaginary people this article is for, apparently should buy a $110 CPU from AMD to pair with this setup...ROFLMAO.
REALISTIC Recommendations:
Buy a GPU first.
Buy a great CPU second (and don't bother with AMD unless you're absolutely broke).
Buy that 1440p monitor if your single card is above 7970 already or you're planning shortly on maxwell or some such card. As we move to unreal 4 engine, cryengine 3.5 (or cryengine 4th gen…whatever) etc next year, get ready to feel the pain of that 1440p monitor even more if you're not above 7970. So again, this article should be considered largely irrelevant for most people unless you can fork over for the top end cards AND that monitor they test here. On top of this, as soon as you tell me you have the cash for both of those, what they heck are you doing talking $100 AMD cpus?...LOL.
And for AMD gpu lovers like the whole anandtech team it seems...Where's the NV portal site? (I love the gpus, just not their drivers):
http://hothardware.com/News/Origin-PC-Ditching-AMD...
Origin AND Valve have abandoned AMD even in the face of new gpus. Origin spells it right out exactly as we already know:
"Wasielewski offered a further clarifying statement from Alvaro Masis, one of Origin’s technical support managers, who said, “Primarily the overall issues have been stability of the cards, overheating, performance, scaling, and the amount of time to receive new drivers on both desktop and mobile GPUs.”
http://www.pcworld.com/article/2052184/whats-behin...
More data, nearly twice the failure rate at another vendor confirming why the first probably dropped AMD. I’d call a 5% rate bad, never mind AMD’s 1yr rate of nearly 8% failure (and nearly 9% over 3yrs). Cutting RMAs nearly in half certainly saves a company some money, never mind all the driver issues AMD still has and has had for 2yrs. A person adds a monitor and calls tech support about AMD eyefinity right? If they add a gpu they call about crossfire next?...ROFL. I hope AMD starts putting more effort into drivers, or the hardware sucks no matter how good the silicon is. As a boutique vendor at the high end surely the crossfire and multi-monitor situation affects them more than most who don't even ship high end stuff really (read:overly expensive...heh)
Note one of the games here performs worse with 3 cards than 2. So I guess even anandtech accidentally shows AMD's drivers still suck for triple's. 12 cpus in civ5 post above 107fps with 2 7970's, but only 5 can do over 107fps with 3 cards...Talk about going backwards. These tests, while wasted on 98% of us, should have at the least been done with the GPU maker who has properly functioning drivers WITH 2 or 3 CARDS :)
CrispySilicon - Thursday, October 3, 2013 - link
What gives Anand?I may be a little biased here since I'm still rocking a Q6600 (albeit fairly OC'd). But with all the other high end platforms you used, why not use a DDR3 X48/P45 for S775?
I say this because NOBODY who reads this article would still be running a mobo that old with pcie 1.1, especially in multi-gpu configuration.
dishayu - Friday, October 4, 2013 - link
I share you opinion on the matter, although I'm myself still running a Q6600 on a MSI P965 Platinum with an AMD HD6670. :PThomasS31 - Thursday, October 3, 2013 - link
Please also add Battlefield 4 to the game tests in the next update(s)/2014.I think it will be very relevant, based on the beta experience.
tackle70 - Thursday, October 3, 2013 - link
I know you dealt with this criticism in the intro, and I understand the reasoning (consistency, repeatability, etc) but I'm going to criticize anyways...These CPU results are to me fairly insignificant and not worth the many hours of testing, given that the majority of cases where CPU muscle is important are multiplayer (BF3/Crysis 3/BF4/etc). As you can see even from your benchmark data, these single player scenarios just don't really care about CPU all that much - even in multi-GPU. That's COMPLETELY different in the multiplayer games above.
Pretty much the only single player game I'm aware of that will eat up CPU power is Crysis 3. That game should at least be added to this test suite, in my opinion. I know it has no built in benchmark, but it would at least serve as a point of contact between the world of single player CPU-agnostic GPU-bound tests like these and the world of CPU-hungry multiplayer gaming.