The Seagate 600 & 600 Pro SSD Review
by Anand Lal Shimpi on May 7, 2013 8:00 AM ESTAnandTech Storage Bench 2013 Preview - 'The Destroyer'
When I built the AnandTech Heavy and Light Storage Bench suites in 2011 I did so because we didn't have any good tools at the time that would begin to stress a drive's garbage collection routines. Once all blocks have a sufficient number of used pages, all further writes will inevitably trigger some sort of garbage collection/block recycling algorithm. Our Heavy 2011 test in particular was designed to do just this. By hitting the test SSD with a large enough and write intensive enough workload, we could ensure that some amount of GC would happen.
There were a couple of issues with our 2011 tests that I've been wanting to rectify however. First off, all of our 2011 tests were built using Windows 7 x64 pre-SP1, which meant there were potentially some 4K alignment issues that wouldn't exist had we built the trace on a system with SP1. This didn't really impact most SSDs but it proved to be a problem with some hard drives. Secondly, and more recently, I've shifted focus from simply triggering GC routines to really looking at worst case scenario performance after prolonged random IO. For years I'd felt the negative impacts of inconsistent IO performance with all SSDs, but until the S3700 showed up I didn't think to actually measure and visualize IO consistency. The problem with our IO consistency tests are they are very focused on 4KB random writes at high queue depths and full LBA spans, not exactly a real world client usage model. The aspects of SSD architecture that those tests stress however are very important, and none of our existing tests were doing a good job of quantifying that.
I needed an updated heavy test, one that dealt with an even larger set of data and one that somehow incorporated IO consistency into its metrics. The new benchmark doesn't have a name, I've just been calling it The Destroyer (although AnandTech Storage Bench 2013 is likely a better fit for PR reasons).
Everything about this new test is bigger and better. The test platform moves to Windows 8 Pro x64. The workload is far more realistic. Just as before, this is an application trace based test - I record all IO requests made to a test system, then play them back on the drive I'm measuring and run statistical analysis on the drive's responses.
Imitating most modern benchmarks I crafted the Destroyer out of a series of scenarios. For this benchmark I focused heavily on Photo editing, Gaming, Virtualization, General Productivity, Video Playback and Application Development. Rough descriptions of the various scenarios are in the table below:
| AnandTech Storage Bench 2013 Preview - The Destroyer | ||||||||||||
| Workload | Description | Applications Used | ||||||||||
| Photo Sync/Editing | Import images, edit, export | Adobe Photoshop CS6, Adobe Lightroom 4, Dropbox | ||||||||||
| Gaming | Download/install games, play games | Steam, Deus Ex, Skyrim, Starcraft 2, BioShock Infinite | ||||||||||
| Virtualization | Run/manage VM, use general apps inside VM | VirtualBox | ||||||||||
| General Productivity | Browse the web, manage local email, copy files, encrypt/decrypt files, backup system, download content, virus/malware scan | Chrome, IE10, Outlook, Windows 8, AxCrypt, uTorrent, AdAware | ||||||||||
| Video Playback | Copy and watch movies | Windows 8 | ||||||||||
| Application Development | Compile projects, check out code, download code samples | Visual Studio 2012 | ||||||||||
While some tasks remained independent, many were stitched together (e.g. system backups would take place while other scenarios were taking place). The overall stats give some justification to what I've been calling this test internally:
| AnandTech Storage Bench 2013 Preview - The Destroyer, Specs | |||||||||||||
| The Destroyer (2013) | Heavy 2011 | ||||||||||||
| Reads | 38.83 million | 2.17 million | |||||||||||
| Writes | 10.98 million | 1.78 million | |||||||||||
| Total IO Operations | 49.8 million | 3.99 million | |||||||||||
| Total GB Read | 1583.02 GB | 48.63 GB | |||||||||||
| Total GB Written | 875.62 GB | 106.32 GB | |||||||||||
| Average Queue Depth | ~5.5 | ~4.6 | |||||||||||
| Focus | Worst case multitasking, IO consistency | Peak IO, basic GC routines | |||||||||||
SSDs have grown in their performance abilities over the years, so I wanted a new test that could really push high queue depths at times. The average queue depth is still realistic for a client workload, but the Destroyer has some very demanding peaks. When I first introduced the Heavy 2011 test, some drives would take multiple hours to complete it - today most high performance SSDs can finish the test in under 90 minutes. The Destroyer? So far the fastest I've seen it go is 10 hours. Most high performance I've tested seem to need around 12 - 13 hours per run, with mainstream drives taking closer to 24 hours. The read/write balance is also a lot more realistic than in the Heavy 2011 test. Back in 2011 I just needed something that had a ton of writes so I could start separating the good from the bad. Now that the drives have matured, I felt a test that was a bit more balanced would be a better idea.
Despite the balance recalibration, there's just a ton of data moving around in this test. Ultimately the sheer volume of data here and the fact that there's a good amount of random IO courtesy of all of the multitasking (e.g. background VM work, background photo exports/syncs, etc...) makes the Destroyer do a far better job of giving credit for performance consistency than the old Heavy 2011 test. Both tests are valid, they just stress/showcase different things. As the days of begging for better random IO performance and basic GC intelligence are over, I wanted a test that would give me a bit more of what I'm interested in these days. As I mentioned in the S3700 review - having good worst case IO performance and consistency matters just as much to client users as it does to enterprise users.
Given the sheer amount of time it takes to run through the Destroyer, and the fact that the test was only completed recently, I don't have many results to share. I'll be populating this database over the coming weeks/months. I'm still hunting for any issues/weirdness with the test so I'm not ready to remove the "Preview" label from it just yet. But the results thus far are very telling.
I'm reporting two primary metrics with the Destroyer: average data rate in MB/s and average service time in microseconds. The former gives you an idea of the throughput of the drive during the time that it was running the Destroyer workload. This can be a very good indication of overall performance. What average data rate doesn't do a good job of is taking into account response time of very bursty (read: high queue depth) IO. By reporting average service time we heavily weigh latency for queued IOs. You'll note that this is a metric I've been reporting in our enterprise benchmarks for a while now. With the client tests maturing, the time was right for a little convergence.
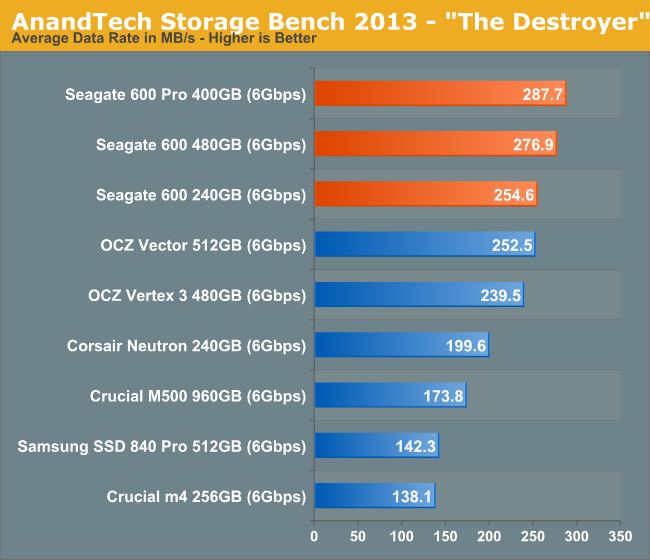
Now we see what Seagate's balance of consistency and peak performance gives us: leading performance in our latest benchmark. The Destroyer does a good job of penalizing drives with poor IO consistency as the entire drive is written to more than once, but the workload is more client-like than a pure 4KB random write. The result is a test that likes both peak performance and consistent behavior. Seagate's 600 delivers both. I purposefully didn't include a 120GB Seagate 600 here. This test was really optimized for 400GB+ capacities, at lower capacities (especially on drives that don't behave well in a full state) the performance dropoff can be significant. I'm not too eager to include 240/256GB drives here either but I kept some of the original numbers I launched the test with.
OCZ's Vector actually does incredibly well here, giving us more insight into the balance of peak performance/IO consistency needed to do well in our latest test.
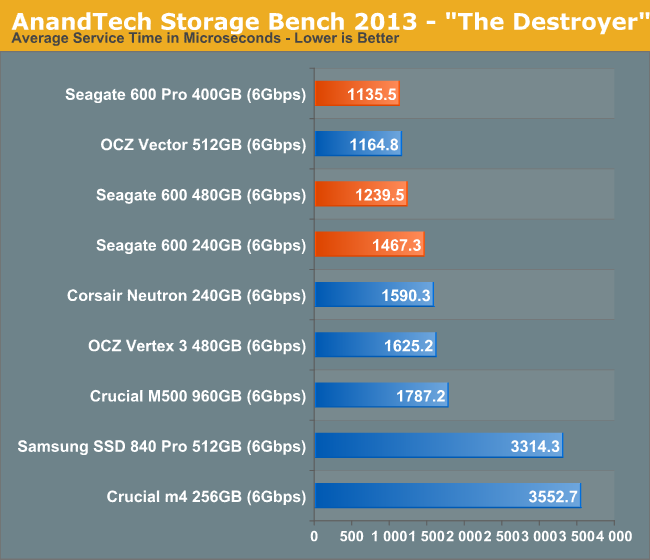
The 600's average service time throughout this test is very good. OCZ's Vector does even better here, outperforming the 480GB 600 and falling short of the 400GB 600 Pro. The difference between the 600 and 600 Pro here gives you a good idea of how much performance can scale if you leave some spare area on the drive.


59 Comments
View All Comments
Jestre - Tuesday, May 7, 2013 - link
2 requests:Can you incorporate the average power usage measured during the testing benchmarks, both "the Destroyer" and the 2011 benchmarks?
It would be nice to see the actual realistic measured power consumption averages for worst case tests like this. You could also list an average power with a reasonable downtime calculated based on a typical usage pattern and the actual time to complete.
Can you also list the time is take to complete these test for each drive,
Thanks for all you good work.
Jestre
Kristian Vättö - Tuesday, May 7, 2013 - link
At least I don't have the hardware for measuring power consumption over time (all I have is a simple multimeter, unless it has features I'm not aware of). Anand might but I'm guessing not as I'm sure he would have taken advantage of it. The problem is that such hardware is not exactly cheap, so it's a rather big investment for only one test (I'd love to have one though).lotharamious - Tuesday, May 7, 2013 - link
Another wonderful SSD review, Anand. Well done!Since I started reading your site over 11 years ago your reviews have been really outstanding and particularly so with SSDs.
I really love delving into the data presented, but you guys really need to get with the times on data plotting. Your charts can be somewhat confusing and downright frustrating to read.
When showing scatter plots please include an option for plotting more statistics of the dataset, e.g. trendline about the mean, standard deviation, etc. It's really difficult to see just how well the 800 is gaining performance towards the end of the test run without a noticable trendline for your eyes to follow along the graph.
In a chart, when displaying a line that corresponds to the unit that is currently being reviewed please draw that line ON TOP of the other references units' data lines. It's frustrating to try to compare the performance of different units when the one you really care about is blocked from view because the other 50 lines on the chart make a large enough noisy mess to not be able to tell right from left.
And just for fun, I really wish you guys used a javascript plotting library for your reviews. It would be awesome if you could click on different graphics cards in a graph to see the percentage performance gain you would get between the card you clicked on and all the other cards in the graph. I've seen this kind of stuff on other sites, and it would be amazing to have here.
Sorry for being so negative, because I still love reading this site every day. It's been incredible to see how you, the industry, and the drives themselves have morphed since 2008.
Here's to many more great reviews!
mike55 - Tuesday, May 7, 2013 - link
What causes the sharp drop in IOPS in the random write tests after so many minutes for SSDs? Is it because the drive has run out of empty blocks and is then doing read-modify-writes?mike55 - Tuesday, May 7, 2013 - link
Never mind, just realized my question was answered in the article.HisDivineOrder - Tuesday, May 7, 2013 - link
I imagine Seagate will tap its longterm partner, Samsung, to help it out with SSD controllers once LAMD is gone. Who did Samsung sell its hard drive business to? Seagate.Who did Seagate contract out for NAND from? Samsung.
Seagate'll go back to Samsung once it's time for a new controller that can handle SATAe.
kyuu - Wednesday, May 8, 2013 - link
While this is a decent drive, another source revealed that Seagate is trying to pull warranty shenanigans, limiting the warranty to 3 years OR 72 TB of writes (36 TB for the smaller drives), whichever comes first. Putting a "mileage" limit on the warranty is a first in the SSD space as far as I'm aware, and not something that should be supported. Definite pass on Seagate's SSDs unless and until they change their warranty terms.Kristian Vättö - Wednesday, May 8, 2013 - link
If you look at the warranty terms of other manufacturers, there is always a phrase that says warranty is invalidated if the SSD is operated outside of public specifications (and endurance is one one of them):Intel: "any Product which has been modified or operated outside of Intel’s publicly available
specifications"
http://download.intel.com/support/ssdc/hpssd/sb/1s...
Crucial: "The above warranties cover only defects arising under normal use and do not include malfunctions or failures resulting from misuse, abuse, neglect, alteration, problems with electrical power, usage not in accordance with product instructions"
http://www.crucial.com/company/termsofsale.aspx#li...
OCZ: "Improper use of product, Normal wear and tear"
http://ocz.com/consumer/support/warranty
Or at least that's how I interpret their warranties. In a nutshell, warranty only covers failures which are results of defects in materials or assembly - it's clear that endurance is limited and hence exceeding the specification means that a failure may not have been due to a defect.
daniel_mayes - Wednesday, May 8, 2013 - link
I would like to see consumer vs enterprise in a SMB server. Under a certain price point for example at $1,300 and lower you can get 3 x Intel 710 Series 100GB ($1,200), 5 x Intel DC S3700 100GB ($1,250), 4 x Seagate 600 Pro ($1,300), 5 x OCZ Vector 256 GB ($1,225), 5 x Corsair Neutron GTX 240 GB ($1,100), 5 x Samsung 840 Pro 256 GB ($1,200). Size doesn't matter as much as low latency and highest consistent performance. Since the consumer drives have more space over provision them at 25% and %50. That way we can see if more consumer ssd's at a higher provision rate are faster in a SMB environment than the enterprise drives. Yes I know the consumer ssd's will probably die faster but I'm sure most SMB's would rather pay half the cost of an enterprise drive and chance having to replace it twice as often.Jestre - Wednesday, May 8, 2013 - link
Kristian,is $59.95 with free shipping in your budget?
See http://www.rc-electronics-usa.com/ammeters/dc-amp-...
Not a sweet and an Agilent EPM power meter but it should do the trick at 3% of the price.
Jestre .