The Seagate 600 & 600 Pro SSD Review
by Anand Lal Shimpi on May 7, 2013 8:00 AM ESTPerformance Consistency
In our Intel SSD DC S3700 review I introduced a new method of characterizing performance: looking at the latency of individual operations over time. The S3700 promised a level of performance consistency that was unmatched in the industry, and as a result needed some additional testing to show that. The reason we don't have consistent IO latency with SSDs is because inevitably all controllers have to do some amount of defragmentation or garbage collection in order to continue operating at high speeds. When and how an SSD decides to run its defrag and cleanup routines directly impacts the user experience. Frequent (borderline aggressive) cleanup generally results in more stable performance, while delaying that can result in higher peak performance at the expense of much lower worst case performance. The graphs below tell us a lot about the architecture of these SSDs and how they handle internal defragmentation.
To generate the data below I took a freshly secure erased SSD and filled it with sequential data. This ensures that all user accessible LBAs have data associated with them. Next I kicked off a 4KB random write workload across all LBAs at a queue depth of 32 using incompressible data. I ran the test for just over half an hour, no where near what we run our steady state tests for but enough to give me a good look at drive behavior once all spare area filled up.
I recorded instantaneous IOPS every second for the duration of the test. I then plotted IOPS vs. time and generated the scatter plots below. Each set of graphs features the same scale. The first two sets use a log scale for easy comparison, while the last set of graphs uses a linear scale that tops out at 50K IOPS for better visualization of differences between drives.
The high level testing methodology remains unchanged from our S3700 review. Unlike in previous reviews however, I did vary the percentage of the drive that I filled/tested depending on the amount of spare area I was trying to simulate. The buttons are labeled with the advertised user capacity had the SSD vendor decided to use that specific amount of spare area. If you want to replicate this on your own all you need to do is create a partition smaller than the total capacity of the drive and leave the remaining space unused to simulate a larger amount of spare area. The partitioning step isn't absolutely necessary in every case but it's an easy way to make sure you never exceed your allocated spare area. It's a good idea to do this from the start (e.g. secure erase, partition, then install Windows), but if you are working backwards you can always create the spare area partition, format it to TRIM it, then delete the partition. Finally, this method of creating spare area works on the drives we've tested here but not all controllers may behave the same way.
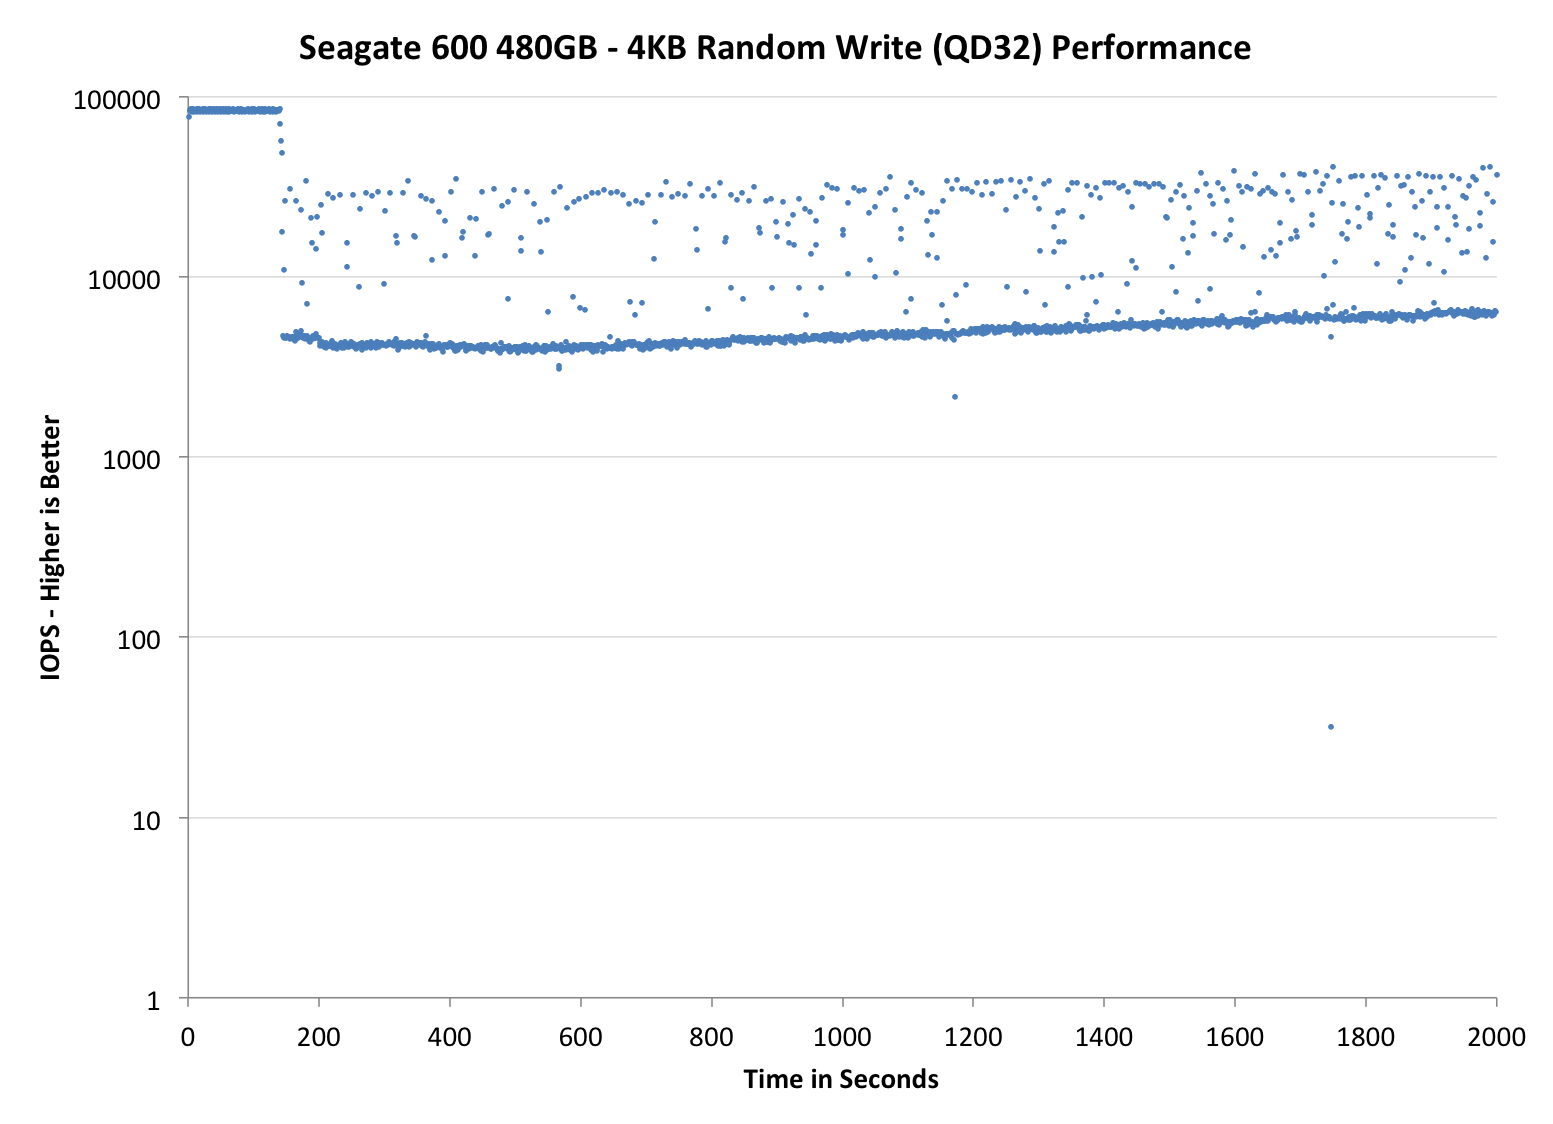
The first set of graphs shows the performance data over the entire 2000 second test period. In these charts you'll notice an early period of very high performance followed by a sharp dropoff. What you're seeing in that case is the drive allocating new blocks from its spare area, then eventually using up all free blocks and having to perform a read-modify-write for all subsequent writes (write amplification goes up, performance goes down).
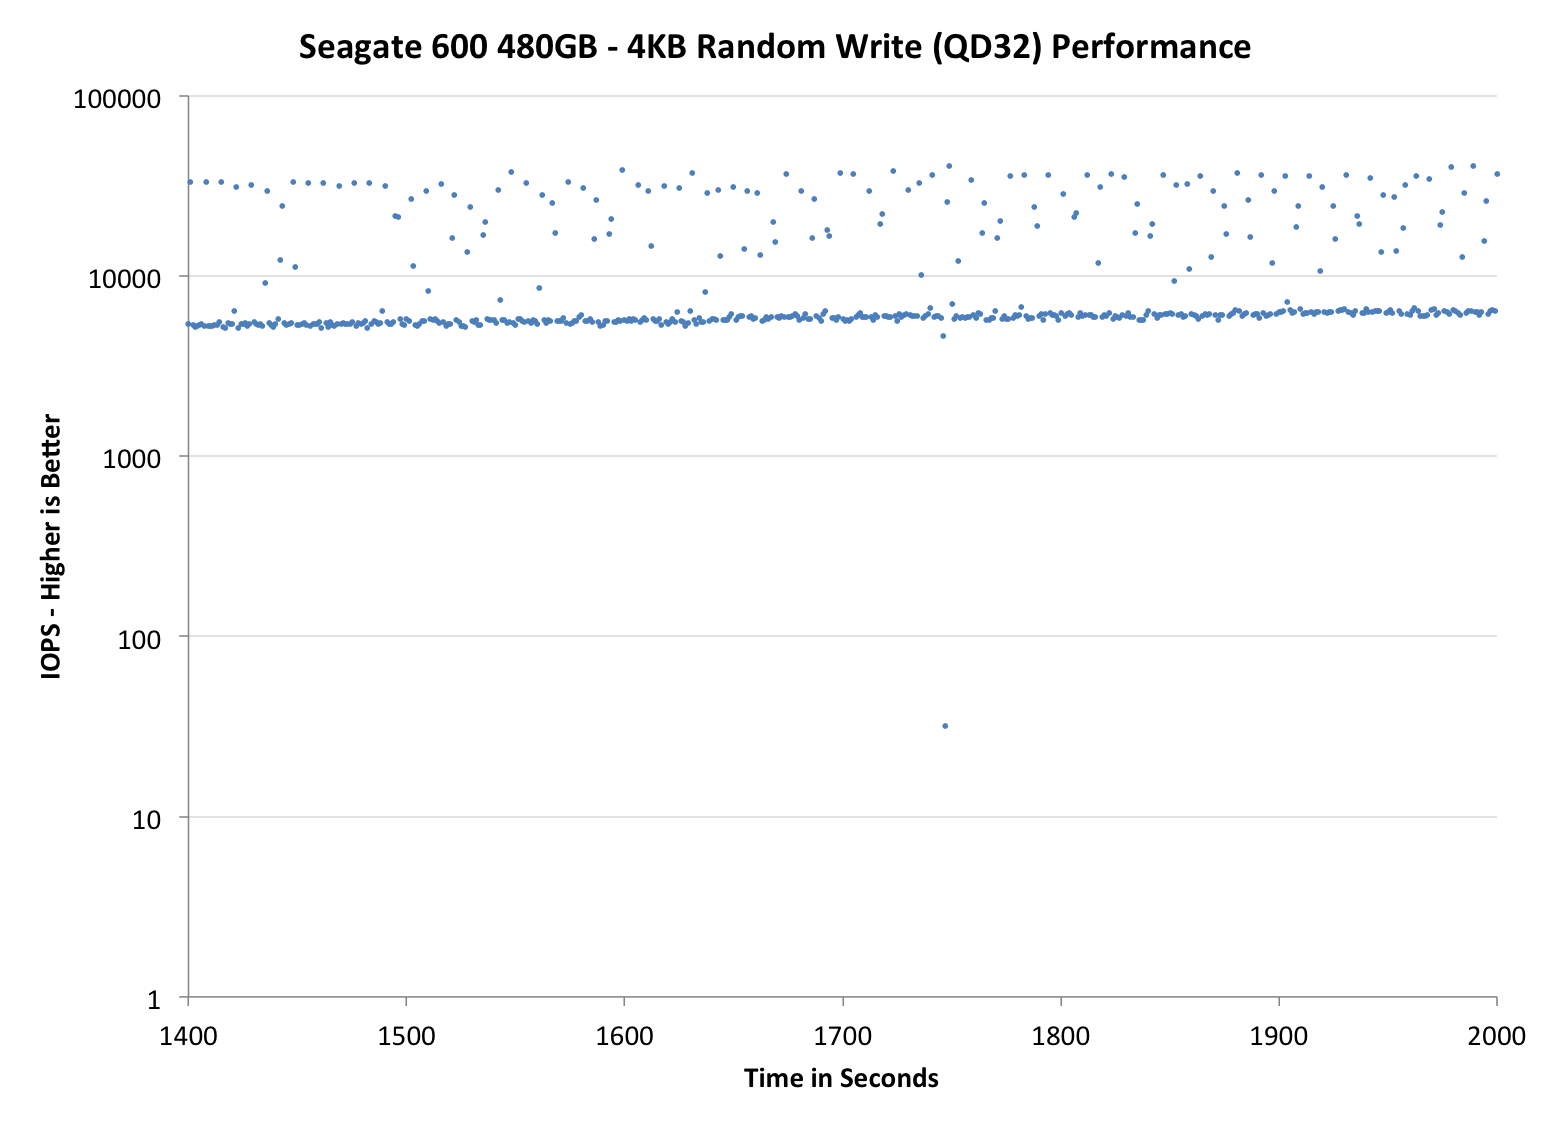
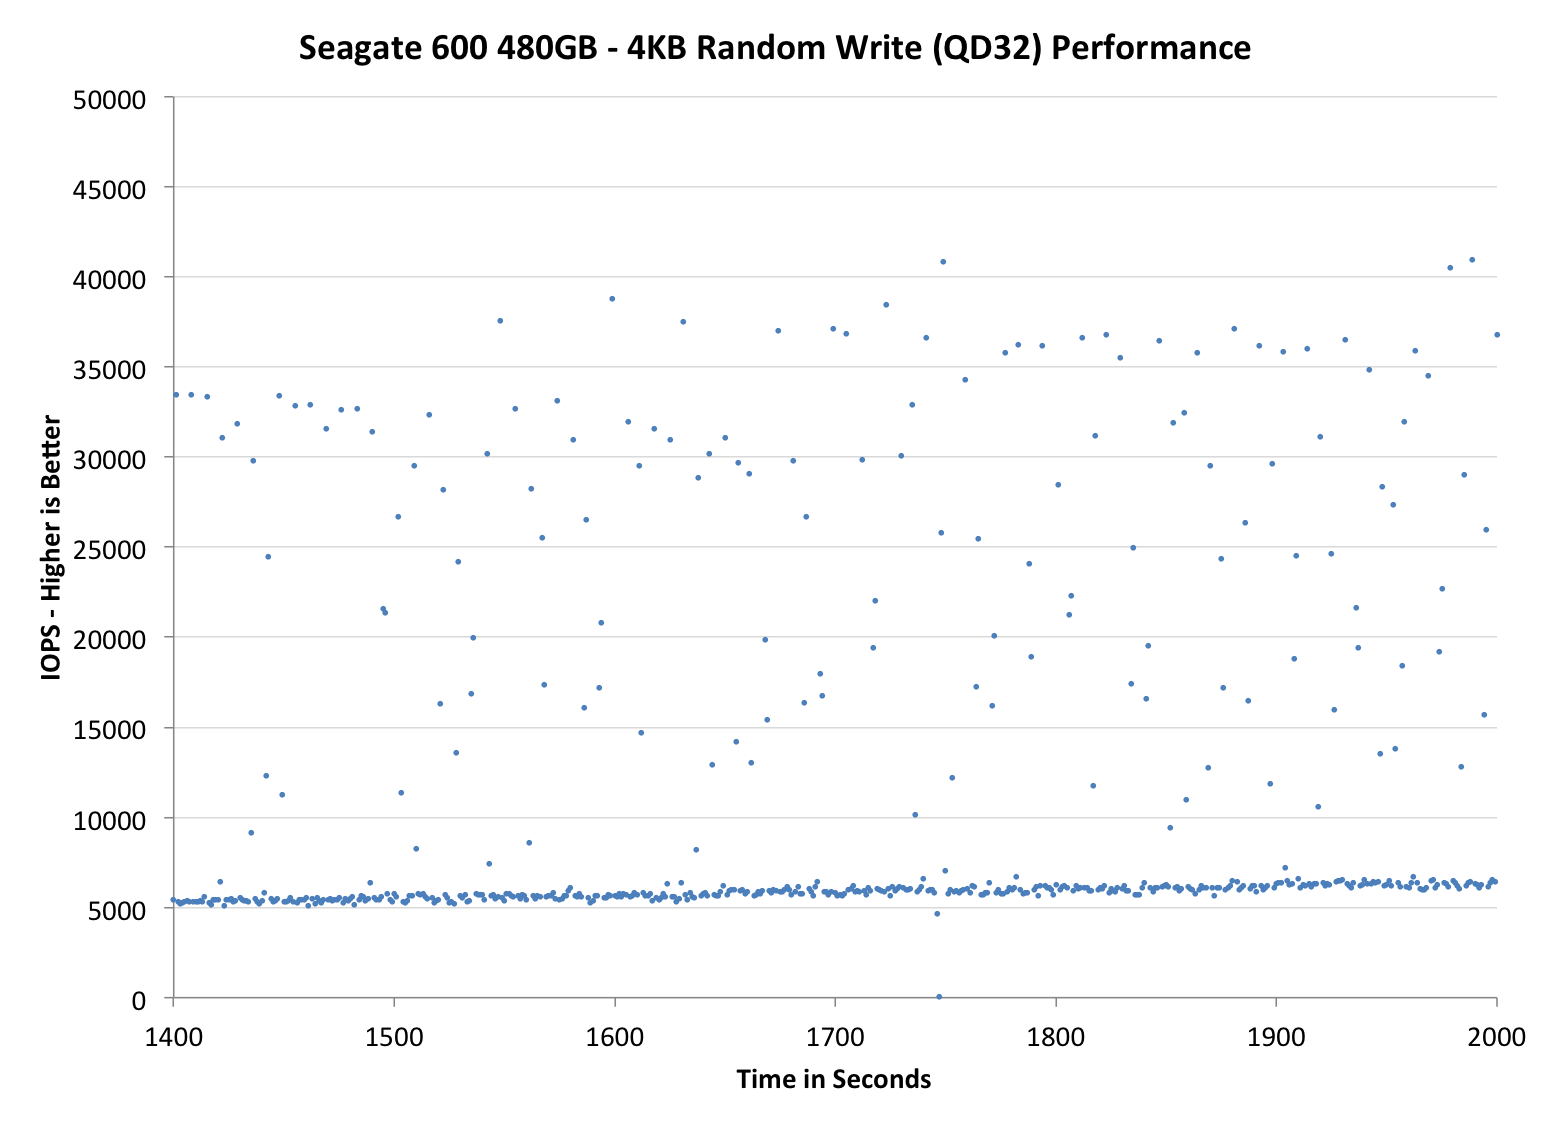
The second set of graphs zooms in to the beginning of steady state operation for the drive (t=1400s). The third set also looks at the beginning of steady state operation but on a linear performance scale. Click the buttons below each graph to switch source data.
 |
|||||||||
| Corsair Neutron 240GB | Crucial M500 960GB | Samsung SSD 840 Pro 256GB | Seagate 600 480GB | Seagate 600 Pro 400GB | |||||
| Default | |||||||||
| 25% Spare Area | |||||||||
Now this is a bit surprising. I expected a tightly clustered group of IOs like we got with the LAMD based Corsair Neutron, but instead we see something different entirely. There's a clustering of IOs around the absolute minimum performance, but it looks like the controller is constantly striving for better performance. If there's any indication that Seagate's firmware is obviously different than what Corsair uses, this is it. If we look at the 400GB Seagate 600 Pro we get a good feel for what happens with further over provisioning. The 400GB Pro maintains consistently high performance for longer than the 480GB 600, and when it falls off the minimums are also higher as you'd expect.
 |
|||||||||
| Corsair Neutron 240GB | Crucial M500 960GB | Samsung SSD 840 Pro 256GB | Seagate 600 480GB | Seagate 600 Pro 400GB | |||||
| Default | |||||||||
| 25% Spare Area | |||||||||
Zooming in, the Seagate 600 definitely doesn't look bad - it's far better than the Samsung or Crucial offerings, but still obviously short of Corsair's Neutron. I almost wonder if Seagate prioritized peak performance a bit here in order to be more competitive in most client benchmarks.
 |
|||||||||
| Corsair Neutron 240GB | Crucial M500 960GB | Samsung SSD 840 Pro 256GB | Seagate 600 480GB | Seagate 600 Pro 400GB | |||||
| Default | |||||||||
| 25% Spare Area | |||||||||
The situation really looks a lot worse than it is here. The 600's performance isn't very consistent, but there's a clear floor at just above 5000 IOPS which is quite respectable. Compared to the Crucial and Samsung drives, the 600/600 Pro offer much better performance consistency. I do wish that Seagate had managed to deliver even more consistent performance given that we know what the controller is capable of. For client usage I suspect this won't matter, but in random write heavy enterprise workloads with large RAID arrays it isn't desirable behavior.


59 Comments
View All Comments
Jestre - Tuesday, May 7, 2013 - link
2 requests:Can you incorporate the average power usage measured during the testing benchmarks, both "the Destroyer" and the 2011 benchmarks?
It would be nice to see the actual realistic measured power consumption averages for worst case tests like this. You could also list an average power with a reasonable downtime calculated based on a typical usage pattern and the actual time to complete.
Can you also list the time is take to complete these test for each drive,
Thanks for all you good work.
Jestre
Kristian Vättö - Tuesday, May 7, 2013 - link
At least I don't have the hardware for measuring power consumption over time (all I have is a simple multimeter, unless it has features I'm not aware of). Anand might but I'm guessing not as I'm sure he would have taken advantage of it. The problem is that such hardware is not exactly cheap, so it's a rather big investment for only one test (I'd love to have one though).lotharamious - Tuesday, May 7, 2013 - link
Another wonderful SSD review, Anand. Well done!Since I started reading your site over 11 years ago your reviews have been really outstanding and particularly so with SSDs.
I really love delving into the data presented, but you guys really need to get with the times on data plotting. Your charts can be somewhat confusing and downright frustrating to read.
When showing scatter plots please include an option for plotting more statistics of the dataset, e.g. trendline about the mean, standard deviation, etc. It's really difficult to see just how well the 800 is gaining performance towards the end of the test run without a noticable trendline for your eyes to follow along the graph.
In a chart, when displaying a line that corresponds to the unit that is currently being reviewed please draw that line ON TOP of the other references units' data lines. It's frustrating to try to compare the performance of different units when the one you really care about is blocked from view because the other 50 lines on the chart make a large enough noisy mess to not be able to tell right from left.
And just for fun, I really wish you guys used a javascript plotting library for your reviews. It would be awesome if you could click on different graphics cards in a graph to see the percentage performance gain you would get between the card you clicked on and all the other cards in the graph. I've seen this kind of stuff on other sites, and it would be amazing to have here.
Sorry for being so negative, because I still love reading this site every day. It's been incredible to see how you, the industry, and the drives themselves have morphed since 2008.
Here's to many more great reviews!
mike55 - Tuesday, May 7, 2013 - link
What causes the sharp drop in IOPS in the random write tests after so many minutes for SSDs? Is it because the drive has run out of empty blocks and is then doing read-modify-writes?mike55 - Tuesday, May 7, 2013 - link
Never mind, just realized my question was answered in the article.HisDivineOrder - Tuesday, May 7, 2013 - link
I imagine Seagate will tap its longterm partner, Samsung, to help it out with SSD controllers once LAMD is gone. Who did Samsung sell its hard drive business to? Seagate.Who did Seagate contract out for NAND from? Samsung.
Seagate'll go back to Samsung once it's time for a new controller that can handle SATAe.
kyuu - Wednesday, May 8, 2013 - link
While this is a decent drive, another source revealed that Seagate is trying to pull warranty shenanigans, limiting the warranty to 3 years OR 72 TB of writes (36 TB for the smaller drives), whichever comes first. Putting a "mileage" limit on the warranty is a first in the SSD space as far as I'm aware, and not something that should be supported. Definite pass on Seagate's SSDs unless and until they change their warranty terms.Kristian Vättö - Wednesday, May 8, 2013 - link
If you look at the warranty terms of other manufacturers, there is always a phrase that says warranty is invalidated if the SSD is operated outside of public specifications (and endurance is one one of them):Intel: "any Product which has been modified or operated outside of Intel’s publicly available
specifications"
http://download.intel.com/support/ssdc/hpssd/sb/1s...
Crucial: "The above warranties cover only defects arising under normal use and do not include malfunctions or failures resulting from misuse, abuse, neglect, alteration, problems with electrical power, usage not in accordance with product instructions"
http://www.crucial.com/company/termsofsale.aspx#li...
OCZ: "Improper use of product, Normal wear and tear"
http://ocz.com/consumer/support/warranty
Or at least that's how I interpret their warranties. In a nutshell, warranty only covers failures which are results of defects in materials or assembly - it's clear that endurance is limited and hence exceeding the specification means that a failure may not have been due to a defect.
daniel_mayes - Wednesday, May 8, 2013 - link
I would like to see consumer vs enterprise in a SMB server. Under a certain price point for example at $1,300 and lower you can get 3 x Intel 710 Series 100GB ($1,200), 5 x Intel DC S3700 100GB ($1,250), 4 x Seagate 600 Pro ($1,300), 5 x OCZ Vector 256 GB ($1,225), 5 x Corsair Neutron GTX 240 GB ($1,100), 5 x Samsung 840 Pro 256 GB ($1,200). Size doesn't matter as much as low latency and highest consistent performance. Since the consumer drives have more space over provision them at 25% and %50. That way we can see if more consumer ssd's at a higher provision rate are faster in a SMB environment than the enterprise drives. Yes I know the consumer ssd's will probably die faster but I'm sure most SMB's would rather pay half the cost of an enterprise drive and chance having to replace it twice as often.Jestre - Wednesday, May 8, 2013 - link
Kristian,is $59.95 with free shipping in your budget?
See http://www.rc-electronics-usa.com/ammeters/dc-amp-...
Not a sweet and an Agilent EPM power meter but it should do the trick at 3% of the price.
Jestre .