The Seagate 600 & 600 Pro SSD Review
by Anand Lal Shimpi on May 7, 2013 8:00 AM ESTPerformance Consistency
In our Intel SSD DC S3700 review I introduced a new method of characterizing performance: looking at the latency of individual operations over time. The S3700 promised a level of performance consistency that was unmatched in the industry, and as a result needed some additional testing to show that. The reason we don't have consistent IO latency with SSDs is because inevitably all controllers have to do some amount of defragmentation or garbage collection in order to continue operating at high speeds. When and how an SSD decides to run its defrag and cleanup routines directly impacts the user experience. Frequent (borderline aggressive) cleanup generally results in more stable performance, while delaying that can result in higher peak performance at the expense of much lower worst case performance. The graphs below tell us a lot about the architecture of these SSDs and how they handle internal defragmentation.
To generate the data below I took a freshly secure erased SSD and filled it with sequential data. This ensures that all user accessible LBAs have data associated with them. Next I kicked off a 4KB random write workload across all LBAs at a queue depth of 32 using incompressible data. I ran the test for just over half an hour, no where near what we run our steady state tests for but enough to give me a good look at drive behavior once all spare area filled up.
I recorded instantaneous IOPS every second for the duration of the test. I then plotted IOPS vs. time and generated the scatter plots below. Each set of graphs features the same scale. The first two sets use a log scale for easy comparison, while the last set of graphs uses a linear scale that tops out at 50K IOPS for better visualization of differences between drives.
The high level testing methodology remains unchanged from our S3700 review. Unlike in previous reviews however, I did vary the percentage of the drive that I filled/tested depending on the amount of spare area I was trying to simulate. The buttons are labeled with the advertised user capacity had the SSD vendor decided to use that specific amount of spare area. If you want to replicate this on your own all you need to do is create a partition smaller than the total capacity of the drive and leave the remaining space unused to simulate a larger amount of spare area. The partitioning step isn't absolutely necessary in every case but it's an easy way to make sure you never exceed your allocated spare area. It's a good idea to do this from the start (e.g. secure erase, partition, then install Windows), but if you are working backwards you can always create the spare area partition, format it to TRIM it, then delete the partition. Finally, this method of creating spare area works on the drives we've tested here but not all controllers may behave the same way.
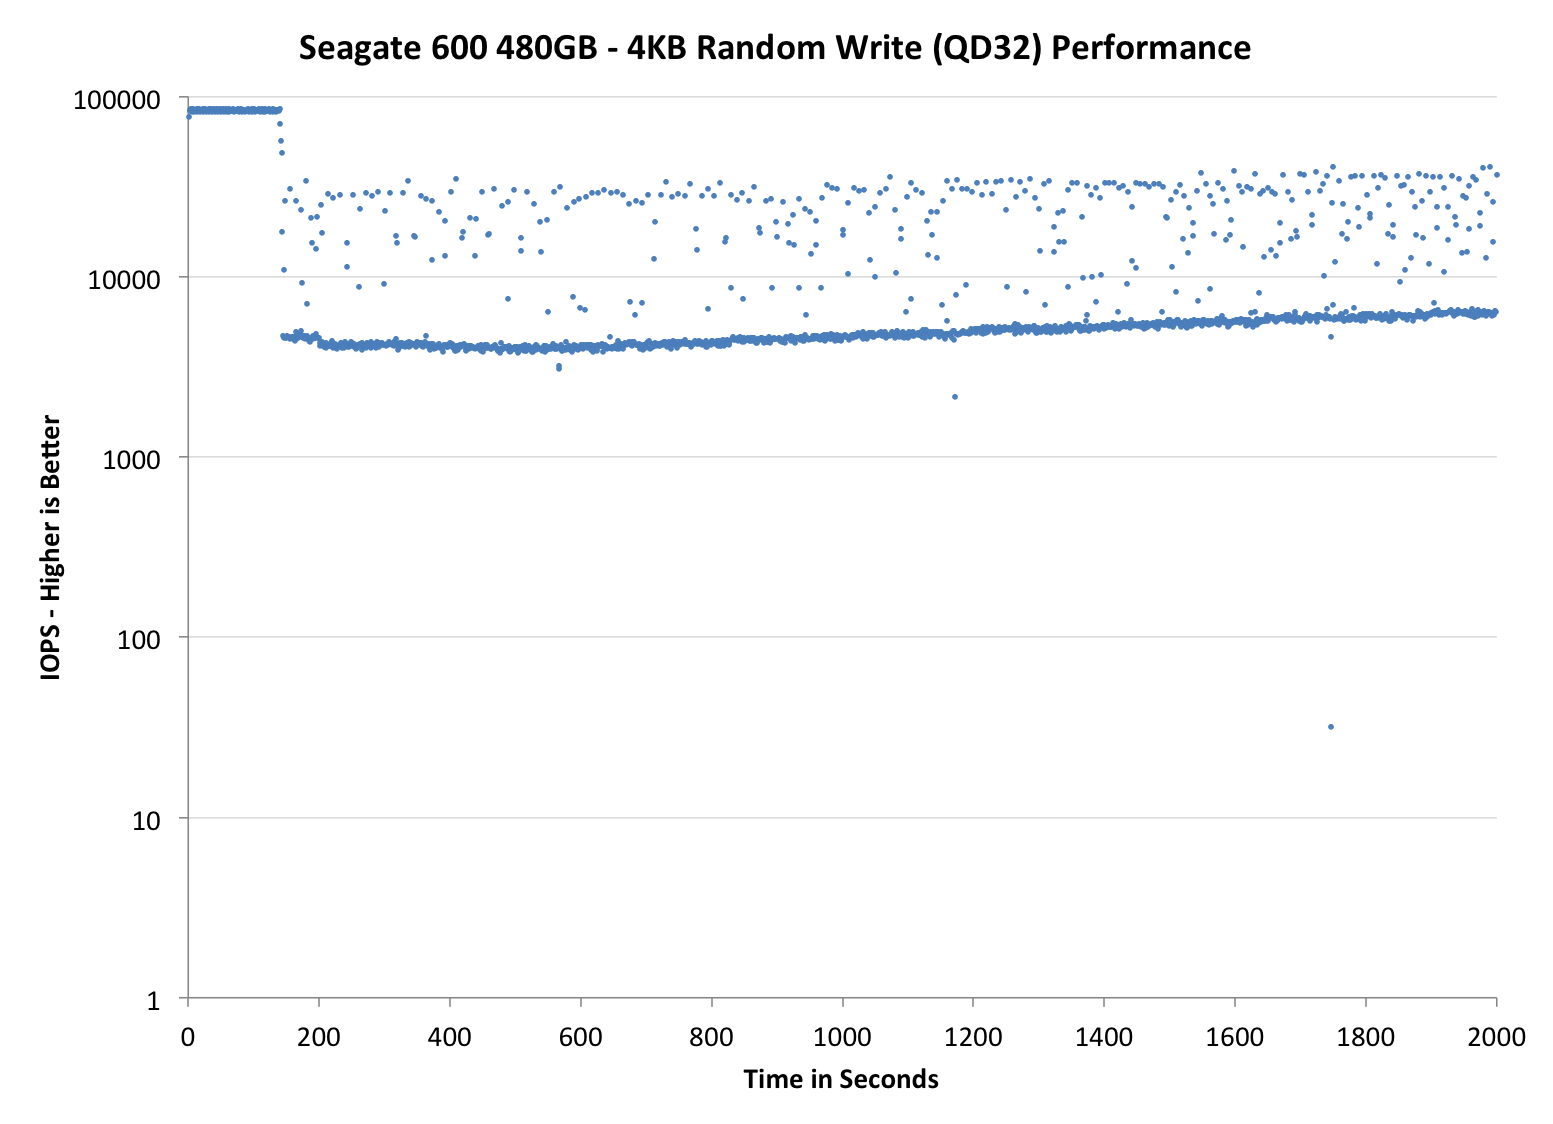
The first set of graphs shows the performance data over the entire 2000 second test period. In these charts you'll notice an early period of very high performance followed by a sharp dropoff. What you're seeing in that case is the drive allocating new blocks from its spare area, then eventually using up all free blocks and having to perform a read-modify-write for all subsequent writes (write amplification goes up, performance goes down).
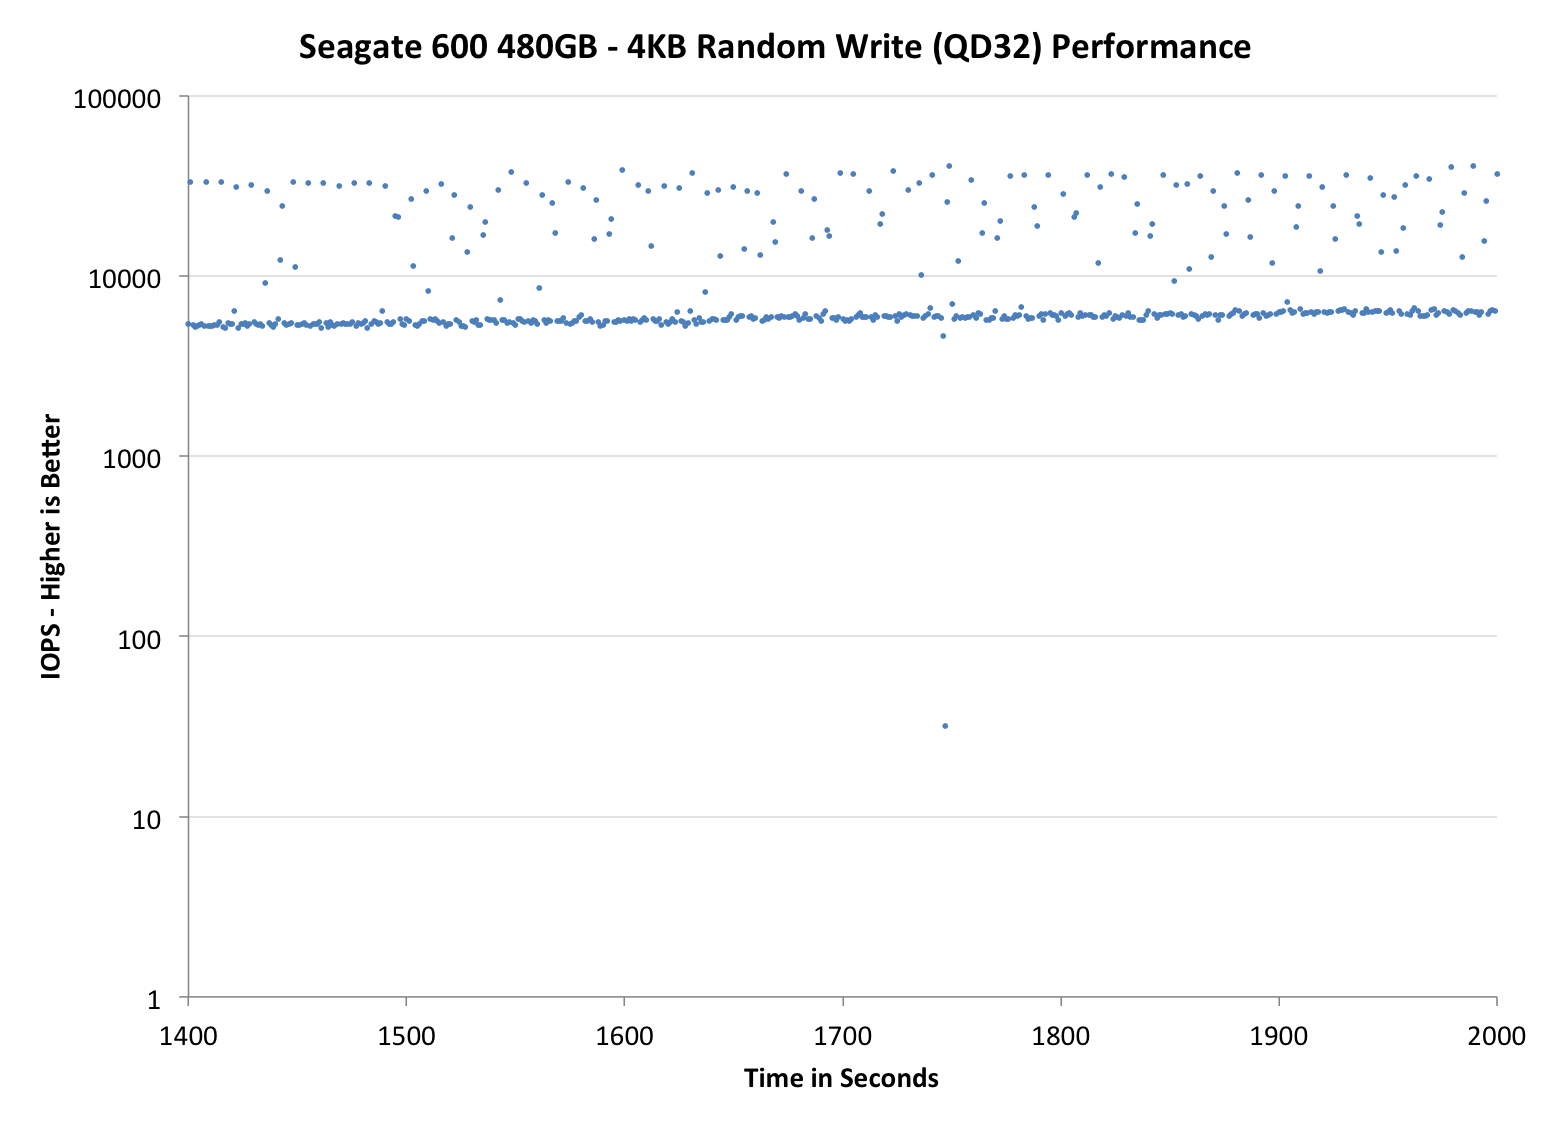
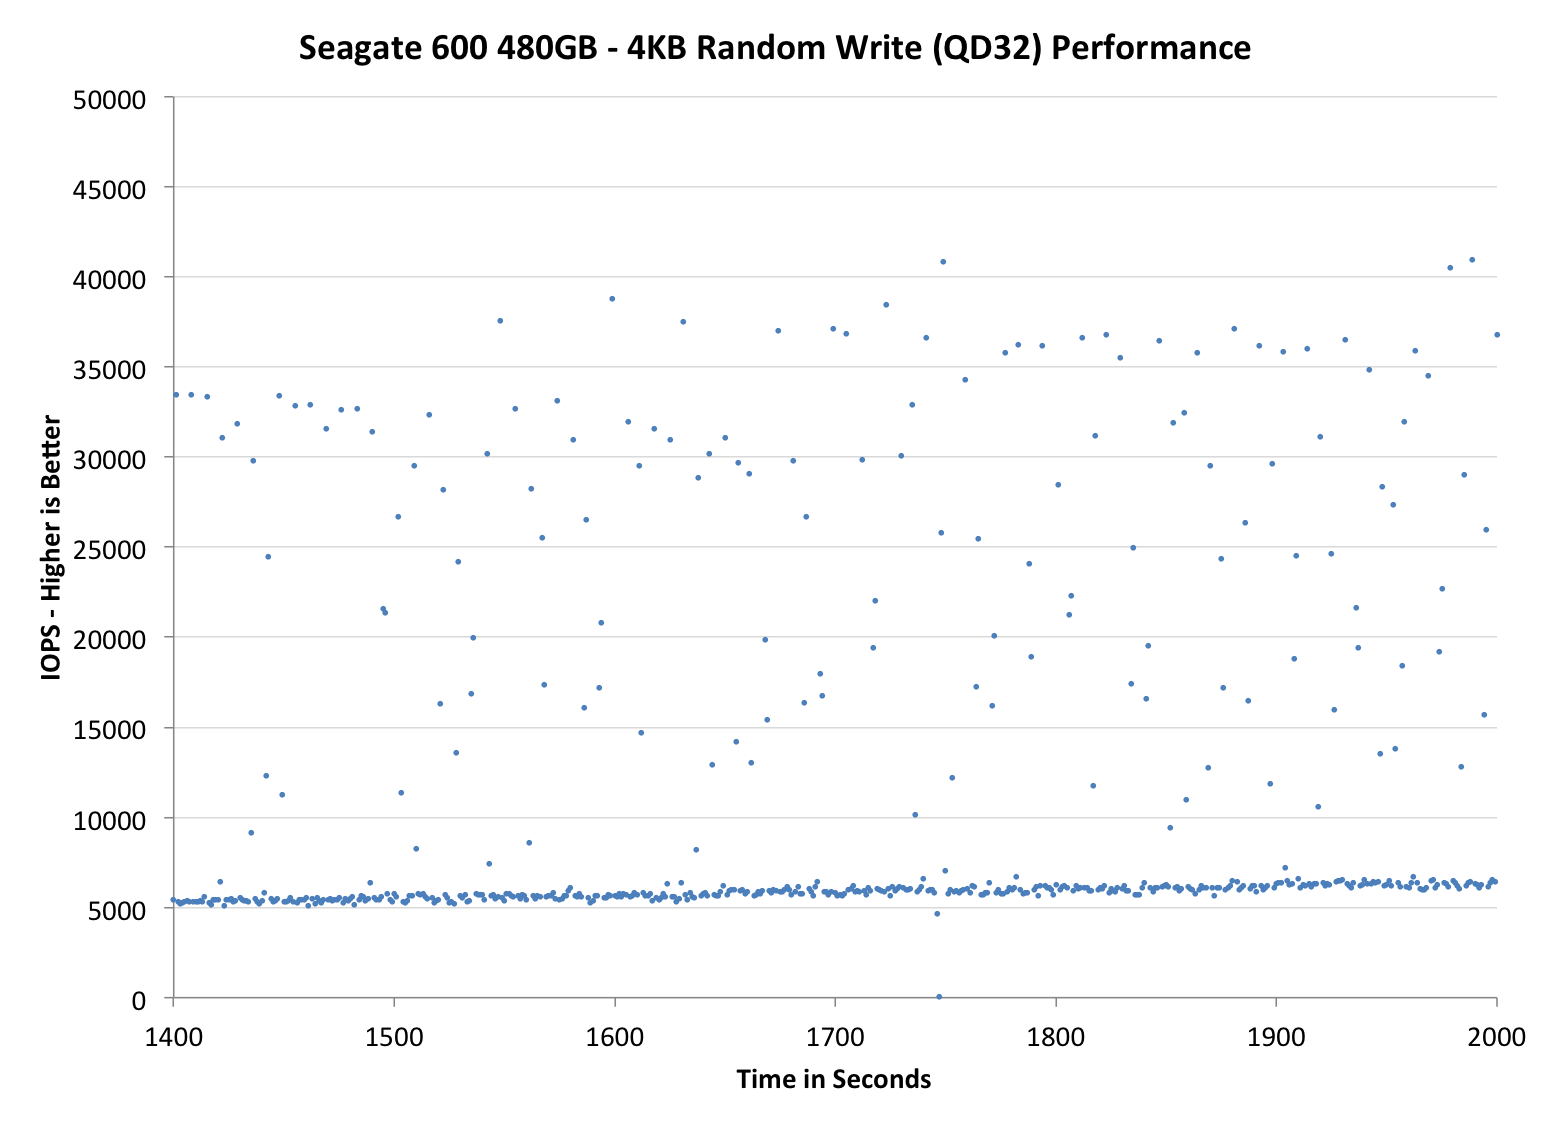
The second set of graphs zooms in to the beginning of steady state operation for the drive (t=1400s). The third set also looks at the beginning of steady state operation but on a linear performance scale. Click the buttons below each graph to switch source data.
 |
|||||||||
| Corsair Neutron 240GB | Crucial M500 960GB | Samsung SSD 840 Pro 256GB | Seagate 600 480GB | Seagate 600 Pro 400GB | |||||
| Default | |||||||||
| 25% Spare Area | |||||||||
Now this is a bit surprising. I expected a tightly clustered group of IOs like we got with the LAMD based Corsair Neutron, but instead we see something different entirely. There's a clustering of IOs around the absolute minimum performance, but it looks like the controller is constantly striving for better performance. If there's any indication that Seagate's firmware is obviously different than what Corsair uses, this is it. If we look at the 400GB Seagate 600 Pro we get a good feel for what happens with further over provisioning. The 400GB Pro maintains consistently high performance for longer than the 480GB 600, and when it falls off the minimums are also higher as you'd expect.
 |
|||||||||
| Corsair Neutron 240GB | Crucial M500 960GB | Samsung SSD 840 Pro 256GB | Seagate 600 480GB | Seagate 600 Pro 400GB | |||||
| Default | |||||||||
| 25% Spare Area | |||||||||
Zooming in, the Seagate 600 definitely doesn't look bad - it's far better than the Samsung or Crucial offerings, but still obviously short of Corsair's Neutron. I almost wonder if Seagate prioritized peak performance a bit here in order to be more competitive in most client benchmarks.
 |
|||||||||
| Corsair Neutron 240GB | Crucial M500 960GB | Samsung SSD 840 Pro 256GB | Seagate 600 480GB | Seagate 600 Pro 400GB | |||||
| Default | |||||||||
| 25% Spare Area | |||||||||
The situation really looks a lot worse than it is here. The 600's performance isn't very consistent, but there's a clear floor at just above 5000 IOPS which is quite respectable. Compared to the Crucial and Samsung drives, the 600/600 Pro offer much better performance consistency. I do wish that Seagate had managed to deliver even more consistent performance given that we know what the controller is capable of. For client usage I suspect this won't matter, but in random write heavy enterprise workloads with large RAID arrays it isn't desirable behavior.


59 Comments
View All Comments
JDG1980 - Tuesday, May 7, 2013 - link
Personally, I'd be reluctant to go with any brand except Intel and Samsung for SSDs. There have just been too many issues with the other vendors. Maybe Crucial's Marvell-based products, but absolutely not anything based on SandForce - they seem to have more reliability problems than all the other controllers put together.Kristian Vättö - Tuesday, May 7, 2013 - link
Well, Intel's current consumer-grade SSDs are all based on SandForce. In the beginning SandForce definitely had a ton of issues but keep in mind that the SF-2281 is a two-year-old controller - a lot has happened in that time.Then again, I agree that going with something non-SF is better choice because the pricing of SF SSDs isn't exceptionally good (e.g. Samsung SSD 840 is often the cheapest choice). I wouldn't rule out Plextor from the list of good candidates though.
DanNeely - Tuesday, May 7, 2013 - link
Assuming no problems turn up in the next few months I'm probably going to buy a Crucial M500 - 1TB model. I've gone from a $280 120GB SSD to a $330 256GB one and filled both in about 18 months. Skipping the 500GB class entirely should let me go 3 or 4 years before running out of space while also giving enough flash capacity that I can pull my ~200GB of media onto my SSD. As an added bonus this will save ~$100 by allowing me to avoid a precautionary replacement the 5 year old HDD in my system. Overall it's an extra $150 upfront; but will avoid probably spending $300 in 2 years when I'd overflow the smaller SSD and having everything located on a single drive keeps things simpler to admin.Oxford Guy - Wednesday, May 8, 2013 - link
Not true. If you look at slickdeals you'll see SF drives for the same or less than the TLC 840 drives.Shark321 - Tuesday, May 7, 2013 - link
The Destroyer rocks! The first really meaningful SSD test for power users!hp79 - Tuesday, May 7, 2013 - link
For the Seagate 600, did they mistakenly swap the "idle power" usage (1.1W) with the "operating power" usage (0.75W) on the chart?melgross - Tuesday, May 7, 2013 - link
There's really no need for Seagate and WD to be first, or even early. Right now, HDD's are still the main storage component of the industry. Let them observe the mistakes made by others and come up with better products, as this one seems to be. They've got time.James5mith - Tuesday, May 7, 2013 - link
I would still love to see either the older "Optimus" series or the latest 2TB SAS series of SSD's from Smart put through the Anandtech wringer to see how they compare. If it's true that the new 2TB SAS drives are going to be $4000, that's $2/GB for enterprise grade MLC SAS ssds. That's something to take notice of.rms - Tuesday, May 7, 2013 - link
'indirection tablets' this phrase makes no sense to me; a typo? If not, please add an explanatory ellipsis for it!MrSpadge - Tuesday, May 7, 2013 - link
It should be "tables", not "tablets".