The Seagate 600 & 600 Pro SSD Review
by Anand Lal Shimpi on May 7, 2013 8:00 AM ESTPerformance Consistency
In our Intel SSD DC S3700 review I introduced a new method of characterizing performance: looking at the latency of individual operations over time. The S3700 promised a level of performance consistency that was unmatched in the industry, and as a result needed some additional testing to show that. The reason we don't have consistent IO latency with SSDs is because inevitably all controllers have to do some amount of defragmentation or garbage collection in order to continue operating at high speeds. When and how an SSD decides to run its defrag and cleanup routines directly impacts the user experience. Frequent (borderline aggressive) cleanup generally results in more stable performance, while delaying that can result in higher peak performance at the expense of much lower worst case performance. The graphs below tell us a lot about the architecture of these SSDs and how they handle internal defragmentation.
To generate the data below I took a freshly secure erased SSD and filled it with sequential data. This ensures that all user accessible LBAs have data associated with them. Next I kicked off a 4KB random write workload across all LBAs at a queue depth of 32 using incompressible data. I ran the test for just over half an hour, no where near what we run our steady state tests for but enough to give me a good look at drive behavior once all spare area filled up.
I recorded instantaneous IOPS every second for the duration of the test. I then plotted IOPS vs. time and generated the scatter plots below. Each set of graphs features the same scale. The first two sets use a log scale for easy comparison, while the last set of graphs uses a linear scale that tops out at 50K IOPS for better visualization of differences between drives.
The high level testing methodology remains unchanged from our S3700 review. Unlike in previous reviews however, I did vary the percentage of the drive that I filled/tested depending on the amount of spare area I was trying to simulate. The buttons are labeled with the advertised user capacity had the SSD vendor decided to use that specific amount of spare area. If you want to replicate this on your own all you need to do is create a partition smaller than the total capacity of the drive and leave the remaining space unused to simulate a larger amount of spare area. The partitioning step isn't absolutely necessary in every case but it's an easy way to make sure you never exceed your allocated spare area. It's a good idea to do this from the start (e.g. secure erase, partition, then install Windows), but if you are working backwards you can always create the spare area partition, format it to TRIM it, then delete the partition. Finally, this method of creating spare area works on the drives we've tested here but not all controllers may behave the same way.
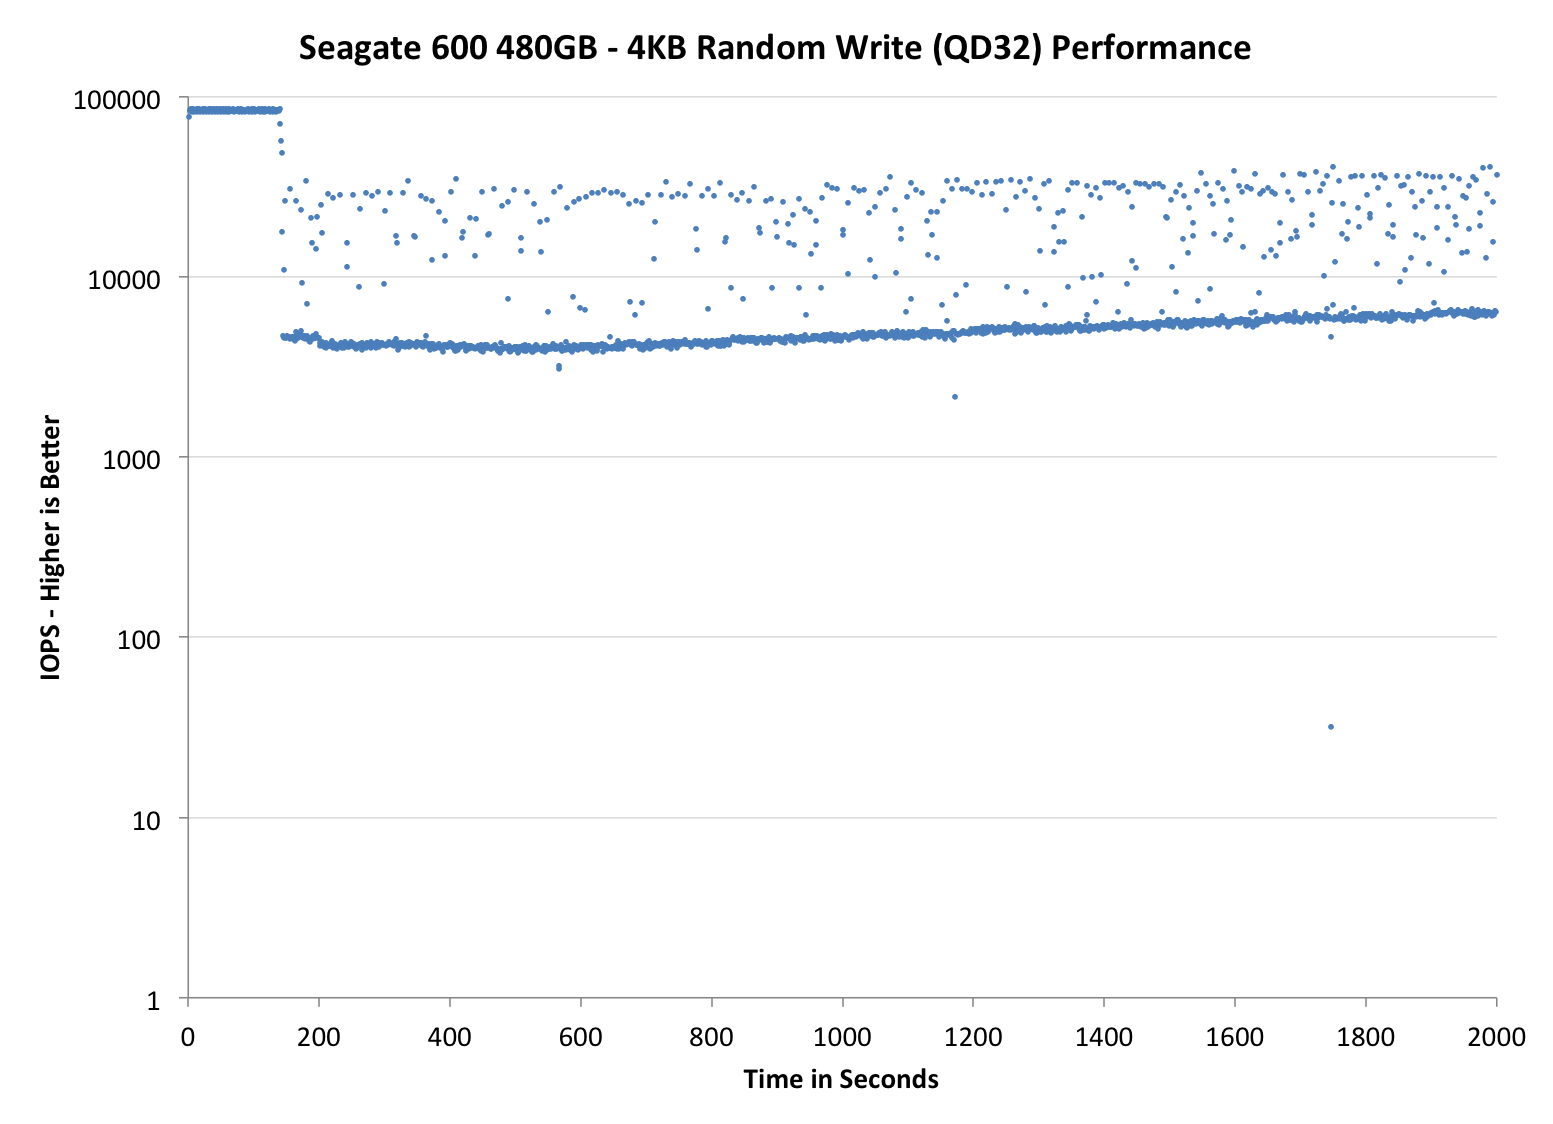
The first set of graphs shows the performance data over the entire 2000 second test period. In these charts you'll notice an early period of very high performance followed by a sharp dropoff. What you're seeing in that case is the drive allocating new blocks from its spare area, then eventually using up all free blocks and having to perform a read-modify-write for all subsequent writes (write amplification goes up, performance goes down).
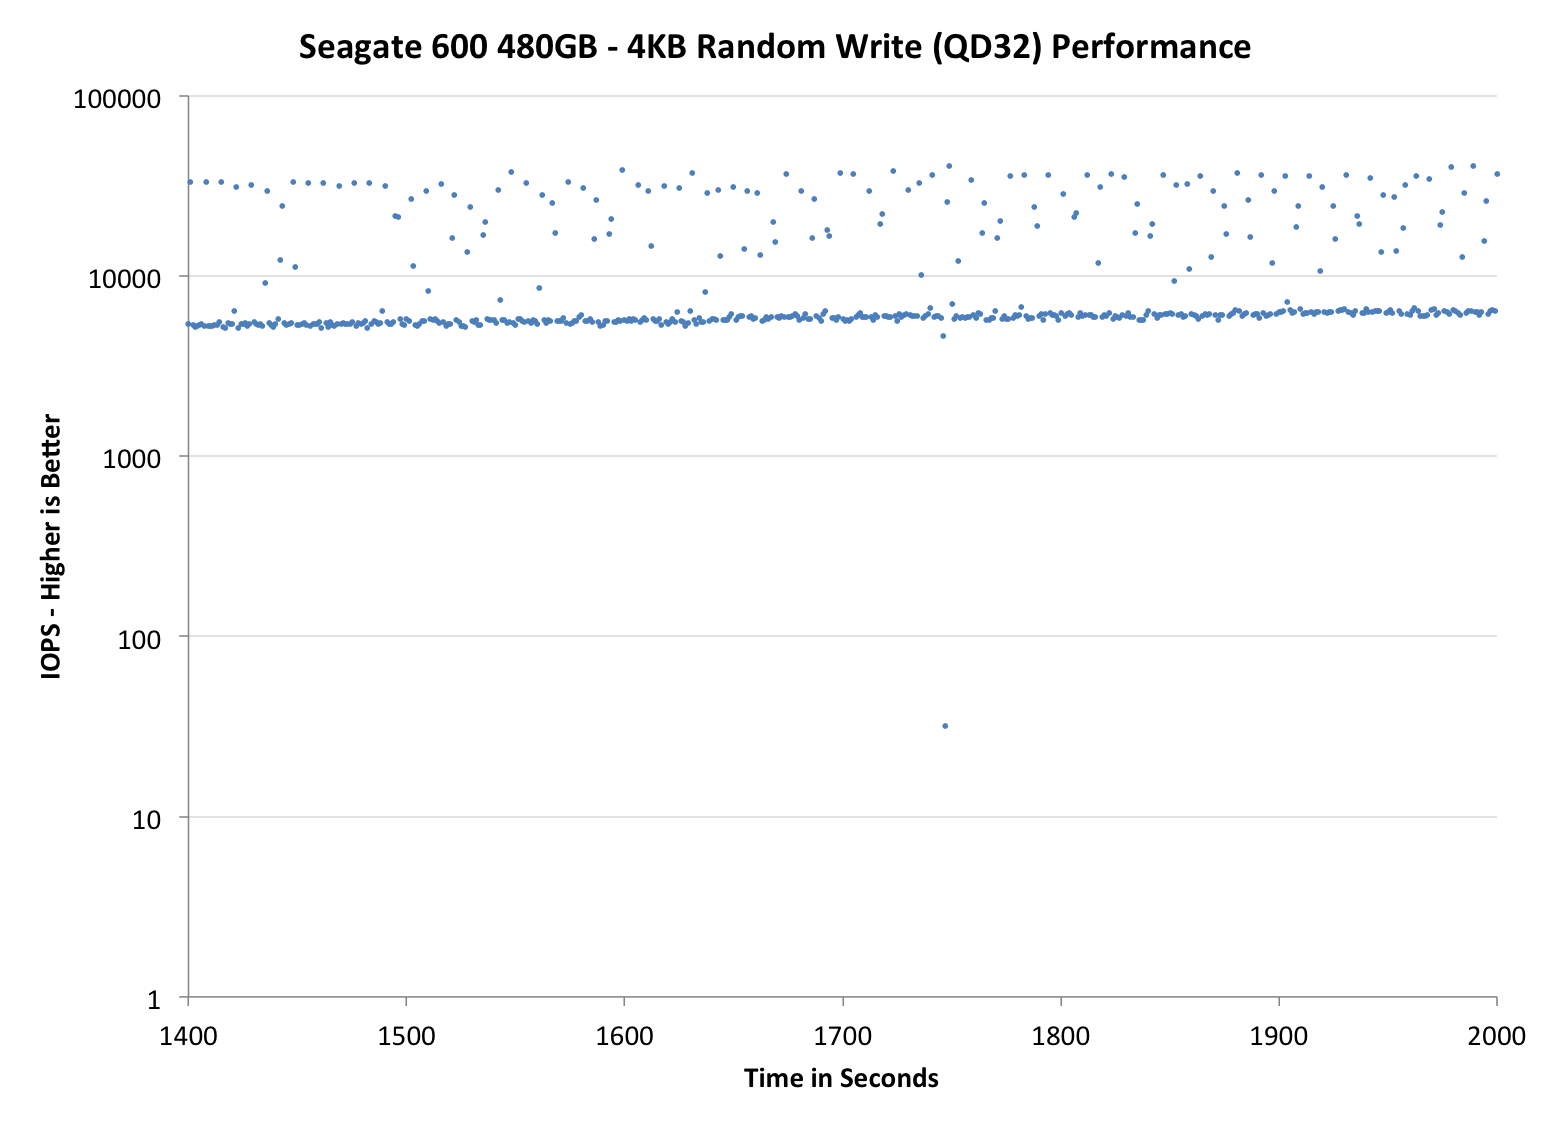
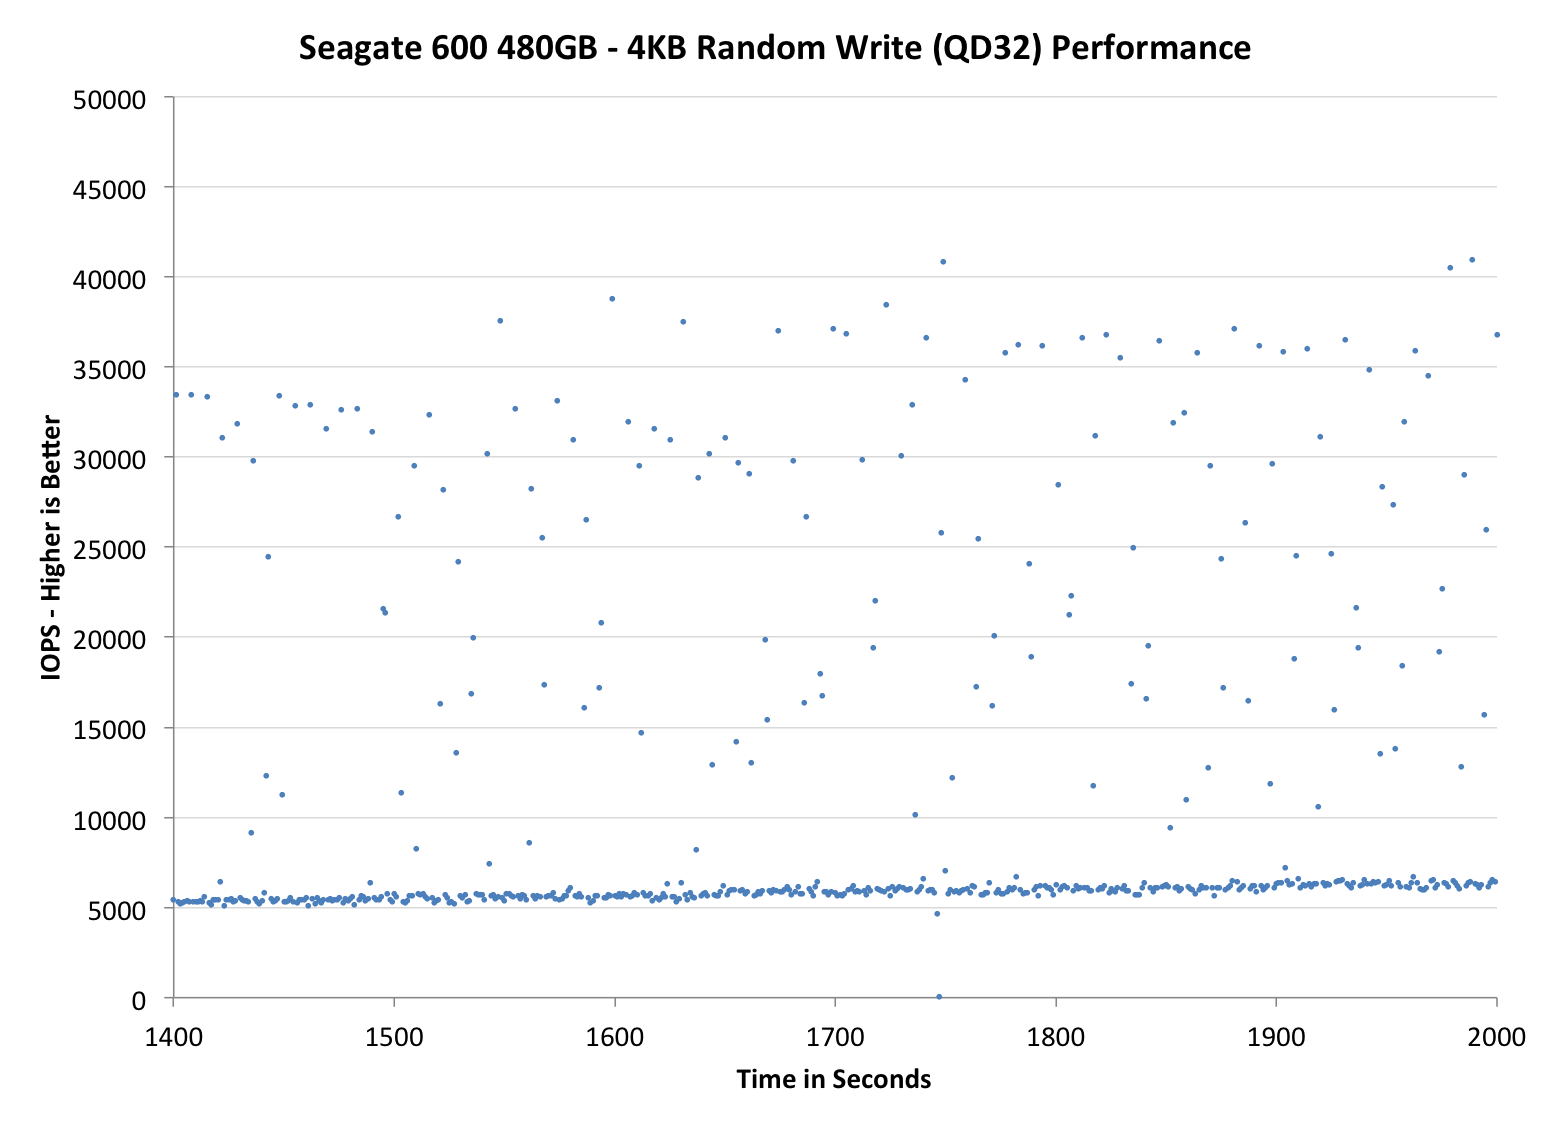
The second set of graphs zooms in to the beginning of steady state operation for the drive (t=1400s). The third set also looks at the beginning of steady state operation but on a linear performance scale. Click the buttons below each graph to switch source data.
 |
|||||||||
| Corsair Neutron 240GB | Crucial M500 960GB | Samsung SSD 840 Pro 256GB | Seagate 600 480GB | Seagate 600 Pro 400GB | |||||
| Default | |||||||||
| 25% Spare Area | |||||||||
Now this is a bit surprising. I expected a tightly clustered group of IOs like we got with the LAMD based Corsair Neutron, but instead we see something different entirely. There's a clustering of IOs around the absolute minimum performance, but it looks like the controller is constantly striving for better performance. If there's any indication that Seagate's firmware is obviously different than what Corsair uses, this is it. If we look at the 400GB Seagate 600 Pro we get a good feel for what happens with further over provisioning. The 400GB Pro maintains consistently high performance for longer than the 480GB 600, and when it falls off the minimums are also higher as you'd expect.
 |
|||||||||
| Corsair Neutron 240GB | Crucial M500 960GB | Samsung SSD 840 Pro 256GB | Seagate 600 480GB | Seagate 600 Pro 400GB | |||||
| Default | |||||||||
| 25% Spare Area | |||||||||
Zooming in, the Seagate 600 definitely doesn't look bad - it's far better than the Samsung or Crucial offerings, but still obviously short of Corsair's Neutron. I almost wonder if Seagate prioritized peak performance a bit here in order to be more competitive in most client benchmarks.
 |
|||||||||
| Corsair Neutron 240GB | Crucial M500 960GB | Samsung SSD 840 Pro 256GB | Seagate 600 480GB | Seagate 600 Pro 400GB | |||||
| Default | |||||||||
| 25% Spare Area | |||||||||
The situation really looks a lot worse than it is here. The 600's performance isn't very consistent, but there's a clear floor at just above 5000 IOPS which is quite respectable. Compared to the Crucial and Samsung drives, the 600/600 Pro offer much better performance consistency. I do wish that Seagate had managed to deliver even more consistent performance given that we know what the controller is capable of. For client usage I suspect this won't matter, but in random write heavy enterprise workloads with large RAID arrays it isn't desirable behavior.


59 Comments
View All Comments
Kristian Vättö - Tuesday, May 7, 2013 - link
The units we have are all based on the older 24nm NAND. A while back I asked Corsair for review samples of the 128/256GB Neutrons (the original ones are 120/240) but they said they are not sampling them (yet). I can ask if they have changed their mind, although there shouldn't be much difference since 19nm Toshiba NAND has the same page/block/die size as 24nm.FunBunny2 - Tuesday, May 7, 2013 - link
Does "Toshiba" mean toggle-mode NAND, by definition? Or do they sell all types?Kristian Vättö - Wednesday, May 8, 2013 - link
Yes, Toshiba uses Toggle-Mode interface for their NAND. Here's the breakdown of NAND interfaces and manufacturers:Toggle-Mode: Toshiba/SanDisk (joint-venture) & Samsung
ONFI: Intel/Micron (aka IMFT, also a joint-venture) & Hynix
LtGoonRush - Tuesday, May 7, 2013 - link
HardOCP showed pretty significant performance increases, though that could also be due to the new firmware (which is not being back-ported as I understand).romrunning - Tuesday, May 7, 2013 - link
I really wish we had more tests of SSDs in RAID-5 arrays. This is really useful for SMBs who may not want/afford a SAN. I'm very curious to see if the 20% spare area affects SSDs just as much when they're RAIDed together as it does standalone. I also don't care of the SSDs are branded as being "enterprise" drives. It would be nice to see how a 5x256GB Samsung 840 Pro RAID-5 array would peform, or even a 5x400GB Seagate 600 Pro RAID-5 array.FunBunny2 - Tuesday, May 7, 2013 - link
No legitimate RDBMS vendor would allow its database on a RAID-5 machine. Never. Never. Never.romrunning - Wednesday, May 8, 2013 - link
I can't tell if you're just trolling or you're actually serious. Obviously, SMBs use RAID-5 arrays ALL the time, and they use "legitimate" database products like MS-SQL, etc. It doesn't have to be an IBM AIX server running DB2, or anything high-end.daniel_mayes - Wednesday, May 8, 2013 - link
What is FunBunny2 talking about? What Raid would you want to run them on 1,5,6,10, no ssd's?You aren't the only one that want's to see more tests with SSD's in a Raid 5. I would also like to see the destroyer run on ssd's with a higher provision and please add Intel DC S3700 to the destroyer benchmark next.
FunBunny2 - Wednesday, May 8, 2013 - link
"I always have found that based on those requirements RAID 5 requires more spindles to satisfy those requirements than RAID 10 - and this has been found even with a Read/Write of 9:1. "here: http://sqlblog.com/blogs/linchi_shea/archive/2007/...
(no, that's not me)
Fact is, SSD still writes slower than reads, so what kind of RAID one uses matters. Having a 3NF (or higher) schema is a more productive avenue for performance on SSD, anyways, irregardless. Getting rid of all that bloated [un|de]normalized byte pile will allow, in most cases, you to have a much smaller database, and thus not worry about bunches and bunches of discs.
romrunning - Friday, May 10, 2013 - link
That blog is from 2007, and SSDs weren't really in the picture at all. It has been demonstrated how SSDs can trump spinning disks in virtually all I/O-bound operations. The man in the blog even showed a test of RAID-5 beating RAID-10 on the same hardware, so his test was in direct contradiction to the one who later commented about spindles.That being said, I think you're trying to say that getting rid of unnecessary in your database will result in a smaller database & thus lower performance requirements. That might be true at one point, but when you've normalized your data already, then additional data will just make the database grow. After all, if you're writing something like electronic orders to your normalized database, it will grow based upon real data addition. That's why you need to make sure your storage array can handle the increased load.
RAID-5 has been the best for SMBs because it provide the fault-tolerance and the higher utilization of total storage capacity that they want. That's why I would like to see tests of SSDs in RAID-5 arrays - to get Anandtech to test these great SSD performers in something I could use in a database server. Something like their tests of their own website databases would be nice, or even smaller ones using a 10-20GB database.