The Crucial/Micron M500 Review (960GB, 480GB, 240GB, 120GB)
by Anand Lal Shimpi on April 9, 2013 9:59 AM ESTAnandTech Storage Bench 2011
Two years ago we introduced our AnandTech Storage Bench, a suite of benchmarks that took traces of real OS/application usage and played them back in a repeatable manner. I assembled the traces myself out of frustration with the majority of what we have today in terms of SSD benchmarks.
Although the AnandTech Storage Bench tests did a good job of characterizing SSD performance, they weren't stressful enough. All of the tests performed less than 10GB of reads/writes and typically involved only 4GB of writes specifically. That's not even enough exceed the spare area on most SSDs. Most canned SSD benchmarks don't even come close to writing a single gigabyte of data, but that doesn't mean that simply writing 4GB is acceptable.
Originally I kept the benchmarks short enough that they wouldn't be a burden to run (~30 minutes) but long enough that they were representative of what a power user might do with their system.
Not too long ago I tweeted that I had created what I referred to as the Mother of All SSD Benchmarks (MOASB). Rather than only writing 4GB of data to the drive, this benchmark writes 106.32GB. It's the load you'd put on a drive after nearly two weeks of constant usage. And it takes a *long* time to run.
1) The MOASB, officially called AnandTech Storage Bench 2011 - Heavy Workload, mainly focuses on the times when your I/O activity is the highest. There is a lot of downloading and application installing that happens during the course of this test. My thinking was that it's during application installs, file copies, downloading and multitasking with all of this that you can really notice performance differences between drives.
2) I tried to cover as many bases as possible with the software I incorporated into this test. There's a lot of photo editing in Photoshop, HTML editing in Dreamweaver, web browsing, game playing/level loading (Starcraft II & WoW are both a part of the test) as well as general use stuff (application installing, virus scanning). I included a large amount of email downloading, document creation and editing as well. To top it all off I even use Visual Studio 2008 to build Chromium during the test.
The test has 2,168,893 read operations and 1,783,447 write operations. The IO breakdown is as follows:
| AnandTech Storage Bench 2011 - Heavy Workload IO Breakdown | ||||
| IO Size | % of Total | |||
| 4KB | 28% | |||
| 16KB | 10% | |||
| 32KB | 10% | |||
| 64KB | 4% | |||
Only 42% of all operations are sequential, the rest range from pseudo to fully random (with most falling in the pseudo-random category). Average queue depth is 4.625 IOs, with 59% of operations taking place in an IO queue of 1.
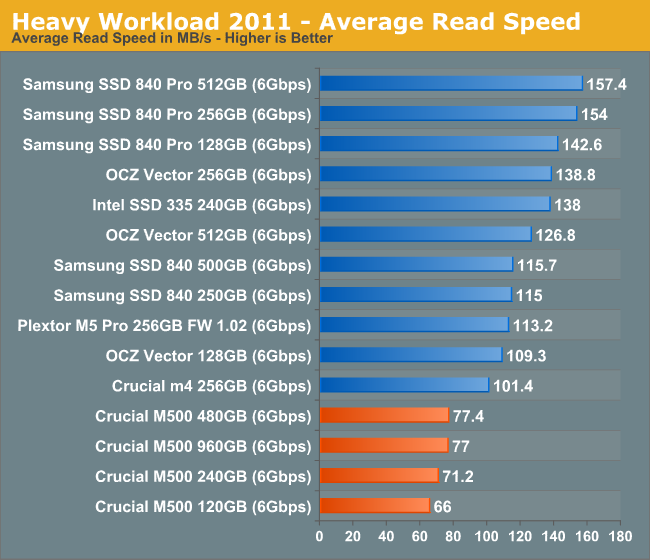
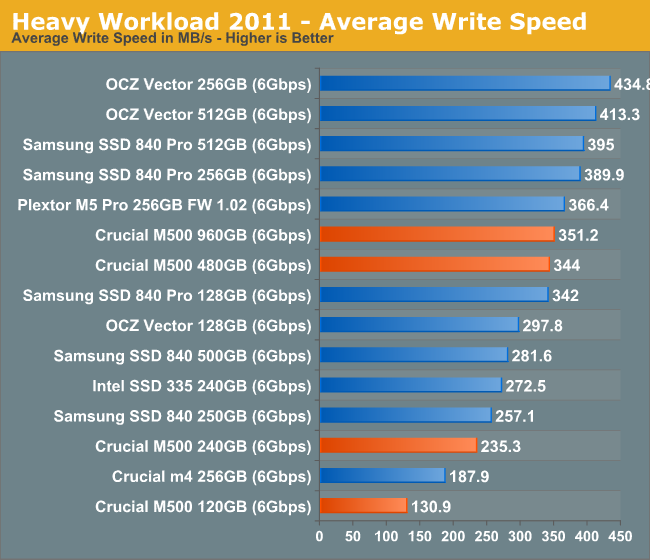
Many of you have asked for a better way to really characterize performance. Simply looking at IOPS doesn't really say much. As a result I'm going to be presenting Storage Bench 2011 data in a slightly different way. We'll have performance represented as Average MB/s, with higher numbers being better. At the same time I'll be reporting how long the SSD was busy while running this test. These disk busy graphs will show you exactly how much time was shaved off by using a faster drive vs. a slower one during the course of this test. Finally, I will also break out performance into reads, writes and combined. The reason I do this is to help balance out the fact that this test is unusually write intensive, which can often hide the benefits of a drive with good read performance.
There's also a new light workload for 2011. This is a far more reasonable, typical every day use case benchmark. Lots of web browsing, photo editing (but with a greater focus on photo consumption), video playback as well as some application installs and gaming. This test isn't nearly as write intensive as the MOASB but it's still multiple times more write intensive than what we were running in 2010.
As always I don't believe that these two benchmarks alone are enough to characterize the performance of a drive, but hopefully along with the rest of our tests they will help provide a better idea.
The testbed for Storage Bench 2011 has changed as well. We're now using a Sandy Bridge platform with full 6Gbps support for these tests.
AnandTech Storage Bench 2011 - Heavy Workload
We'll start out by looking at average data rate throughout our new heavy workload test:
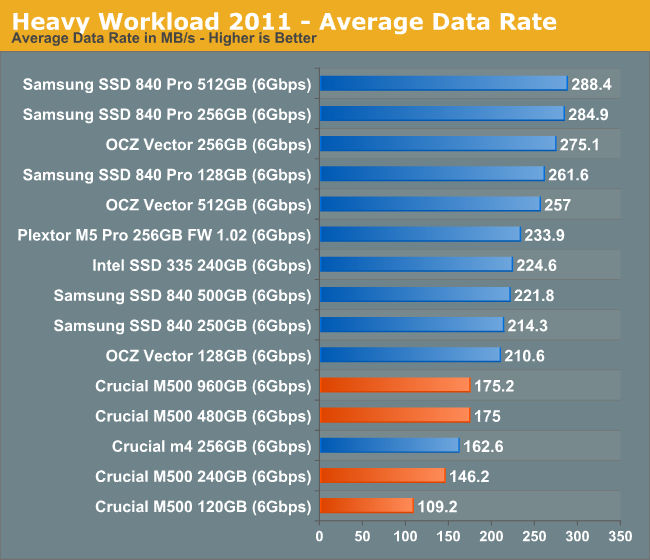
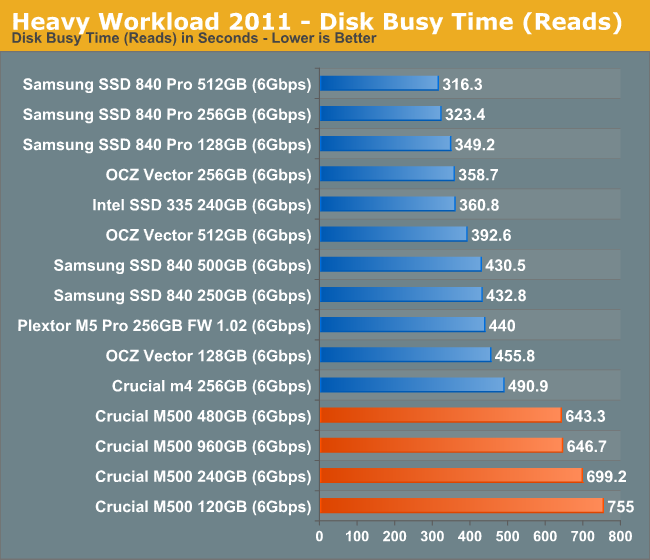
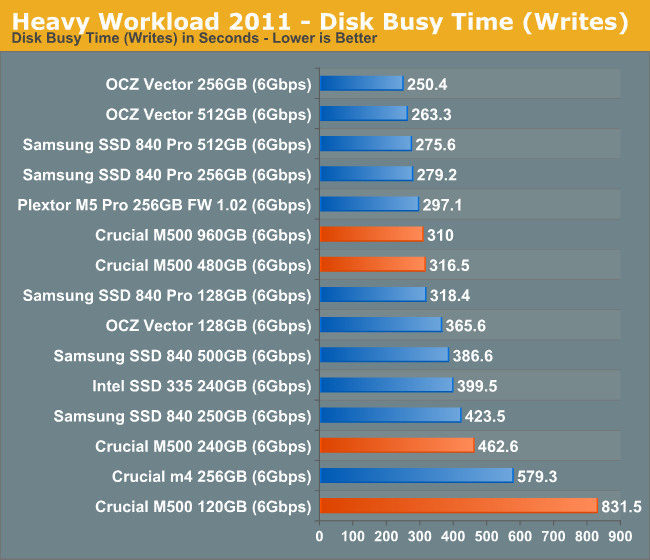
Our heavy workload from 2011 illustrates the culmination of everything we've shown thus far: the M500 can even be slower than the outgoing m4. There's no doubt in my mind that this is a result of the tradeoffs associated with moving to 128Gbit NAND die. The M500's performance is by no means bad, but it's definitely below what we've come to expect from Intel and Samsung flagships.
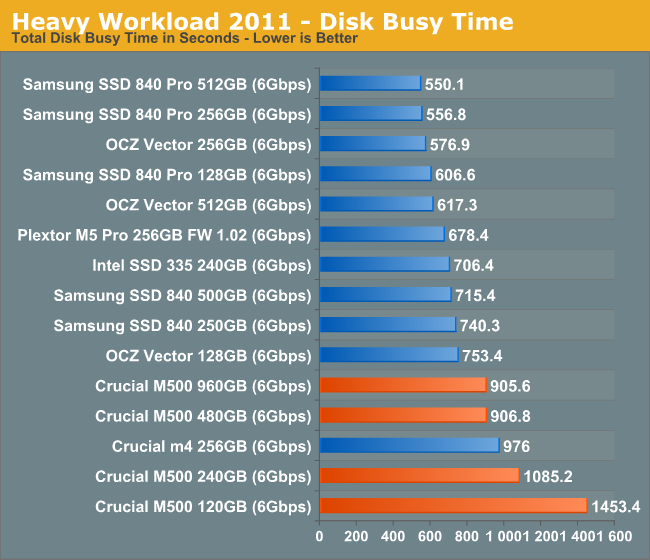
The next three charts just represent the same data, but in a different manner. Instead of looking at average data rate, we're looking at how long the disk was busy for during this entire test. Note that disk busy time excludes any and all idles, this is just how long the SSD was busy doing something:


111 Comments
View All Comments
gochichi - Wednesday, April 10, 2013 - link
Crucial is in a unique position. I don't think people care about performance numbers. What we know is that SSD s are either a nightmare or a dream. What we want is a dream. People want simple understandable marketing.My favorite SSD so far is a Monster Digital 240gb Daytona. It has been absolutely flawless. But the 120 gb version is a lemon. Reselling the drive would never happen. Monster Digital is probably not going to be a player in the SSD market going forward.
My point is, what's at stake here is who's the next Seagate? The next Western Digital? Of SSDs. Samsung can do no wrong, much like Apple. And yet this weird little company called Crucial has enjoyed tremendous on-the-street notoriety with their M4 series.
As far as I can tell the M4 is a little outdated. My question is why not release an M5? Why 500? Why waste so much consumer goodwill? Is it just that this drive isn't good? Or not good enough for proper successorship?
I don't know why I've purchased crucial drives before, it started with a little 64gb m4. The I just trust the m4 line. My point is why does Crucial carry bad models and why so many confusing numbers? The m4 is a golden opropportunity. Where's that trusty m5 follow up? Samsung has understandable generations and model lines. They're making sure they're the Western Digital of SSD. Why isn't Crucial doing similar?
Solid State Brain - Wednesday, April 10, 2013 - link
The reason why it's M500 and not M5 is probably because of Plextor:http://www.plextor-digital.com/index.php/en/M5-Pro...
Kristian Vättö - Thursday, April 11, 2013 - link
Crucial isn't exactly small, they are a subsidiary of Micron. As said above, Plextor has M5S and M5 Pro SSDs so M5 would have been very confusing, hence the M500. The OEM version of M4 was C400, so it's actually not that confusing.FunBunny2 - Thursday, April 11, 2013 - link
-- My point is, what's at stake here is who's the next Seagate? The next Western Digital? Of SSDs.Getting harder to say. The three well known public companies doing SSD (mostly) as such, STEC, OCZ, Fusion-io, have been missing all targets for a least a couple of quarters. Violin may or may not IPO in the next few months.
The reasonable answer is that there won't be a Seagate or WDC for SSD. It's well understood how to take commodity HDD to Enterprise Drive, using tighter QA and some incrementally better parts at modest cost. With SSD, as this review shows, "progress" in feature shrink isn't improving any of the factors at lower cost. It is quite perverse. The NAND suppliers will come to dominate consumer SSD, with performance asymptotically approaching a bit better than current HDD, with a price premium. Look for TLC, with huge erase blocks, long latencies, slowing controllers (having to do all that much more work to get around the NAND).
Enterprise SSD will likely fade away, to be replaced by NAND arrays, along the line of the Sun/Oracle device, which has been around for a few years.
dilidolo - Wednesday, April 10, 2013 - link
Everyone else mentioned Super Cap in M500 but not here. I just want to confirm if it's true.Tjalve - Friday, April 12, 2013 - link
Therte seems to be capacitors on the drive. But i would like to know aswell.klmccaughey - Thursday, April 11, 2013 - link
The pricing is WAY off. £274 ($420) for 240GB one in the UK!!! They must be mad.philipma1957 - Friday, April 12, 2013 - link
the 960gb was 570 usd at amazon. at your price x 4 it would be $1680. that is a lot of value tax.philipma1957 - Friday, April 12, 2013 - link
I just went on amazon uk the 240gb is 168 pounds the 480gb is 321 pounds. some what better. then the price you foundKarol Bulova - Saturday, April 13, 2013 - link
I own Samsung 840Pro (it had cash-back recently) so I welcome this comments from articles on Anandtech.'The 840 Pro does an amazing job with 25% additional spare area however, something that can't be said for the M500. '
'if you simply set aside 25% of the total NAND capacity as spare area' performance improves'
I am running Win8 64bit with TRIM enabled - what is unclear for me though, is:
1. is spare are just free not occupied space on the HDD (e.g. when it is not full)
2. or is it just un-formatted partition (without a filesystem - thus no files expect for header)
3. or there shouldn't be any partition at all - and drive will somehow figure it up that I just magically allocated spare area
Or is there some utility for Samsung to do spare area? Please advice - from what I understand I should reinstall windows and choose 192GB as my main drive capacity instead of full!