The Crucial/Micron M500 Review (960GB, 480GB, 240GB, 120GB)
by Anand Lal Shimpi on April 9, 2013 9:59 AM ESTAnandTech Storage Bench 2011
Two years ago we introduced our AnandTech Storage Bench, a suite of benchmarks that took traces of real OS/application usage and played them back in a repeatable manner. I assembled the traces myself out of frustration with the majority of what we have today in terms of SSD benchmarks.
Although the AnandTech Storage Bench tests did a good job of characterizing SSD performance, they weren't stressful enough. All of the tests performed less than 10GB of reads/writes and typically involved only 4GB of writes specifically. That's not even enough exceed the spare area on most SSDs. Most canned SSD benchmarks don't even come close to writing a single gigabyte of data, but that doesn't mean that simply writing 4GB is acceptable.
Originally I kept the benchmarks short enough that they wouldn't be a burden to run (~30 minutes) but long enough that they were representative of what a power user might do with their system.
Not too long ago I tweeted that I had created what I referred to as the Mother of All SSD Benchmarks (MOASB). Rather than only writing 4GB of data to the drive, this benchmark writes 106.32GB. It's the load you'd put on a drive after nearly two weeks of constant usage. And it takes a *long* time to run.
1) The MOASB, officially called AnandTech Storage Bench 2011 - Heavy Workload, mainly focuses on the times when your I/O activity is the highest. There is a lot of downloading and application installing that happens during the course of this test. My thinking was that it's during application installs, file copies, downloading and multitasking with all of this that you can really notice performance differences between drives.
2) I tried to cover as many bases as possible with the software I incorporated into this test. There's a lot of photo editing in Photoshop, HTML editing in Dreamweaver, web browsing, game playing/level loading (Starcraft II & WoW are both a part of the test) as well as general use stuff (application installing, virus scanning). I included a large amount of email downloading, document creation and editing as well. To top it all off I even use Visual Studio 2008 to build Chromium during the test.
The test has 2,168,893 read operations and 1,783,447 write operations. The IO breakdown is as follows:
| AnandTech Storage Bench 2011 - Heavy Workload IO Breakdown | ||||
| IO Size | % of Total | |||
| 4KB | 28% | |||
| 16KB | 10% | |||
| 32KB | 10% | |||
| 64KB | 4% | |||
Only 42% of all operations are sequential, the rest range from pseudo to fully random (with most falling in the pseudo-random category). Average queue depth is 4.625 IOs, with 59% of operations taking place in an IO queue of 1.
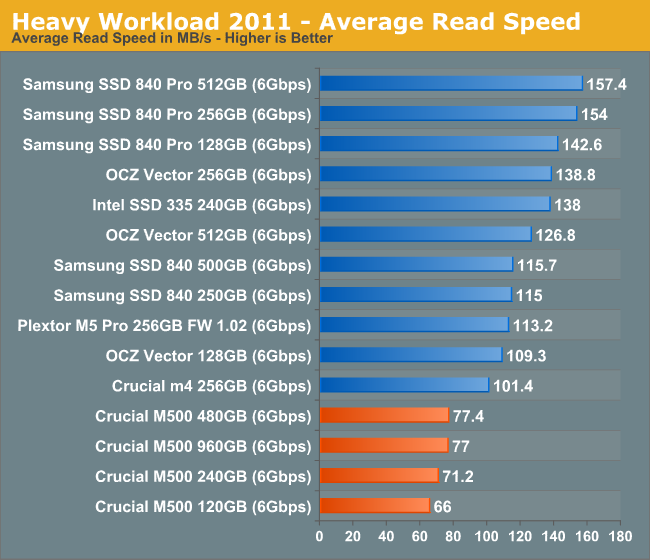
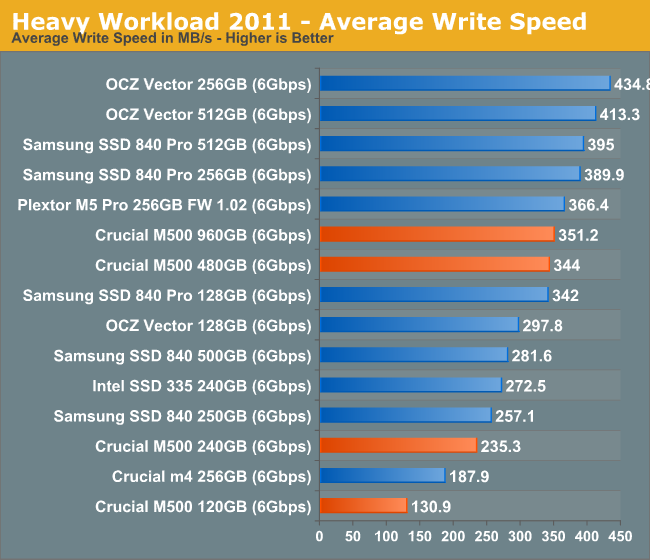
Many of you have asked for a better way to really characterize performance. Simply looking at IOPS doesn't really say much. As a result I'm going to be presenting Storage Bench 2011 data in a slightly different way. We'll have performance represented as Average MB/s, with higher numbers being better. At the same time I'll be reporting how long the SSD was busy while running this test. These disk busy graphs will show you exactly how much time was shaved off by using a faster drive vs. a slower one during the course of this test. Finally, I will also break out performance into reads, writes and combined. The reason I do this is to help balance out the fact that this test is unusually write intensive, which can often hide the benefits of a drive with good read performance.
There's also a new light workload for 2011. This is a far more reasonable, typical every day use case benchmark. Lots of web browsing, photo editing (but with a greater focus on photo consumption), video playback as well as some application installs and gaming. This test isn't nearly as write intensive as the MOASB but it's still multiple times more write intensive than what we were running in 2010.
As always I don't believe that these two benchmarks alone are enough to characterize the performance of a drive, but hopefully along with the rest of our tests they will help provide a better idea.
The testbed for Storage Bench 2011 has changed as well. We're now using a Sandy Bridge platform with full 6Gbps support for these tests.
AnandTech Storage Bench 2011 - Heavy Workload
We'll start out by looking at average data rate throughout our new heavy workload test:
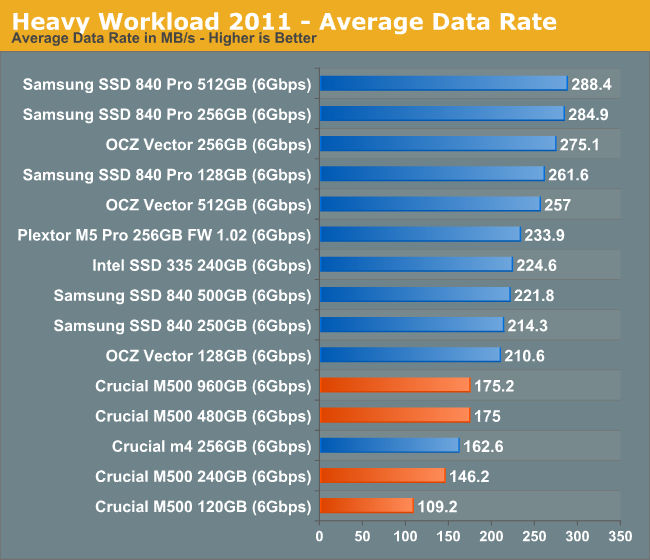
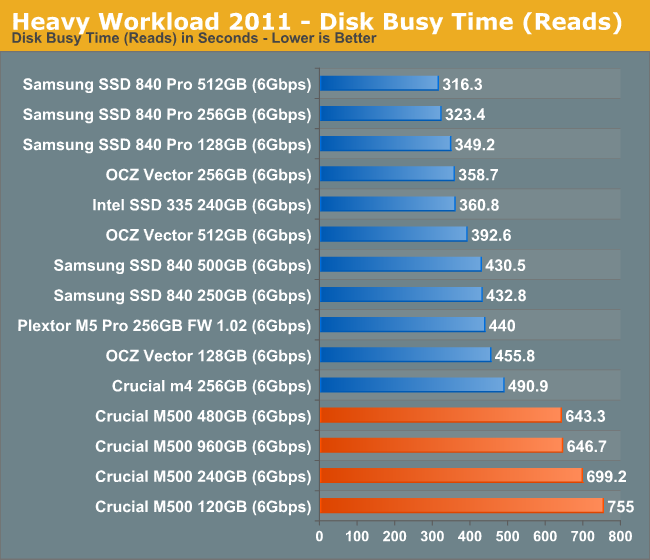
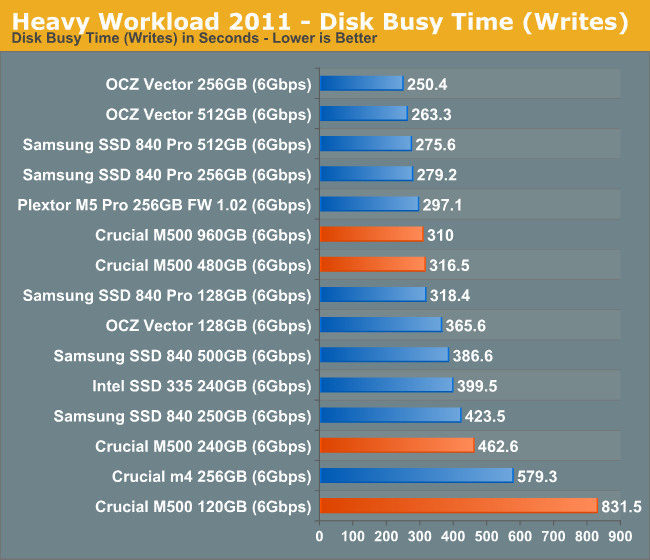
Our heavy workload from 2011 illustrates the culmination of everything we've shown thus far: the M500 can even be slower than the outgoing m4. There's no doubt in my mind that this is a result of the tradeoffs associated with moving to 128Gbit NAND die. The M500's performance is by no means bad, but it's definitely below what we've come to expect from Intel and Samsung flagships.
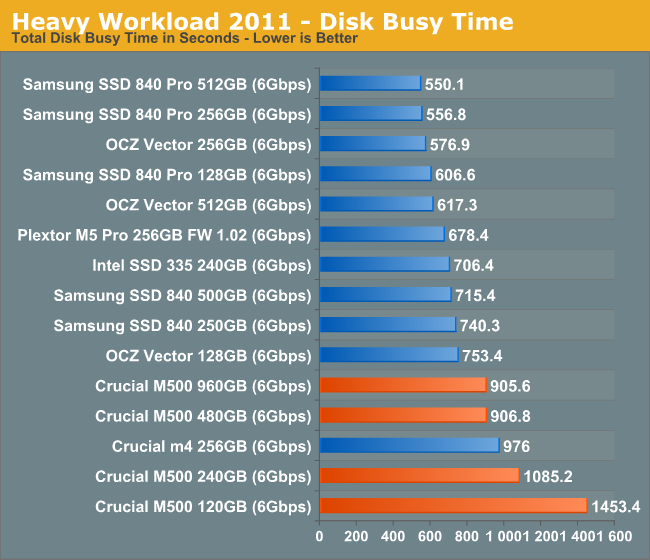
The next three charts just represent the same data, but in a different manner. Instead of looking at average data rate, we're looking at how long the disk was busy for during this entire test. Note that disk busy time excludes any and all idles, this is just how long the SSD was busy doing something:


111 Comments
View All Comments
RU482 - Tuesday, April 9, 2013 - link
I have had an M500 mSATA 120GB running Anvil Storage Utilities for a couple weeks now. Like the Intel 535 30GB and 240GB, the M500 120GB is slower and runs hotter than Sandisk 64GB X100 and x110 evals I'm also testingteiglin - Tuesday, April 9, 2013 - link
How long would it take to run the Destroyer on a HDD? Or is that too depressing to consider? :)andrew-1983 - Tuesday, April 9, 2013 - link
The AS-SSD incompressible sequential read numbers seem rather low, in other reviews it's around 490MB/s, not 390, both for the 960GB and the 480GB size. Or am I missing something?philipma1957 - Tuesday, April 9, 2013 - link
I am waiting on my 960gb an amazon preorder. I will build a mac mini fusion with the 1tb hgst 7200 rpm hdd. my quad 2.3 mini will also have 16gb ram kingston plug n play.philipma1957 - Wednesday, April 17, 2013 - link
all my gear came on tues I set up the mini and it now has a 1.96tb fusion drive. very nice machine with a very nice ssd.danielmorris - Tuesday, April 9, 2013 - link
Once you get the new destroyer benchmark done and most of the ssds run through it, I think it would be interesting to run an hdd or two through it. It might take a week or two but it would encourage us who still have an hdd to get an ssd.praftman - Wednesday, April 10, 2013 - link
Recently the MyDigitalSSD was reviewed and it was mentioned a 960GB varient was undergoing review. Here we see:"...the M500 is really the only game in town. ...a good, high-capacity SSD for notebook use and based on my options today, I'd have no issues going with the 960GB M500."
...So does that mean that the MyDigitalSSD 960GB is looking not up to par? At only $800 and with better Idle power consumption it was my first choice.
Also, it is my understanding from the article that the lower Idle figures Micron claims are entirely dependent on these next-gen Haswell laptops and I should see no such difference from your reported ~1w with my 2012 MBP...correct?
praftman - Friday, April 12, 2013 - link
?mayankleoboy1 - Wednesday, April 10, 2013 - link
in the Destroyer test, even with so many tasks, the average QD is ~5.5 .That means that for the average desktop usage, the QD is around 1. We need more tests that simulate such low QD usage.
Also, I am curious why are you testing consumer SSD's with a workload that is atleast two orders of magnitude more intensive than what people actually use. Basically, you are testing a client SSD with a Server workload. I dont see what it tests.
What is the use-case of testing such loads on a desktop SSD ?
Tjalve - Wednesday, April 10, 2013 - link
I agree. Thats why ive done some benchmarking of "real world scenarios". I actually recorded HDD activity from three diffrent people who use there computer for three entirley diffrent reasons. One beeing a gamer, one beeing one of the people at the office where I work (outlook, word, powerpoint,firefox) and the last one is recorded from a friend of mine who is a freelance video editor. So the last trace is based on him editing and compiling videos.http://www.nordichardware.se/SSD-Recensioner/svens...
http://www.nordichardware.se/SSD-Recensioner/svens...
http://www.nordichardware.se/SSD-Recensioner/svens...