The Crucial/Micron M500 Review (960GB, 480GB, 240GB, 120GB)
by Anand Lal Shimpi on April 9, 2013 9:59 AM ESTAnandTech Storage Bench 2011
Two years ago we introduced our AnandTech Storage Bench, a suite of benchmarks that took traces of real OS/application usage and played them back in a repeatable manner. I assembled the traces myself out of frustration with the majority of what we have today in terms of SSD benchmarks.
Although the AnandTech Storage Bench tests did a good job of characterizing SSD performance, they weren't stressful enough. All of the tests performed less than 10GB of reads/writes and typically involved only 4GB of writes specifically. That's not even enough exceed the spare area on most SSDs. Most canned SSD benchmarks don't even come close to writing a single gigabyte of data, but that doesn't mean that simply writing 4GB is acceptable.
Originally I kept the benchmarks short enough that they wouldn't be a burden to run (~30 minutes) but long enough that they were representative of what a power user might do with their system.
Not too long ago I tweeted that I had created what I referred to as the Mother of All SSD Benchmarks (MOASB). Rather than only writing 4GB of data to the drive, this benchmark writes 106.32GB. It's the load you'd put on a drive after nearly two weeks of constant usage. And it takes a *long* time to run.
1) The MOASB, officially called AnandTech Storage Bench 2011 - Heavy Workload, mainly focuses on the times when your I/O activity is the highest. There is a lot of downloading and application installing that happens during the course of this test. My thinking was that it's during application installs, file copies, downloading and multitasking with all of this that you can really notice performance differences between drives.
2) I tried to cover as many bases as possible with the software I incorporated into this test. There's a lot of photo editing in Photoshop, HTML editing in Dreamweaver, web browsing, game playing/level loading (Starcraft II & WoW are both a part of the test) as well as general use stuff (application installing, virus scanning). I included a large amount of email downloading, document creation and editing as well. To top it all off I even use Visual Studio 2008 to build Chromium during the test.
The test has 2,168,893 read operations and 1,783,447 write operations. The IO breakdown is as follows:
| AnandTech Storage Bench 2011 - Heavy Workload IO Breakdown | ||||
| IO Size | % of Total | |||
| 4KB | 28% | |||
| 16KB | 10% | |||
| 32KB | 10% | |||
| 64KB | 4% | |||
Only 42% of all operations are sequential, the rest range from pseudo to fully random (with most falling in the pseudo-random category). Average queue depth is 4.625 IOs, with 59% of operations taking place in an IO queue of 1.
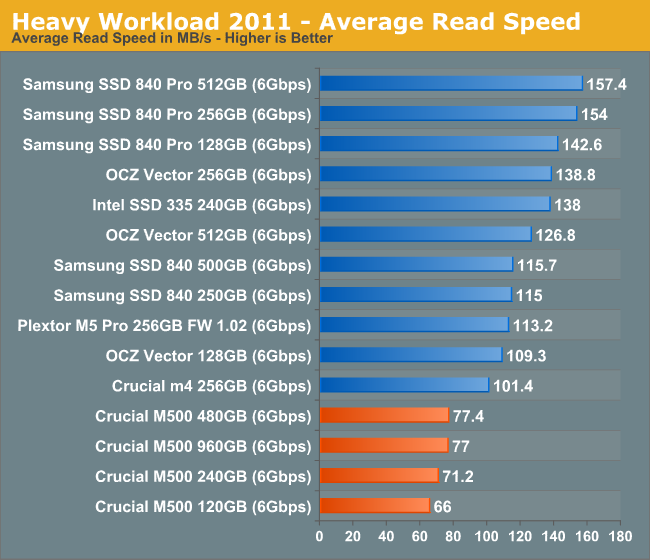
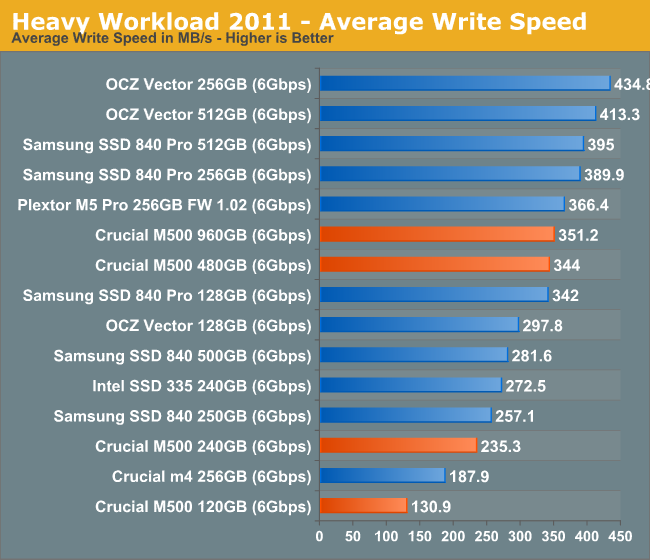
Many of you have asked for a better way to really characterize performance. Simply looking at IOPS doesn't really say much. As a result I'm going to be presenting Storage Bench 2011 data in a slightly different way. We'll have performance represented as Average MB/s, with higher numbers being better. At the same time I'll be reporting how long the SSD was busy while running this test. These disk busy graphs will show you exactly how much time was shaved off by using a faster drive vs. a slower one during the course of this test. Finally, I will also break out performance into reads, writes and combined. The reason I do this is to help balance out the fact that this test is unusually write intensive, which can often hide the benefits of a drive with good read performance.
There's also a new light workload for 2011. This is a far more reasonable, typical every day use case benchmark. Lots of web browsing, photo editing (but with a greater focus on photo consumption), video playback as well as some application installs and gaming. This test isn't nearly as write intensive as the MOASB but it's still multiple times more write intensive than what we were running in 2010.
As always I don't believe that these two benchmarks alone are enough to characterize the performance of a drive, but hopefully along with the rest of our tests they will help provide a better idea.
The testbed for Storage Bench 2011 has changed as well. We're now using a Sandy Bridge platform with full 6Gbps support for these tests.
AnandTech Storage Bench 2011 - Heavy Workload
We'll start out by looking at average data rate throughout our new heavy workload test:
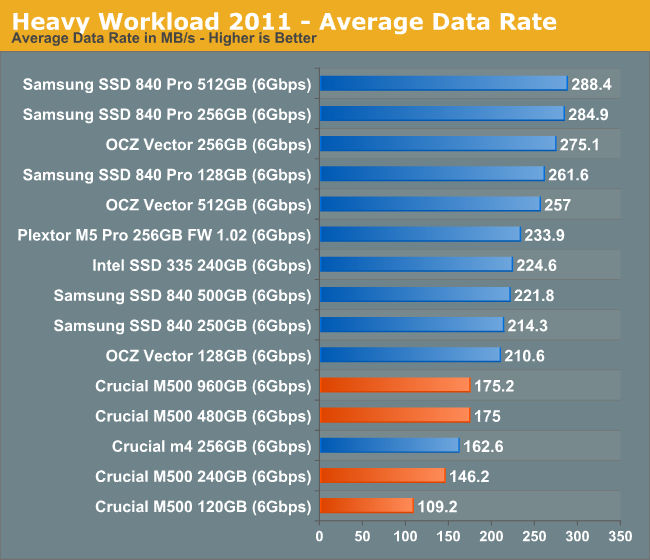
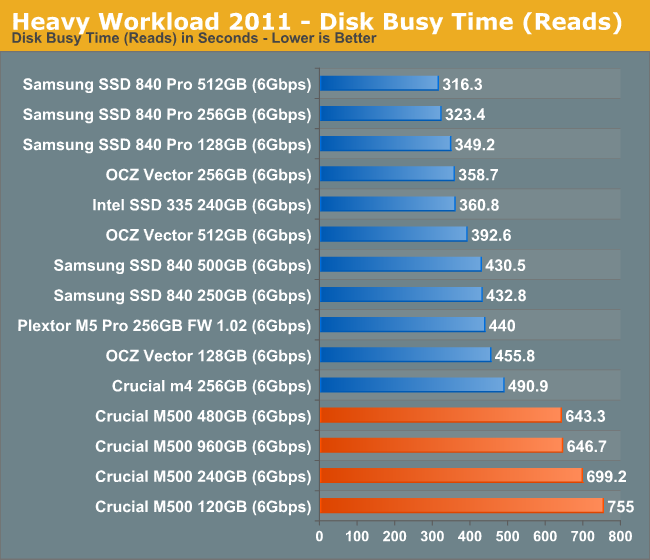
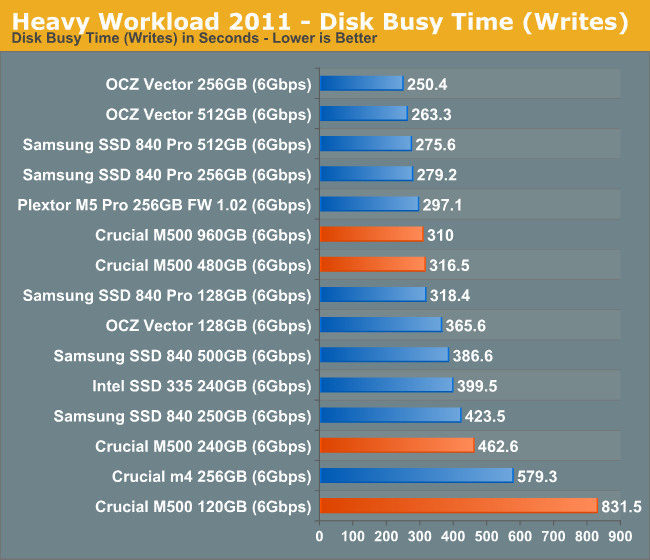
Our heavy workload from 2011 illustrates the culmination of everything we've shown thus far: the M500 can even be slower than the outgoing m4. There's no doubt in my mind that this is a result of the tradeoffs associated with moving to 128Gbit NAND die. The M500's performance is by no means bad, but it's definitely below what we've come to expect from Intel and Samsung flagships.
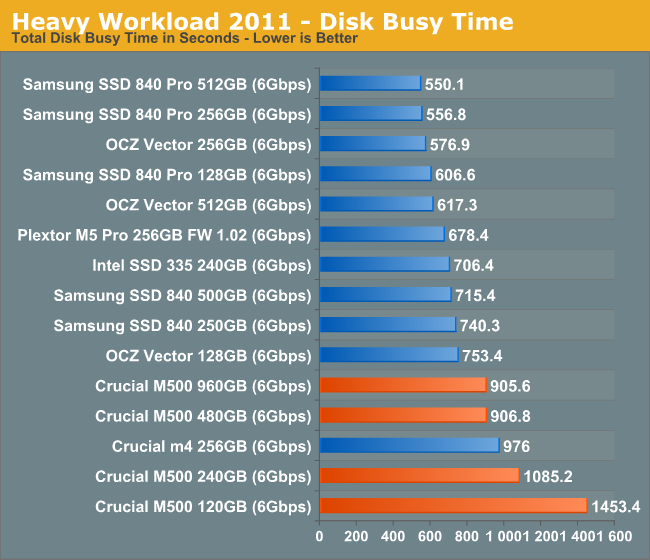
The next three charts just represent the same data, but in a different manner. Instead of looking at average data rate, we're looking at how long the disk was busy for during this entire test. Note that disk busy time excludes any and all idles, this is just how long the SSD was busy doing something:


111 Comments
View All Comments
NCM - Tuesday, April 9, 2013 - link
TRIM support is built into the OS X, but disabled by default for non-Apple drives. As others have pointed out, the freeware utility 'TRIM Enabler' easily takes care of that. The only other thing to know is that some OS X updates may reset TRIM to 'off', so it's as well to check after any update and re-enable it if necessary.I take care of an office full of Macs, including Mac Pros, iMacs, Minis and MacBook Pros, the majority of which have SSDs that I installed. I'm typing this on my 2010 MBP with a 512GB Plextor M3P.
With the price of SSDs now this is a very worthwhile upgrade, and particularly one that offers a new lease on life for older computers.
Bkord123 - Tuesday, April 9, 2013 - link
All of these comments are going to make my wife mad when I buy yet another gadget! I'm not as worried now about the TRIM issue. Btw, does this site have a page that ranks hard drives? I did look and didn't see anything here.jamyryals - Tuesday, April 9, 2013 - link
Anand has a Bench utility you can use to compare devices. Here's two popular reliable drives -http://www.anandtech.com/bench/Product/792?vs=743
glugglug - Tuesday, April 9, 2013 - link
With most SSDs no longer using 4KB pages, does it make sense to have 8KB and 16KB random write tests?Also, does application performance improve if the drives are formatted with an 8KB or 16KB cluster size?
Kristian Vättö - Tuesday, April 9, 2013 - link
Most real world IOs are 4KB.glugglug - Tuesday, April 9, 2013 - link
Not true, even with the default 4KB cluster size the drives get formatted with. If you format with 16KB clusters, *none* of the IOs will be 4KB.Kristian Vättö - Tuesday, April 9, 2013 - link
Based on the workloads we've traced (using default cluster size), 4KB is the most common IO size, although it obviously varies and some workloads may have consist of larger IO sizes. Do you have something that backs up your statement? Would be interesting to see that.glugglug - Tuesday, April 9, 2013 - link
According to the table in the article, for the Anandtech 2011 Heavy Workload, 28% of the IOs are 4KB, not "most".I am thinking that what must happen for a 4KB IO on a drive with 16KB pages is that it has to read the current contents of the 16KB page so that the 4KB being rewritten can be merged into it, then write a 16KB page, so each write really ends up being a read + write operation not just the write by itself.
Worse, when TRIM is used, if the TRIM operation covers only 4KB of the 16KB page, the page can't really be trimmed, because the other 12KB might still be in use; the drive firmware can't know for certain, so having a cluster size match or exceed the drive's page might result in better steady state performance over time because of TRIM not losing track of partial pages.
Tjalve - Wednesday, April 10, 2013 - link
I think there are some caching involved when dealing with writes thats smaller then the page size of the NAND. I would guss that the M500 caches in DRAM. There are other vendors that use the onboard flash for caching. Like Sandisk nCache for example.glugglug - Wednesday, April 10, 2013 - link
For some SSDs that is definately the case. I'm pretty sure Sandforce needed to do it for example, both because the compression makes the size of the flash writes unpredictable, and because if you look at the cluster sizes the chipset supports to go with various obscure controllers its kind of nuts.I don't think that is the case here though, because if you multiple the marketed 4KB random write numbers by 4KB, you pretty much get exactly the sequential write speed, and write-back caching to deal with the smaller writes would result in much better sequential performance.