The Crucial/Micron M500 Review (960GB, 480GB, 240GB, 120GB)
by Anand Lal Shimpi on April 9, 2013 9:59 AM ESTA Preview of The Destroyer, Our 2013 Storage Bench
When I built the AnandTech Heavy and Light Storage Bench suites in 2011 I did so because we didn't have any good tools at the time that would begin to stress a drive's garbage collection routines. Once all blocks have a sufficient number of used pages, all further writes will inevitably trigger some sort of garbage collection/block recycling algorithm. Our Heavy 2011 test in particular was designed to do just this. By hitting the test SSD with a large enough and write intensive enough workload, we could ensure that some amount of GC would happen.
There were a couple of issues with our 2011 tests that I've been wanting to rectify however. First off, all of our 2011 tests were built using Windows 7 x64 pre-SP1, which meant there were potentially some 4K alignment issues that wouldn't exist had we built the trace on a system with SP1. This didn't really impact most SSDs but it proved to be a problem with some hard drives. Secondly, and more recently, I've shifted focus from simply triggering GC routines to really looking at worst case scenario performance after prolonged random IO. For years I'd felt the negative impacts of inconsistent IO performance with all SSDs, but until the S3700 showed up I didn't think to actually measure and visualize IO consistency. The problem with our IO consistency tests are they are very focused on 4KB random writes at high queue depths and full LBA spans, not exactly a real world client usage model. The aspects of SSD architecture that those tests stress however are very important, and none of our existing tests were doing a good job of quantifying that.

I needed an updated heavy test, one that dealt with an even larger set of data and one that somehow incorporated IO consistency into its metrics. I think I've come up with the test, but given the short timeframe for this review (I only got my M500 drives a few days ago) I couldn't get a ton of data ready for you all today. The new benchmark doesn't even have a name, I've just been calling it The Destroyer (although AnandTech Storage Bench 2013 is likely a better fit for PR reasons).
Everything about this new test is bigger and better. The test platform moves to Windows 8 Pro x64. The workload is far more realistic. Just as before, this is an application trace based test - I record all IO requests made to a test system, then play them back on the drive I'm measuring and run statistical analysis on the drive's responses.
Imitating most modern benchmarks I crafted the Destroyer out of a series of scenarios. For this benchmark I focused heavily on Photo editing, Gaming, Virtualization, General Productivity, Video Playback and Application Development. Rough descriptions of the various scenarios are in the table below:
| AnandTech Storage Bench 2013 Preview - The Destroyer | ||||||||||||
| Workload | Description | Applications Used | ||||||||||
| Photo Sync/Editing | Import images, edit, export | Adobe Photoshop CS6, Adobe Lightroom 4, Dropbox | ||||||||||
| Gaming | Download/install games, play games | Steam, Deus Ex, Skyrim, Starcraft 2, BioShock Infinite | ||||||||||
| Virtualization | Run/manage VM, use general apps inside VM | VirtualBox | ||||||||||
| General Productivity | Browse the web, manage local email, copy files, encrypt/decrypt files, backup system, download content, virus/malware scan | Chrome, IE10, Outlook, Windows 8, AxCrypt, uTorrent, AdAware | ||||||||||
| Video Playback | Copy and watch movies | Windows 8 | ||||||||||
| Application Development | Compile projects, check out code, download code samples | Visual Studio 2012 | ||||||||||
While some tasks remained independent, many were stitched together (e.g. system backups would take place while other scenarios were taking place). The overall stats give some justification to what I've been calling this test internally:
| AnandTech Storage Bench 2013 Preview - The Destroyer, Specs | |||||||||||||
| The Destroyer (2013) | Heavy 2011 | ||||||||||||
| Reads | 38.83 million | 2.17 million | |||||||||||
| Writes | 10.98 million | 1.78 million | |||||||||||
| Total IO Operations | 49.8 million | 3.99 million | |||||||||||
| Total GB Read | 1583.02 GB | 48.63 GB | |||||||||||
| Total GB Written | 875.62 GB | 106.32 GB | |||||||||||
| Average Queue Depth | ~5.5 | ~4.6 | |||||||||||
| Focus | Worst case multitasking, IO consistency | Peak IO, basic GC routines | |||||||||||
SSDs have grown in their performance abilities over the years, so I wanted a new test that could really push high queue depths at times. The average queue depth is still realistic for a client workload, but the Destroyer has some very demanding peaks. When I first introduced the Heavy 2011 test, some drives would take multiple hours to complete it - today most high performance SSDs can finish the test in under 90 minutes. The Destroyer? So far the fastest I've seen it go is 10 hours. Most high performance I've tested seem to need around 12 - 13 hours per run, with mainstream drives taking closer to 24 hours. The read/write balance is also a lot more realistic than in the Heavy 2011 test. Back in 2011 I just needed something that had a ton of writes so I could start separating the good from the bad. Now that the drives have matured, I felt a test that was a bit more balanced would be a better idea.
Despite the balance recalibration, there's just a ton of data moving around in this test. Ultimately the sheer volume of data here and the fact that there's a good amount of random IO courtesy of all of the multitasking (e.g. background VM work, background photo exports/syncs, etc...) makes the Destroyer do a far better job of giving credit for performance consistency than the old Heavy 2011 test. Both tests are valid, they just stress/showcase different things. As the days of begging for better random IO performance and basic GC intelligence are over, I wanted a test that would give me a bit more of what I'm interested in these days. As I mentioned in the S3700 review - having good worst case IO performance and consistency matters just as much to client users as it does to enterprise users.
Given the sheer amount of time it takes to run through the Destroyer, and the fact that the test was only completed a little over a week ago, I don't have many results to share. I'll be populating this database over the coming weeks/months. I'm still hunting for any issues/weirdness with the test so I'm not ready to remove the "Preview" label from it just yet. But the results thus far are very telling.
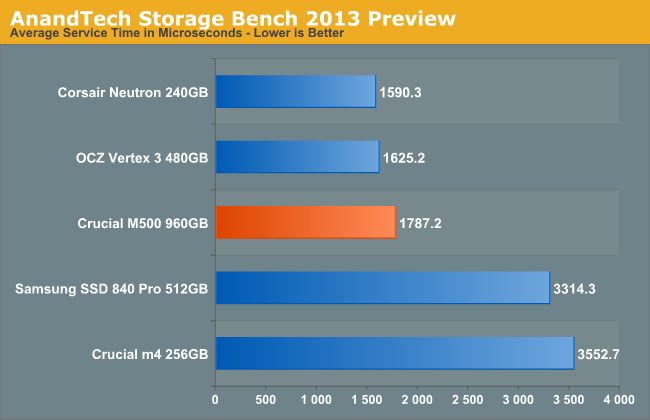
I'm reporting two primary metrics with the Destroyer: average data rate in MB/s and average service time in microseconds. The former gives you an idea of the throughput of the drive during the time that it was running the Destroyer workload. This can be a very good indication of overall performance. What average data rate doesn't do a good job of is taking into account response time of very bursty (read: high queue depth) IO. By reporting average service time we heavily weigh latency for queued IOs. You'll note that this is a metric I've been reporting in our enterprise benchmarks for a while now. With the client tests maturing, the time was right for a little convergence.
I'll also report standard deviation for service times to give you some idea of IO consistency.
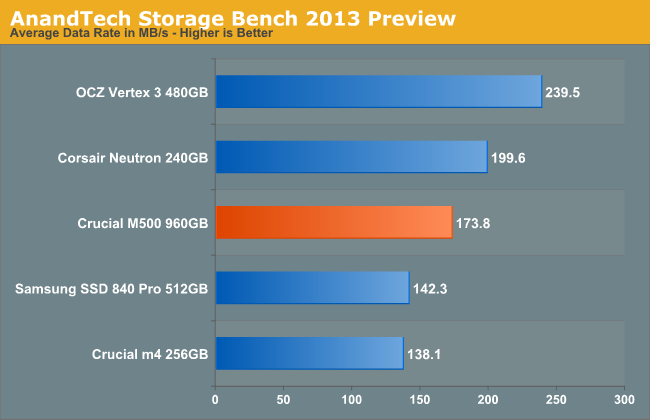
Average data rates already show us something very surprising. The Corsair Neutron, which definitely places below Samsung's SSD 840 Pro in our Heavy 2011 test, takes second place here. If you look at the IO consistency graphs from the previous page however, this shouldn't come as a huge shock. Without additional spare area, the 840 Pro can definitely back itself into a corner - very similar to the old m4 in fact. The M500 dramatically improves IO consistency and worst case scenario IO performance, and it shows.
The SF-2281 based Vertex 3 does extremely well, taking the crown. SandForce's real time compression/de-dupe engine has always given it wonderful performance, even when running these heavy workloads as long as there's some portion of data that's compressible. The problem with SandForce wasn't performance, it was always a reliability concern that drove us elsewhere.
The results are echoed here, and exaggerated quite significantly. The SF-2281 based Vertex 3 does very well as it's able to work as if it has more spare area thanks to the fact that some of the workload can be compressed in real time. I did fill all drives with incompressible data at first, but given that not all parts of the workload are incompressible the SandForce drive gets a bit of an advantage - similar to what would happen in the real world.
Note that the Vertex 3 and Neutron swap spots as we look at average service time. This is exactly what I was talking about earlier. Here we're looking more at how a drive handles bursty (high queue depth) workloads vs. overall performance in our suite. Both metrics are important, but this one is likely more relevant to how fast your system feels.
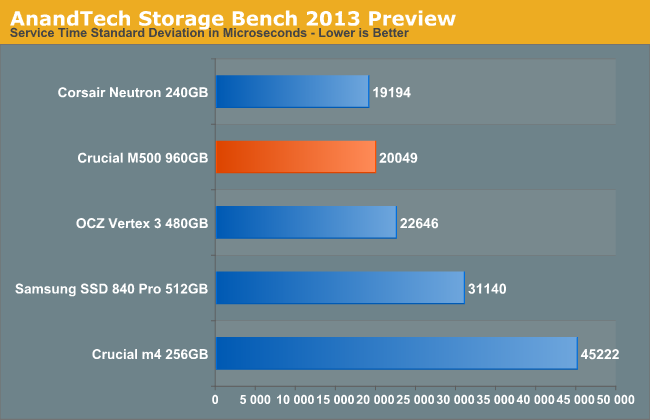
Although the Neutron clearly has the response time advantage, the M500 delivers a remarkably competitive consistency story. Absolute performance may not be great in its lowest performing state, but the M500 keeps things consistent. Comparing to the old m4 we see just how bad things used to be.


111 Comments
View All Comments
NCM - Tuesday, April 9, 2013 - link
TRIM support is built into the OS X, but disabled by default for non-Apple drives. As others have pointed out, the freeware utility 'TRIM Enabler' easily takes care of that. The only other thing to know is that some OS X updates may reset TRIM to 'off', so it's as well to check after any update and re-enable it if necessary.I take care of an office full of Macs, including Mac Pros, iMacs, Minis and MacBook Pros, the majority of which have SSDs that I installed. I'm typing this on my 2010 MBP with a 512GB Plextor M3P.
With the price of SSDs now this is a very worthwhile upgrade, and particularly one that offers a new lease on life for older computers.
Bkord123 - Tuesday, April 9, 2013 - link
All of these comments are going to make my wife mad when I buy yet another gadget! I'm not as worried now about the TRIM issue. Btw, does this site have a page that ranks hard drives? I did look and didn't see anything here.jamyryals - Tuesday, April 9, 2013 - link
Anand has a Bench utility you can use to compare devices. Here's two popular reliable drives -http://www.anandtech.com/bench/Product/792?vs=743
glugglug - Tuesday, April 9, 2013 - link
With most SSDs no longer using 4KB pages, does it make sense to have 8KB and 16KB random write tests?Also, does application performance improve if the drives are formatted with an 8KB or 16KB cluster size?
Kristian Vättö - Tuesday, April 9, 2013 - link
Most real world IOs are 4KB.glugglug - Tuesday, April 9, 2013 - link
Not true, even with the default 4KB cluster size the drives get formatted with. If you format with 16KB clusters, *none* of the IOs will be 4KB.Kristian Vättö - Tuesday, April 9, 2013 - link
Based on the workloads we've traced (using default cluster size), 4KB is the most common IO size, although it obviously varies and some workloads may have consist of larger IO sizes. Do you have something that backs up your statement? Would be interesting to see that.glugglug - Tuesday, April 9, 2013 - link
According to the table in the article, for the Anandtech 2011 Heavy Workload, 28% of the IOs are 4KB, not "most".I am thinking that what must happen for a 4KB IO on a drive with 16KB pages is that it has to read the current contents of the 16KB page so that the 4KB being rewritten can be merged into it, then write a 16KB page, so each write really ends up being a read + write operation not just the write by itself.
Worse, when TRIM is used, if the TRIM operation covers only 4KB of the 16KB page, the page can't really be trimmed, because the other 12KB might still be in use; the drive firmware can't know for certain, so having a cluster size match or exceed the drive's page might result in better steady state performance over time because of TRIM not losing track of partial pages.
Tjalve - Wednesday, April 10, 2013 - link
I think there are some caching involved when dealing with writes thats smaller then the page size of the NAND. I would guss that the M500 caches in DRAM. There are other vendors that use the onboard flash for caching. Like Sandisk nCache for example.glugglug - Wednesday, April 10, 2013 - link
For some SSDs that is definately the case. I'm pretty sure Sandforce needed to do it for example, both because the compression makes the size of the flash writes unpredictable, and because if you look at the cluster sizes the chipset supports to go with various obscure controllers its kind of nuts.I don't think that is the case here though, because if you multiple the marketed 4KB random write numbers by 4KB, you pretty much get exactly the sequential write speed, and write-back caching to deal with the smaller writes would result in much better sequential performance.