MSI FM2-A85XA-G65 Review: Know Your Platform
by Ian Cutress on December 11, 2012 1:21 AM EST- Posted in
- Motherboards
- MSI
- FM2
- A85X
MSI FM2-A85XA-G65 In The Box
It could be argued that for $100 and a full sized motherboard, there should not be much in the motherboard box if the board is high on features. The contrary could also be applied – given the presence of eight SATA ports on the motherboard, surely we should have a bunch of SATA cables and extras to sweeten the deal. MSI err on the side of the former for the FM2-A85XA-G65:
Driver CD
Manual
IO Shield
Four SATA Cables, Locking
Two M-Connectors
V-Check Cables
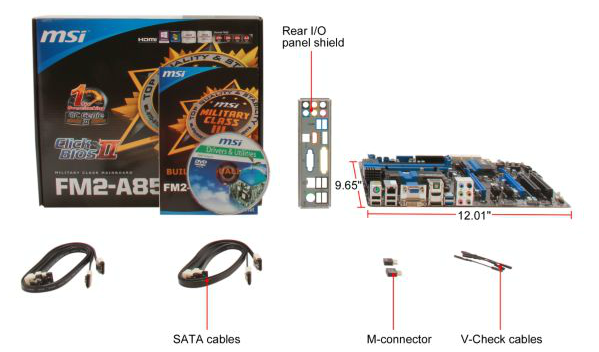
I am quite surprised to see more than two SATA cables, and rather enjoy having four in the box. The M-Connectors are MSI’s ‘easy’ way to attach case cables to the motherboard, and the V-Check cables allow users to test the motherboard voltages a little easier.
MSI FM2-A85XA-G65 Overclocking.
Experience with MSI FM2-A85XA-G65:
Given the issues with the BIOS applying a 4.0 GHz maximum turbo mode in the OS, the OC Genie should have had more headroom to work with when applied. This is unfortunately not the case, with the three ways of applying OC Genie all giving different results – some failing, and others not providing the full speed as expected.
Manual overclocking via the BIOS is easy enough, adjusting voltages, multipliers and so forth. One point of contention could be the automatic Load Line Calibration settings. For example, on some of my overclock testing, the voltage applied by the CPU would be 0.1 volts higher than my setting in the BIOS. This lead to overheating at 4.6 GHz of one part of the system as everything else was left on automatic.
Methodology:
Our standard overclocking methodology is as follows. We select the automatic overclock options and test for stability with PovRay and OCCT to simulate high-end workloads. These stability tests aim to catch any immediate causes for memory or CPU errors.
For manual overclocks, based on the information gathered from previous testing, starts off at a nominal voltage and CPU multiplier, and the multiplier is increased until the stability tests are failed. The CPU voltage is increased gradually until the stability tests are passed, and the process repeated until the motherboard reduces the multiplier automatically (due to safety protocol) or the CPU temperature reaches a stupidly high level (100ºC+). Our test bed is not in a case, which should push overclocks higher with fresher (cooler) air.
Automatic Overclock:
MSI performs automatic overclocking via the OC Genie system. Rather than a series of stability tests, OC Genie seems to call up a table of overclocks depending on the system and apply an OC profile. There are three ways to apply OC Genie – via the switch on board, via MSI Suite, and via the Control Center software. Each one in turn gives the following results:
Using the onboard OC Genie button, the system applied a 5% overclock by pushing the BCLK to 105 MHz at kept the multiplier at 40x. No adjustments to the memory were made, but this setting failed our OCCT test.
Using the MSI Suite OC Genie button made no difference to any setting on board. This of course was stable, being a pure default scenario.
Using the Control Center OC Genie button restarted the system and gave a 39x multiplier and 105 MHz BCLK. While still less than the 4.2 GHz we were expecting, this setting was stable and gave 1.464 volts at load.
This is practically a poor showing by OC Genie. What it should have done is apply the max turbo clock by default as a starting point and worked from there if the user wishes to be more aggressive.
Manual Overclock:
Following our standard methodology for FM2/A85X, I started the processor at a 44x multiplier and a fixed 1.400 volts in the BIOS. The Load Line Calibration was left on automatic for the duration of the testing. The results are as follows:
The 44x multiplier setting was stable at a minimum of 1.500 volts set in the BIOS. This gave a load voltage of 1.576 volts during OCCT in Windows.
The 45x multiplier setting was stable at a minimum of 1.575 volts set in the BIOS. This gave a load voltage of 1.672 volts during OCCT in Windows.
The 46x multiplier setting seemed stable at 1.625 volts (load voltage of 1.712 volts), however it was noted that CPU-Z declocked during OCCT to 1.4 GHz every now and again. This was confirmed by PovRay which achieved a result lower than it would have done at stock settings.


11 Comments
View All Comments
torp - Tuesday, December 11, 2012 - link
It makes no sense to build a system like that, you'd go FM2 if you want to use the integrated video... and then a 3-400W power supply, or even a PicoPSU would suffice.The power consumption test basically gives no useful information.
axelthor - Tuesday, December 11, 2012 - link
If you'd read the article instead of just skimming through it an looking at the graphs you would know why.ssj3gohan - Tuesday, December 11, 2012 - link
Yeah, but just keep in mind that for almost all reviews (especially on anandtech) the power consumption figures are just there as a checkbox feature of the review, they rarely if ever mean something useful. Judging from their more polished reviews and the podcast, it's not a case of lack of intelligence or craftmanship that they bodge up every power measurement, it just seems that they don't have enough time to properly execute this part of a review.So, if I start slagging off these otherwise awesome people I should give them some advice as to how they can properly execute this, right?
First and foremost, and this is not meant as flaming or anything: if you don't know what you're doing, don't publish it. By 'not knowing' I don't mean you're an idiot but I mean that you do not fully understand all aspects of power consumption. Power consumption is a ridiculously complicated matter, it depends not just on recognizable BIOS features, the high-level OS, drivers and hardware composition, but also to a fairly high level on temperature, implementation quirks/bugs and simply offset errors on voltage regulators. The only way to make a truly level playing field is for the reviewer to orthogonalize *all* these factors. Always use the same OS on the same drive with the same BIOS features enabled and verified as working. Measure, directly, the DC power consumption of all non-motherboard components if you just want to isolate the effect of the motherboard. Orthogonalize power distribution by not measuring AC but going for DC power measurements. NEVER extrapolate or guess (e.g. silentpcreview uses a lookup table to go from AC to DC watts, which is categorically wrong), always measure directly. And last but not least: always do a sanity check, look at the manufacturer's data sheets (they are basically always right) and check your findings with other reviewers. It doesn't matter if you differ somewhere, as long as you have a complete explanation of why it differs and why your numbers are correct.
For instance, Anandtech publishes a lot of SSD reviews and always does a power consumption test. These are basically all wrong, as are nigh-on all other SSD power consumption figures on other review sites. They test idle power consumption under a fairly old linux kernel that apparently doesn't understand the DIPM (device initiated power management) power management feature. This is a feature that is supported on every major OS release and chipset since Vista and greatly reduces idle power consumption. The consequence is that measured idle power consumption is galaxies away from actual real-world idle power consumption. Not only that, but they apparently forget that on the first page of their review is a table with manufacturer specs that clearly states *much* lower power consumption. Why doesn't that make them scratch their head and think 'hey... maybe we did something wrong? Shouldn't we go check up on this issue?'. They check every other possible performance metric on these drives and aren't satisfied until everything is explained into great detail, so why not also put some effort into power consumption metrics?
As a result, even though intel specs almost all its consumer drives at 75-150mW idle and 150-400mW load power consumption, all reviews of intel SSDs state their idle power consumption as 0.6W and load at 1.2 or something. So if you're looking for a drive with the lowest possible power consumption for use in e.g. a windows tablet, ultrabook or laptop, you won't find any useful information on the web.
/rant
Wwhat - Wednesday, December 12, 2012 - link
That might scientifically make sense, but in real life the only reason to know the power is to see how much AC you pull and have to pay for (or generate), so in fact you only need to measure the AC pull really.cfaalm - Wednesday, December 12, 2012 - link
I think you're both right. Measuring AC pull is only valid in comparison if you use the same PSU on the same voltage. If you go nitpicking over a couple of mV's then even the efficiency curve of the PSU comes into play. I think it's really hard to get it right.IanCutress - Tuesday, December 11, 2012 - link
In order to keep our testing consistent with ALL other motherboard reviews, we test with multiple GPUs and have to have a power supply capable of 3/4 GPUs at full whack with the CPU as well. We use a 1250W Gold power supply, which as noted in the review has a relatively high efficiency - even more so given that I am on the 240 V input.Two important points:
1) We do not have access to every hardware ever released. In my own testing I use the 1250W gold for desktop environments, and a 500W Platinum for mini-ITX environments, because these are the power supplies I own and allow me to complete testing without spending hours changing everything back and forth. We don't have unlimited space to have 18 test beds set up for individual component XYZ either.
2) Even if you feel the individual values mean nothing to you, then as a comparison against other components put in exactly the same position, conclusions can be drawn as to which is better than the others. You examine the gradient of change rather than the absolute value - a technique used often in scientific circles when the absolutes cannot be obtained.
My testing methodology and scientific background that I do have allow for reasoned interpretation and my testing is equivalent to the rigor I placed in my scientific peer-reviewed papers I published. I never aim to mislead or pre-suppose bias on any bit of kit, and only aim to give the readers the best possible explanation with the tools at my disposal.
woogitboogity - Wednesday, January 2, 2013 - link
It is quite simple. They need to keep things consistent when comparing this motherboard and components to others, including all the crazy SLI/CF rigs. So long as you have a decent power supply in terms of quality the supply will not draw more power than it actually needs.SolMiester - Tuesday, December 11, 2012 - link
What is the point of of building APU, then CF with dGPUS?...ridiculous!..frozentundra123456 - Tuesday, December 11, 2012 - link
I agree with what you are saying, but the tested games were surprisingly playable at demanding settings with the right video card(s). However, I cant see buying such a cheap processor, especially an APU, and pairing it high end cards either.It would have been interesting to test something like a 3570k and FX 6300/8350 under the same conditions (with their appropriate MB of course) to see how much faster they were. Surprisingly, it looks like the tests are GPU bound even with a lowly A10 cpu.
Origin64 - Wednesday, December 12, 2012 - link
I still don't get why people are getting so worked up about this. 2.0 x8 offers 95% of the performance, x16 something like 99. We don't need PCIe 3.0 yet. Probably won't for another year or two, at least.