Corsair Neutron & Neutron GTX: All Capacities Tested
by Kristian Vättö on December 19, 2012 1:10 PM ESTRandom Read/Write Speed
The four corners of SSD performance are as follows: random read, random write, sequential read and sequential write speed. Random accesses are generally small in size, while sequential accesses tend to be larger and thus we have the four Iometer tests we use in all of our reviews.
Our first test writes 4KB in a completely random pattern over an 8GB space of the drive to simulate the sort of random access that you'd see on an OS drive (even this is more stressful than a normal desktop user would see). I perform three concurrent IOs and run the test for 3 minutes. The results reported are in average MB/s over the entire time. We use both standard pseudo randomly generated data for each write as well as fully random data to show you both the maximum and minimum performance offered by SandForce based drives in these tests. The average performance of SF drives will likely be somewhere in between the two values for each drive you see in the graphs. For an understanding of why this matters, read our original SandForce article.
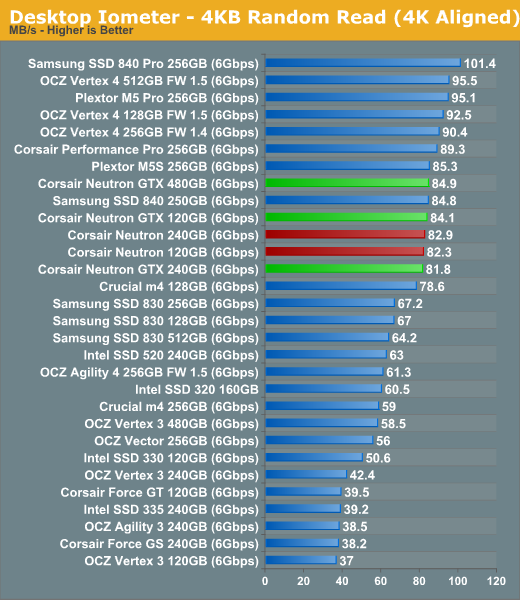
Random read speeds at low queue depths are usually not bound by the NAND because reading from NAND is a lot simpler process than writing, so you get no performance benefit from using faster NAND. There is no performance gain from more NAND die either as all capacities perform nearly equally. The gap between the fastest and slowest of the Neutron drives is 4%, which is hardly worth thinking about.
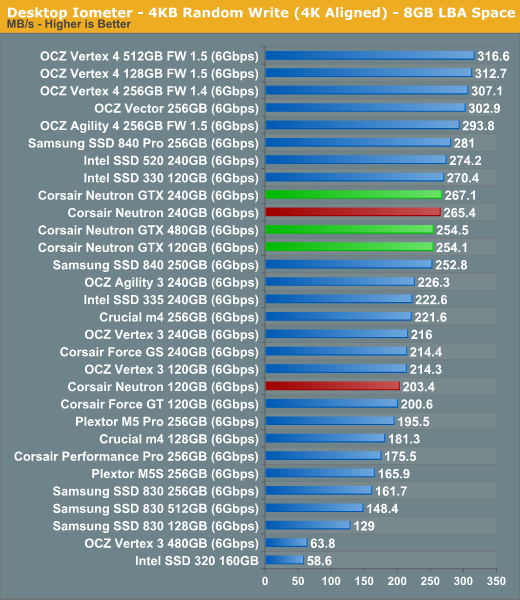
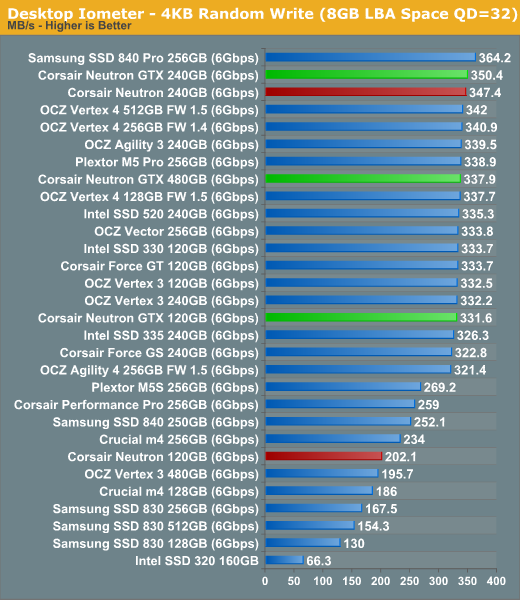
Random write performance is a lot more NAND dependent than random read. The 120GB Neutron simply can't keep up with the other models because it has slower NAND than the 120GB Neutron GTX and fewer die than the 240GB Neutron. The 120GB version of Neutron GTX does surprisingly well and is almost equivalent to its big brothers. While the gap between the higher performance Neutron drives is around 5% in the write tests, the 120GB Neutron is 20% (normal) and 40% (QD=32) behind the 120GB Neutron GTX.
Sequential Read/Write Speed
To measure sequential performance I ran a 1 minute long 128KB sequential test over the entire span of the drive at a queue depth of 1. The results reported are in average MB/s over the entire test length.
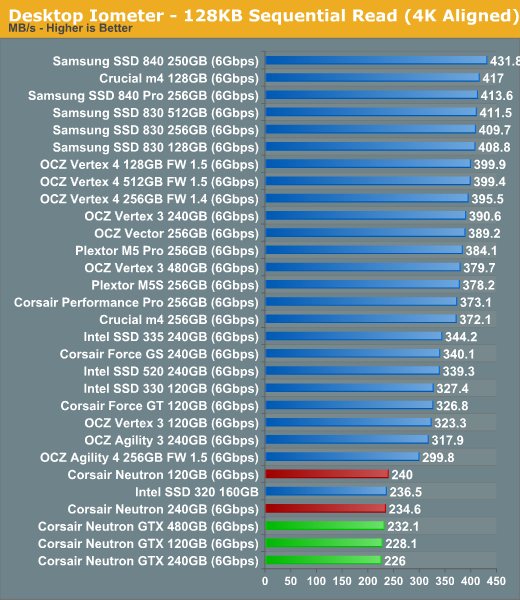
Low queue depth sequential read speed is still an issue but given that Corsair has not provided a new firmware, this was expected. All the drives are running the same M206 firmware, which is what shipping units come with as well. Again, the gap between the fastest and slowest Neutron is around 6% here.
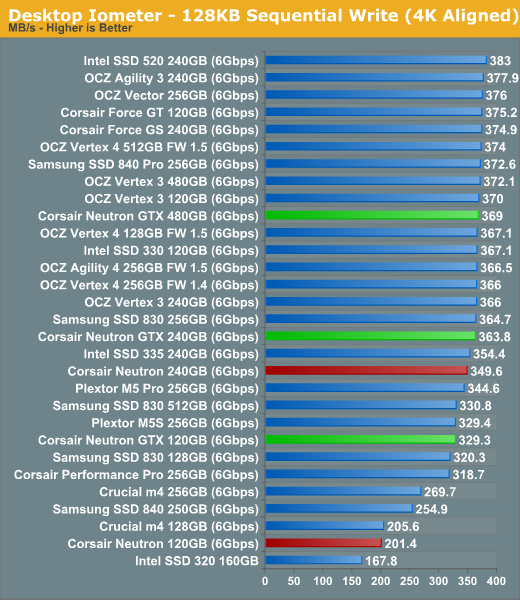
Sequential write speed shares the behavior of random write performance: having more and faster NAND increases throughput though there is essentially no benefit from more than 256GiB of NAND. Both 120GB drives fall behind, though the GTX is still close and performs around 60% faster than the Neutron.


44 Comments
View All Comments
Oxford Guy - Sunday, December 23, 2012 - link
Ad hominem much?Plenty of buyers would be interested in knowing that the 830, for instance, tops the charts in terms of power usage under load, particularly given the fact that Samsung's "full specs" advertised number is impossibly low.
People have been tricked by this, which is exactly why Samsung publishes that low number.
Ever heard of laptop battery life? What about heat? I suppose not.
Kristian Vättö - Saturday, December 22, 2012 - link
The figures Samsung reports are with Device Initiated Power Management (DIPM) enabled. That's a feature that is usually only found on laptops but it can be added to desktop systems as well.With DIPM disabled, Samsung rates the idle power at 0.349W, which supports our figures (we got 0.31W).
The same goes for active power, Samsung rates it at 3.55W (sequential write) and 2.87W (4KB random write QD32). The 0.069W figure comes from the average power draw using Mobile Mark 2007, which is something we don't use.
Oxford Guy - Sunday, December 23, 2012 - link
So, in a laptop, the load power for the 830 amazingly plummets from, what 5+ watts, to .13 watts?That's really amazing. I guess the next thing to ask is why these amazing results aren't part of the published charts.
Cold Fussion - Saturday, December 22, 2012 - link
I think the power consumption tests are particularly useless. How come you don't test power consumption under some typical workload and heavy workload so we can see how much energy they use?Kristian Vättö - Sunday, December 23, 2012 - link
Because we don't have the equipment for that. With a standard multimeter we can only record the average peak current, so we have to use an IOmeter test for each number (recording the peak while running e.g. Heavy suite would be useless).Good power measurement equipment can cost thousands of dollars. Ultimately the decision is up to Anand but I don't think he is willing to spend that much money on just one test, especially when it can somewhat be tested with a standard multimeter. Besides, desktop users don't usually care about the power consumption at all, so that is another reason why such investment might not be the most worthwhile.
Oxford Guy - Sunday, December 23, 2012 - link
And we know only desktop users buy SSDs. No one ever buys them for laptops.lmcd - Monday, December 24, 2012 - link
Howabout you buy the equipment for them, if it's such a great investment?Cold Fussion - Tuesday, December 25, 2012 - link
That line of thinking is flawed. If you're only catering to desktop users, why even present the power consumption figures at all? The 3-5w maximum power consumption of an SSD which will largely be idle is not at all significant compared to the 75 watts the cpu is pulling while gaming or the 150watts the gpu is pulling.The tests as they are server no real purpose. It would be like trying to measure power-efficiency of a cpu purely by it's maximum power consumption. I don't believe a basic datalogger is going to run into the 1000s.
Kristian Vättö - Tuesday, December 25, 2012 - link
I didn't say we only cater desktop users, but the fact is that some of our readers are desktop users and hence don't care about the power consumption tests. It's harder to justify buying expensive equipment when some will not be interested in the tests.Don't get me wrong, I would buy the equipment in a heartbeat if someone gave me the money. However, I'm not the one pulling the strings on that. If you have suggestions on affordable dataloggers, feel free to post them. All I know is that the tool that was used in the Clover Trail efficiency article costs around $3000.
Cold Fussion - Tuesday, December 25, 2012 - link
But it doesn't cater to mobile users because the data provided is simply not of any real use. I can go to my local retail electronics store and buy a data-logging multimeter for $150-$250 AUD, I am almost certain that you can purchase one cheaper than that in the US from a retail outlet or online.