Corsair Neutron & Neutron GTX: All Capacities Tested
by Kristian Vättö on December 19, 2012 1:10 PM ESTRandom Read/Write Speed
The four corners of SSD performance are as follows: random read, random write, sequential read and sequential write speed. Random accesses are generally small in size, while sequential accesses tend to be larger and thus we have the four Iometer tests we use in all of our reviews.
Our first test writes 4KB in a completely random pattern over an 8GB space of the drive to simulate the sort of random access that you'd see on an OS drive (even this is more stressful than a normal desktop user would see). I perform three concurrent IOs and run the test for 3 minutes. The results reported are in average MB/s over the entire time. We use both standard pseudo randomly generated data for each write as well as fully random data to show you both the maximum and minimum performance offered by SandForce based drives in these tests. The average performance of SF drives will likely be somewhere in between the two values for each drive you see in the graphs. For an understanding of why this matters, read our original SandForce article.
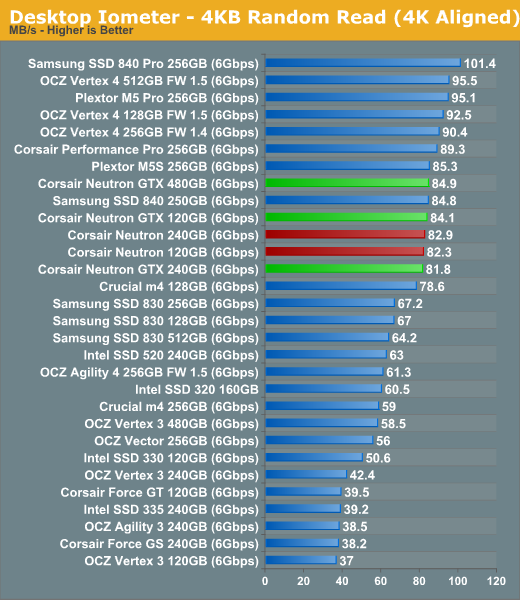
Random read speeds at low queue depths are usually not bound by the NAND because reading from NAND is a lot simpler process than writing, so you get no performance benefit from using faster NAND. There is no performance gain from more NAND die either as all capacities perform nearly equally. The gap between the fastest and slowest of the Neutron drives is 4%, which is hardly worth thinking about.
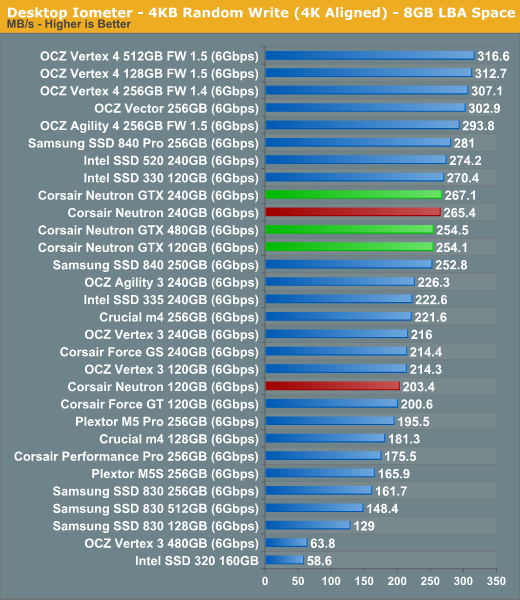
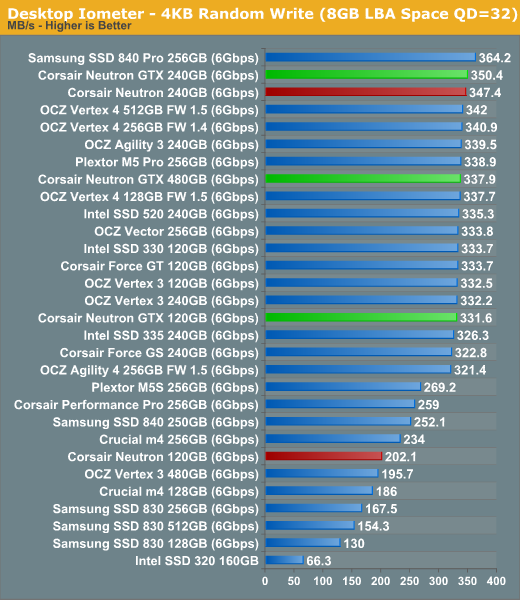
Random write performance is a lot more NAND dependent than random read. The 120GB Neutron simply can't keep up with the other models because it has slower NAND than the 120GB Neutron GTX and fewer die than the 240GB Neutron. The 120GB version of Neutron GTX does surprisingly well and is almost equivalent to its big brothers. While the gap between the higher performance Neutron drives is around 5% in the write tests, the 120GB Neutron is 20% (normal) and 40% (QD=32) behind the 120GB Neutron GTX.
Sequential Read/Write Speed
To measure sequential performance I ran a 1 minute long 128KB sequential test over the entire span of the drive at a queue depth of 1. The results reported are in average MB/s over the entire test length.
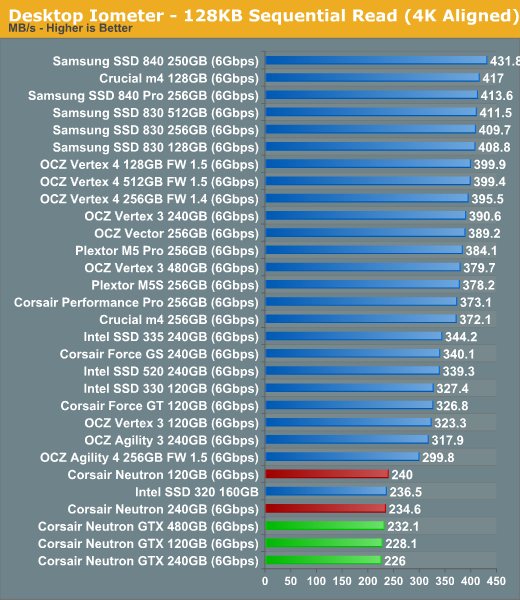
Low queue depth sequential read speed is still an issue but given that Corsair has not provided a new firmware, this was expected. All the drives are running the same M206 firmware, which is what shipping units come with as well. Again, the gap between the fastest and slowest Neutron is around 6% here.
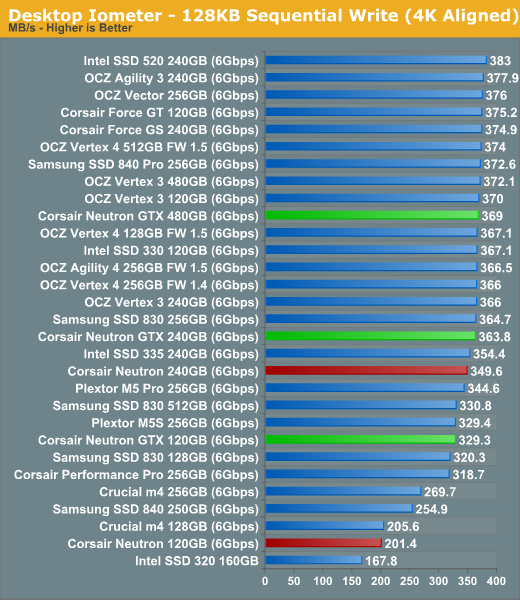
Sequential write speed shares the behavior of random write performance: having more and faster NAND increases throughput though there is essentially no benefit from more than 256GiB of NAND. Both 120GB drives fall behind, though the GTX is still close and performs around 60% faster than the Neutron.


44 Comments
View All Comments
infoilrator - Thursday, December 20, 2012 - link
Better in what way?Perceived, benchmark, or price?
Raid0 with another Kingston might be the most cost effective.
The SAMSUNG 840 certainly offers a lot for the price
celestialgrave - Thursday, December 20, 2012 - link
Guess I'll be sticking with my Agility 3 a while longer in the laptop, until someone releases a more frugal powered ssd with good performance.lmcd - Monday, December 24, 2012 - link
... Samsung 840 sips. Doesn't Sandforce take a lot of power?lmcd - Monday, December 24, 2012 - link
Whoops, nvmwell, OCZ 4 series does better than 3 series, either way. And Samsung's results may be faked, as per Oxford Guy's comments.
pattycake0147 - Thursday, December 20, 2012 - link
Why did you choose different scales on the graphs for the final set of consistency graphs? Some top at 50,000 iops and others top at 40,000 iops this makes looking at comparisons more difficult. Even the same drive (840 Pro) has a different scale for the standard and 25% OP graphs.Kristian Vättö - Friday, December 21, 2012 - link
I was aware of this. At first 40K IOPS was enough but when we started including 25% OP tests, many SSDs managed over 40K IOPS so it was obvious that the scale had to be extended. I'll try to make all graphs 50K IOPS for the next review - Anand has done most of the tests so I couldn't create new graphs for this one.Oxford Guy - Friday, December 21, 2012 - link
Anandtech should expose Samsung's lies, regarding the load power usage of their SSDs.It certainly does not here:
"the 840 Pro boasts incredibly low power consumption both at idle and under load"
Perhaps, but the actual usage is much higher than Samsung's packaging claim.
http://www.anandtech.com/show/6328/samsung-ssd-840...
Or here:
"Until we get lower capacity drives it's impossible to tell how much the power consumption story will change."
How convenient it was for Samsung to only provide a 512 GB unit.
http://www.anandtech.com/show/4863/the-samsung-ssd...
Let's see what Samsung claims with their "full specs" page:
http://www.samsung.com/us/computer/memory-storage/...
.13W — miraculous!
And, let's see what Samsung provided Newegg for its 512 GB drive, eh?
Power consumption idle: .008W
Power consumption load: .13W
http://www.newegg.com/Product/Product.aspx?Item=N8...
People have routinely cited Samsung's "efficient" design, citing these false numbers, in comparisons with other drives. This has to stop. Anandtech, you have a responsibility to report on this, not cover for them.
Let's see what the 840 512's "full specs" are, eh?
http://www.samsung.com/us/computer/memory-storage/...
Well, Samsung certainly learned their lesson thanks to Anandtech. They've raised the power consumption to .15W!
Oxford Guy - Friday, December 21, 2012 - link
Oh, and let's take a look at the numbers Samsung provided Newegg for the 512 GB 840, shall we?power consumption idle: 0.054W
power consumption load: 0.069W
Oxford Guy - Friday, December 21, 2012 - link
OCZ has felt heat from Anandtech over its sleazy practice of changing the NAND of its drives from 32-bit to 64-bit without changing the specs on the packaging.Why not Samsung? The 830 has the highest power consumption in this latest roundup, and yet did Anandtech compare the claimed .13W power usage to the actual power usage?
"Until we get lower capacity drives it's impossible to tell how much the power consumption story will change."
How about "This 512 GB drive uses vastly more power than Samsung claims it does. We are going to find out just how much the lower-capacity drives use and write a story about these serious discrepancies."?
That would have been more appropriate.
derGhostrider - Saturday, December 22, 2012 - link
What is your problem "Oxford Guy"?Almost noone cares about power consumption of 1W or 3W or 0.15W for a SSD, except when you try to build an ultra durable ultra-book or tablet PC.
But even then you have to consider that the Samsung 840 pro has the lowest "disk busy time" of all SSDs tested so far.
So it uses more power during its active time but it shortens this time to a minimum.
Take a calculator! It won't be that bad compared to others that use less power but twice as long.
And, if you really care about this little secondary detail that much: Take another SSD that offers the lowest overall power consumption. It won't be that fast but it will satisfy your needs.
Your postings look like a senseless try of bashing the best SSD on the (consumer) market for an almost unimportant little detail. And: You seem to know about it. So make your decision based on your knowledge but don't tripple post just to arouse the image of an issue that might be important.