Samsung SSD 840 Pro (256GB) Review
by Anand Lal Shimpi on September 24, 2012 7:00 AM EST- Posted in
- Storage
- SSDs
- Samsung
- Samsung SSD 840
AnandTech Storage Bench 2011
Two years ago we introduced our AnandTech Storage Bench, a suite of benchmarks that took traces of real OS/application usage and played them back in a repeatable manner. I assembled the traces myself out of frustration with the majority of what we have today in terms of SSD benchmarks.
Although the AnandTech Storage Bench tests did a good job of characterizing SSD performance, they weren't stressful enough. All of the tests performed less than 10GB of reads/writes and typically involved only 4GB of writes specifically. That's not even enough exceed the spare area on most SSDs. Most canned SSD benchmarks don't even come close to writing a single gigabyte of data, but that doesn't mean that simply writing 4GB is acceptable.
Originally I kept the benchmarks short enough that they wouldn't be a burden to run (~30 minutes) but long enough that they were representative of what a power user might do with their system.
Not too long ago I tweeted that I had created what I referred to as the Mother of All SSD Benchmarks (MOASB). Rather than only writing 4GB of data to the drive, this benchmark writes 106.32GB. It's the load you'd put on a drive after nearly two weeks of constant usage. And it takes a *long* time to run.
1) The MOASB, officially called AnandTech Storage Bench 2011 - Heavy Workload, mainly focuses on the times when your I/O activity is the highest. There is a lot of downloading and application installing that happens during the course of this test. My thinking was that it's during application installs, file copies, downloading and multitasking with all of this that you can really notice performance differences between drives.
2) I tried to cover as many bases as possible with the software I incorporated into this test. There's a lot of photo editing in Photoshop, HTML editing in Dreamweaver, web browsing, game playing/level loading (Starcraft II & WoW are both a part of the test) as well as general use stuff (application installing, virus scanning). I included a large amount of email downloading, document creation and editing as well. To top it all off I even use Visual Studio 2008 to build Chromium during the test.
The test has 2,168,893 read operations and 1,783,447 write operations. The IO breakdown is as follows:
| AnandTech Storage Bench 2011 - Heavy Workload IO Breakdown | ||||
| IO Size | % of Total | |||
| 4KB | 28% | |||
| 16KB | 10% | |||
| 32KB | 10% | |||
| 64KB | 4% | |||
Only 42% of all operations are sequential, the rest range from pseudo to fully random (with most falling in the pseudo-random category). Average queue depth is 4.625 IOs, with 59% of operations taking place in an IO queue of 1.
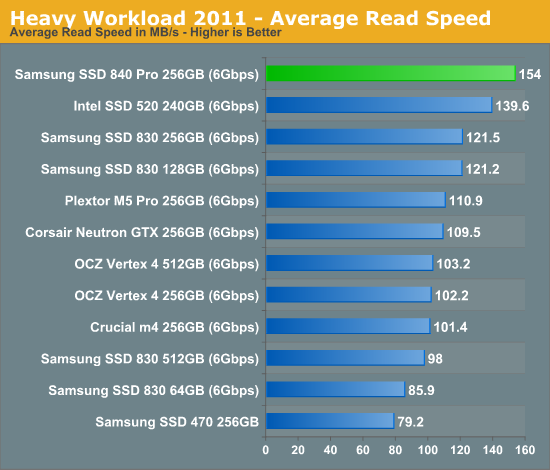
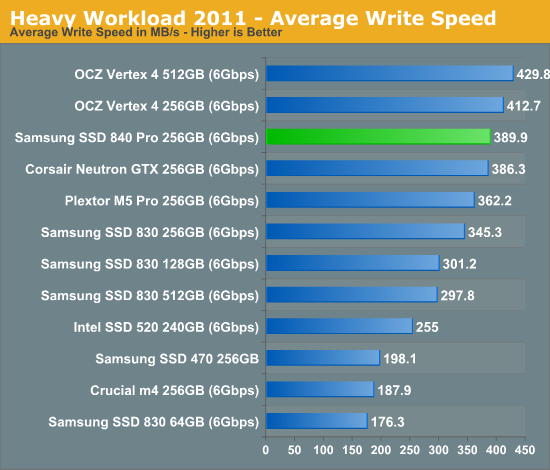
Many of you have asked for a better way to really characterize performance. Simply looking at IOPS doesn't really say much. As a result I'm going to be presenting Storage Bench 2011 data in a slightly different way. We'll have performance represented as Average MB/s, with higher numbers being better. At the same time I'll be reporting how long the SSD was busy while running this test. These disk busy graphs will show you exactly how much time was shaved off by using a faster drive vs. a slower one during the course of this test. Finally, I will also break out performance into reads, writes and combined. The reason I do this is to help balance out the fact that this test is unusually write intensive, which can often hide the benefits of a drive with good read performance.
There's also a new light workload for 2011. This is a far more reasonable, typical every day use case benchmark. Lots of web browsing, photo editing (but with a greater focus on photo consumption), video playback as well as some application installs and gaming. This test isn't nearly as write intensive as the MOASB but it's still multiple times more write intensive than what we were running in 2010.
As always I don't believe that these two benchmarks alone are enough to characterize the performance of a drive, but hopefully along with the rest of our tests they will help provide a better idea.
The testbed for Storage Bench 2011 has changed as well. We're now using a Sandy Bridge platform with full 6Gbps support for these tests.
AnandTech Storage Bench 2011 - Heavy Workload
We'll start out by looking at average data rate throughout our new heavy workload test:
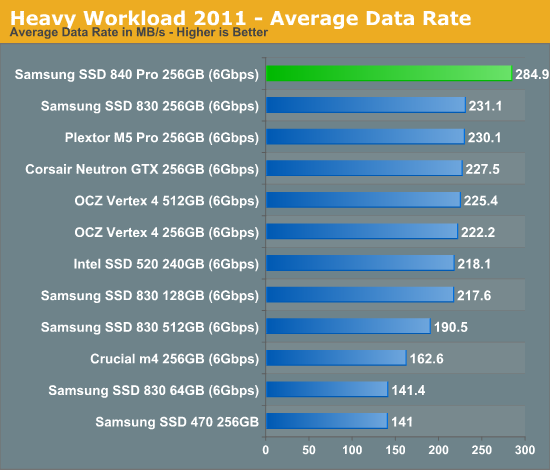
A strong showing in all of our low level IO tests, with no drawbacks, results in 24% better performance than the 830 in our heavy workload. There's simply no faster drive than the 840 Pro.
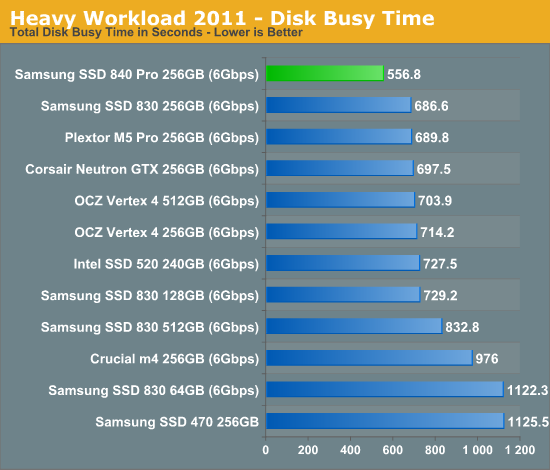
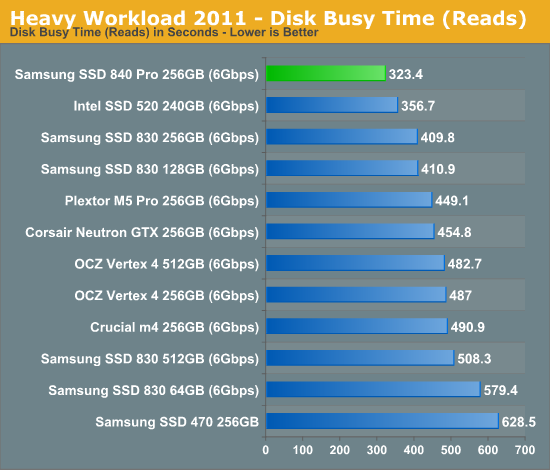
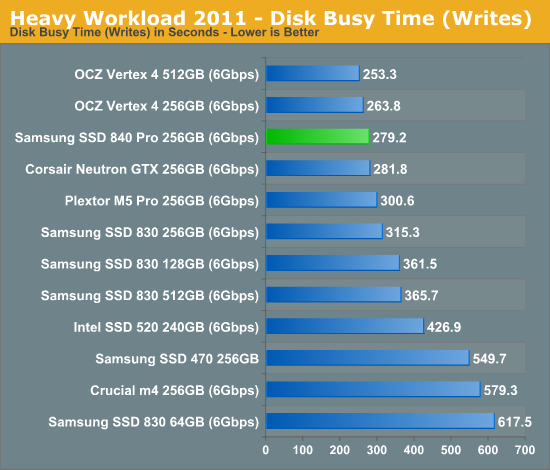
The next three charts just represent the same data, but in a different manner. Instead of looking at average data rate, we're looking at how long the disk was busy for during this entire test. Note that disk busy time excludes any and all idles, this is just how long the SSD was busy doing something:


96 Comments
View All Comments
Old_Fogie_Late_Bloomer - Monday, September 24, 2012 - link
I think I might move my Steam folder to my 64GB 830 (if it hasn't grown too large) and see if Portal II level load times improve. The write times take a hit due to the smaller number of NAND chips, but the read times should be mostly limited by SATA 3 bandwidth. I'll try to pop back in here with a report of any improvements that I see.Old_Fogie_Late_Bloomer - Tuesday, September 25, 2012 - link
Long story short, despite the fact that the 830 64GB beats out the 320 160GB in seven of eight CrystalDiskMark tests (88% in sequential reading, 95% in 512K random read, and so on, except for 4K random write with a queue depth of 32, where the Intel is 70% faster)......I honestly can't say it takes noticeably less time to either load games like Portal, Portal 2, or Quantum Conundrum, or to load levels/saves in those games. Portal 2 might start up a tiny bit faster on the new drive, but I certainly wouldn't swear to it.
repoman27 - Monday, September 24, 2012 - link
The article mentions that this drive uses the new Toggle 2.0 interface which operates at 400 Mbps, however individual packages are clearly capable of more than that if 8 packages can provide sequential speeds greater than 400 MB/s.My understanding is that both ONFI 3.0 and Toggle 2.0 support data rates of 400 MT/s. It would seem that the maximum transfer size for ONFI is 8 bits, so they claim 400 MB/s for the interface. Is the 400 Mbps number for Toggle 2.0 a per die figure? Is it not also capable of 8 bits per transfer and thus 400 MB/s as well?
Kristian Vättö - Monday, September 24, 2012 - link
400Mbit/s is the speed of the Toggle-Mode 2.0 interface but the the interface is 8 bits wide, making the maximum throughput 400MB/s per interface. I know it's stupid that they say 400Mbps because it's just confusingMrMilli - Monday, September 24, 2012 - link
"The basic architecture of the controller hasn't changed. Internally there are three ARM9 cores now running at 300MHz."It's not using ARM9 cores any longer. It's now using Cortex R4 cores. I would say that's a big enough change to say that the basic architecture has changed.
Kristian Vättö - Monday, September 24, 2012 - link
You are correct. Samsung's reviewer's guide originally said ARM9 but yesterday's slides said ARM R4, hence the confusion here :-)Jocelyn - Monday, September 24, 2012 - link
Thank You for the review Anand, but is there any chance you and Kristian could start controlling the variables that are not being tested in future SSD reviews? CPU power saving features (EIST/Turbo) being left on in some reviews, while off in others, definitely affects performance.jwcalla - Monday, September 24, 2012 - link
I have yet to see an SSD that gets better than 75% of the SATA theoretical max -- even SATA II drives. Can the interface really have 25% lost to inefficiencies? That seems like a lot of overhead.repoman27 - Monday, September 24, 2012 - link
SATA uses 8b/10b encoding, so 6Gb/s becomes 600MB/s. Then, just like any transfer protocol, there's additional protocol overhead. The AS-SSD sequential read speeds posted by this drive would demonstrate just better than 85% efficiency, which is not too shabby.Oxford Guy - Monday, September 24, 2012 - link
"The first Samsung MLC SSDs were reliable, they just weren't worth the money when you had much better options from companies like Intel."Intel stuck it to X25M G1 owners by refusing to provide a firmware update to support TRIM. If you're going to praise Intel and criticize Samsung so much in the opening of an article, that should have been noted.