Corsair Performance Series Pro (256GB) Review
by Kristian Vättö on May 14, 2012 9:10 AM EST- Posted in
- Storage
- SSDs
- Corsair
- Marvell
- Corsair Performance Pro
AnandTech Storage Bench 2011
Last year we introduced our AnandTech Storage Bench, a suite of benchmarks that took traces of real OS/application usage and played them back in a repeatable manner. Anand assembled the traces out of frustration with the majority of what we have today in terms of SSD benchmarks.
Although the AnandTech Storage Bench tests did a good job of characterizing SSD performance, they weren't stressful enough. All of the tests performed less than 10GB of reads/writes and typically involved only 4GB of writes specifically. That's not even enough exceed the spare area on most SSDs. Most canned SSD benchmarks don't even come close to writing a single gigabyte of data, but that doesn't mean that simply writing 4GB is acceptable.
Originally we kept the benchmarks short enough that they wouldn't be a burden to run (~30 minutes) but long enough that they were representative of what a power user might do with their system. Later, however, we created what we refer to as the Mother of All SSD Benchmarks (MOASB). Rather than only writing 4GB of data to the drive, this benchmark writes 106.32GB. This represents the load you'd put on a drive after nearly two weeks of constant usage. And it takes a long time to run.
1) The MOASB, officially called AnandTech Storage Bench 2011—Heavy Workload, mainly focuses on the times when your I/O activity is the highest. There is a lot of downloading and application installing that happens during the course of this test. Our thinking was that it's during application installs, file copies, downloading, and multitasking with all of this that you can really notice performance differences between drives.
2) We tried to cover as many bases as possible with the software incorporated into this test. There's a lot of photo editing in Photoshop, HTML editing in Dreamweaver, web browsing, game playing/level loading (Starcraft II and WoW are both a part of the test), as well as general use stuff (application installing, virus scanning). We included a large amount of email downloading, document creation, and editing as well. To top it all off we even use Visual Studio 2008 to build Chromium during the test.
The test has 2,168,893 read operations and 1,783,447 write operations. The IO breakdown is as follows:
| AnandTech Storage Bench 2011—Heavy Workload IO Breakdown | ||||
| IO Size | % of Total | |||
| 4KB | 28% | |||
| 16KB | 10% | |||
| 32KB | 10% | |||
| 64KB | 4% | |||
Only 42% of all operations are sequential; the rest ranges from pseudo to fully random (with most falling in the pseudo-random category). Average queue depth is 4.625 IOs, with 59% of operations taking place in an IO queue of 1.
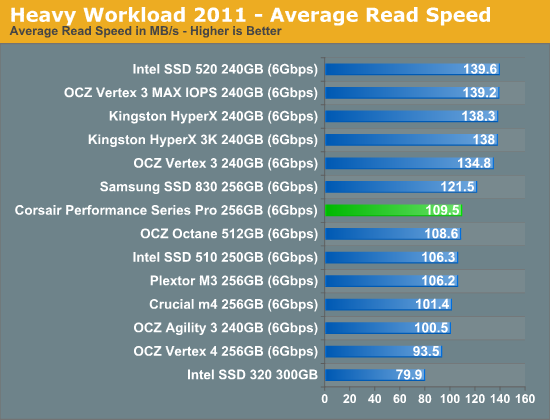
Many of you have asked for a better way to really characterize performance. Simply looking at IOPS doesn't really say much. As a result we're going to be presenting Storage Bench 2011 data in a slightly different way. We'll have performance represented as Average MB/s, with higher numbers being better. At the same time we'll be reporting how long the SSD was busy while running this test. These disk busy graphs will show you exactly how much time was shaved off by using a faster drive vs. a slower one during the course of this test. Finally, we will also break out performance into reads, writes, and combined. The reason we do this is to help balance out the fact that this test is unusually write intensive, which can often hide the benefits of a drive with good read performance.
There's also a new light workload for 2011. This is a far more reasonable, typical every day use case benchmark. It has lots of web browsing, photo editing (but with a greater focus on photo consumption), video playback, as well as some application installs and gaming. This test isn't nearly as write intensive as the MOASB but it's still multiple times more write intensive than what we were running last year.
We don't believe that these two benchmarks alone are enough to characterize the performance of a drive, but hopefully along with the rest of our tests they will help provide a better idea. The testbed for Storage Bench 2011 has changed as well. We're now using a Sandy Bridge platform with full 6Gbps support for these tests.
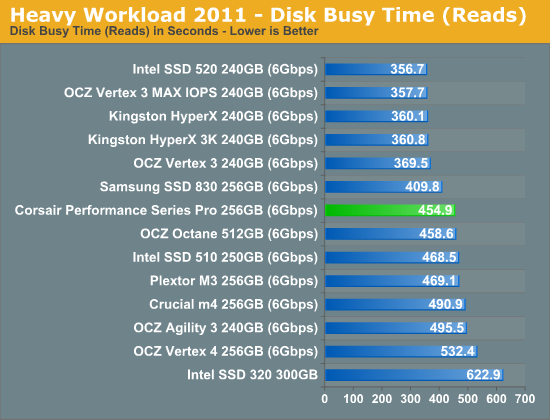
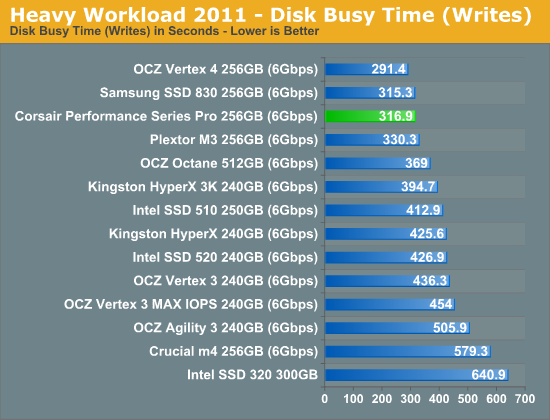
AnandTech Storage Bench 2011—Heavy Workload
We'll start out by looking at average data rate throughout our new heavy workload test:
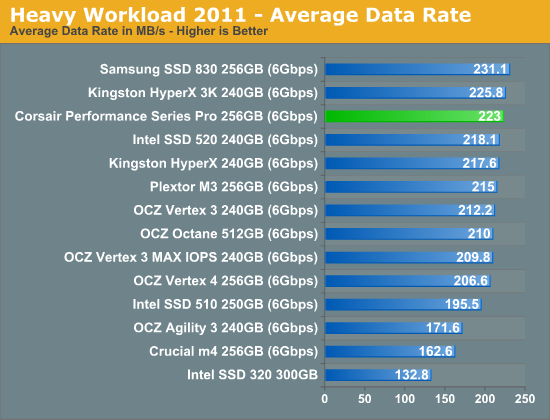
Samsung SSD 830 is still unbeatable but the Performance Pro turns out to be the fastest Marvell based SSD. It's only 3.7% faster than Plextor M3 though so the difference is not significant.
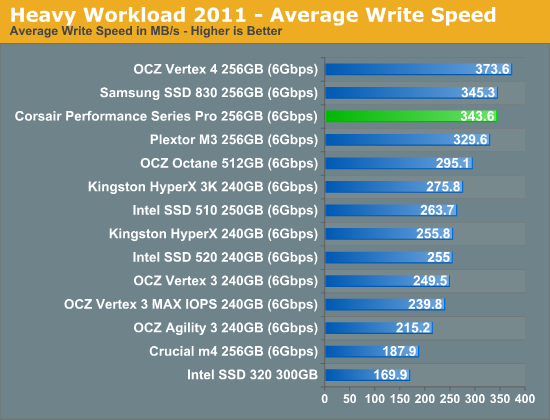
While Performance Pro was slower in sequential write performance when tested with compressible data, its outstanding incompressible sequential write speed makes it a bit faster than Plextor's M3. This is why it's always important not to look at just one benchmark when estimating the overall performance.
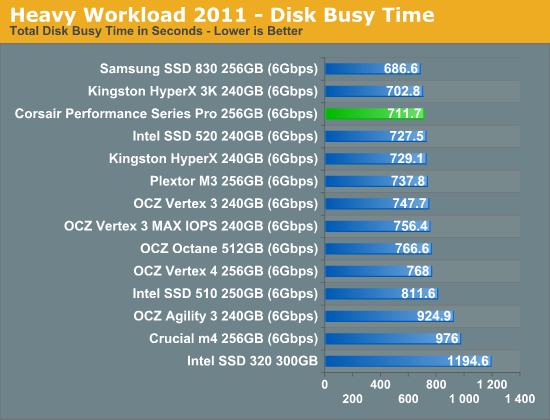
The next three charts just represent the same data, but in a different manner. Instead of looking at average data rate, we're looking at how long the disk was busy for during this entire test. Note that disk busy time excludes any and all idles; this is just how long the SSD was busy doing something:


41 Comments
View All Comments
SlyNine - Monday, May 14, 2012 - link
Put a M4 in my GF's computer and she has had no problems at all. Friend also has one and again no problems.Just because you have had issues doesn't mean someone else will, if they were that easily repeatable they would be easy to fix.
ShieTar - Monday, May 14, 2012 - link
Why does this article contain two tables with the exactly same lable "NewEgg Price Comparison (5/5/2012)" but very different numbers?Kristian Vättö - Monday, May 14, 2012 - link
If you loaded the article right when it went live, it's possible that you saw two different tables. I updated the prices just before I posted this, but forgot to copy-paste the new table to the final page. Both tables should be up to date now, though.CyberAngel_777 - Thursday, May 17, 2012 - link
I wish you had two different dates and prices just show the price fluctuationsand then later with updated data also updated prices
every drive should have thickness data recorded
thank you!
Coroder - Monday, May 14, 2012 - link
Does the vertex 4 drive in this test use the new firmware that was made available? It increases the speed in most tests by quite a bit.XJDHDR - Monday, May 14, 2012 - link
I believe they are waiting for the firmware to come out of beta testing.jwilliams4200 - Monday, May 14, 2012 - link
Lite-On owns Plextor, so it is misleading to say that Plextor buys the SSDs from Lite-On. It would be more accurate to say that the Plextor / Lite-On relationship is like the Crucial / Micron relationship.koinkoin - Monday, May 14, 2012 - link
At my company we use McAfee Endpoint Encryption, how does this affect the performance of the drives and how much does this change over time?I went for a Plextor M3 256GB and seem to be working fine as for now, but only got it now for 2weeks.
rlhunts - Monday, May 14, 2012 - link
My company also uses the McAfee Endpoint Encryption. I upgraded the WD 250 GB 7200 RPM drive to a Samsung 830 258 GB SSD in my Dell laptop (I5 2540M processor) a couple months ago. It definitely helps, especially with boot time, but McAfee EE adds a lot of processor overhead, which a drive can't help with. It's still slow as a slug compared to the same machine and software configuration without McAfee with a traditional 7200 rpm hard disk.Movieman420 - Monday, May 14, 2012 - link
In all fairness the Vertex 4 needs to be re-tested with the latest 1.4RC fw...or wait til it's final then flash up.