The Xeon E5-2600: Dual Sandy Bridge for Servers
by Johan De Gelas on March 6, 2012 9:27 AM EST- Posted in
- IT Computing
- Virtualization
- Xeon
- Opteron
- Cloud Computing
Benchmark Configuration
Unfortunately, the Intel R2208GZ4GSSPP is a 2U server, which makes it hard to compare it with the 1U Opteron "Interlagos" and 1U "Westmere EP" servers we have tested in the past. We will be showing you a few power consumption numbers, but since a direct comparison isn't possible, please take them with a grain of salt.
Intel's Xeon E5 server R2208GZ4GSSPP (2U Chassis)
| CPU |
Intel Xeon processor E5-2690 (2.9 GHz, 8c, 20MB L3, 135W) |
| RAM | 64 GB (8x8GB) DDR-1600 Samsung M393B1K70DH0-CK0 |
| Motherboard | Intel Server Board S2600GZ "Grizzly Pass" |
| Chipset | Intel C600 |
| BIOS version | SE5C600.86B (01/06/2012) |
| PSU | Intel 750W DPS-750XB A (80+ Platinum) |
The Xeon E5 CPUs have four memory channels per CPU and support DDR3-1600, and thus our dual CPU configuration gets eight DIMMs for maximum bandwidth. The typical BIOS settings can be found below.
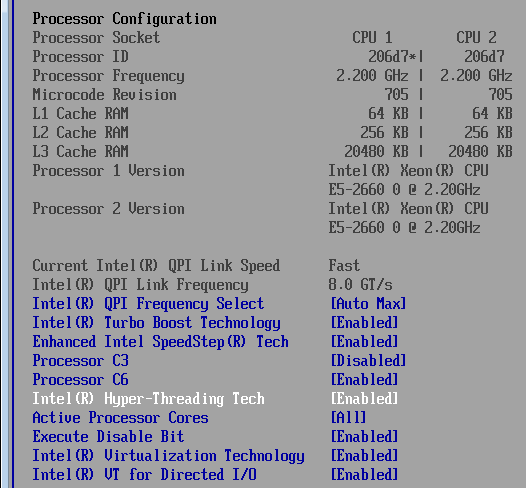
Not being show is that all prefetchers were enabled in all tests.
Supermicro A+ Opteron server 1022G-URG (1U Chassis)
| CPU |
Two AMD Opteron "Bulldozer" 6276 at 2.3GHz Two AMD Opteron "Magny-Cours" 6174 at 2.2GHz |
| RAM | 64GB (8x8GB) DDR3-1600 Samsung M393B1K70DH0-CK0 |
| Motherboard | SuperMicro H8DGU-F |
| Internal Disks |
2 x Intel SLC X25-E 32GB or 1 x Intel MLC SSD510 120GB |
| Chipset | AMD Chipset SR5670 + SP5100 |
| BIOS version | v2.81 (10/28/2011) |
| PSU | SuperMicro PWS-704P-1R 750Watt |
The same is true for the latest AMD Opterons: eight DDR3-1600 DIMMs for maximum bandwidth. You can find the BIOS settings of our Opteron machine here. C6 was enabled.
Asus RS700-E6/RS4 1U Server
| CPU |
Two Intel Xeon X5670 at 2.93GHz - 6 cores Two Intel Xeon X5650 at 2.66GHz - 6 cores |
| RAM | 48GB (12x4GB) Kingston DDR3-1333 FB372D3D4P13C9ED1 |
| Motherboard | Asus Z8PS-D12-1U |
| Chipset | Intel 5520 |
| BIOS version | 1102 (08/25/2011) |
| PSU | 770W Delta Electronics DPS-770AB |
To speed up testing, we tested the Intel Xeon and AMD Opteron system in parallel. As we didn't have more than eight 8GB DIMMs, we used our 4GB DDR3-1333 DIMMs. The Xeon system only gets 48GB, but this isn't a disadvantage as our highest memory footprint benchmark (vApus FOS, 5 tiles) uses no more than 40GB of RAM.
Finally, we measured the difference between 12x4GB and 8x8GB of RAM and recalculated the power consumption for our power measurements (note that the differences were very small). There is no alternative as our Xeon has three memory channels and cannot be outfitted with the same amount of RAM as our Opteron system (four channels).
Common Storage System
For the virtualization tests, each server gets an Adaptec 5085 PCIe x8 card (driver aacraid v1.1-5.1[2459] b 469512) connected to six Cheetah 300GB 15000 RPM SAS disks (RAID-0) inside a Promise JBOD J300. The virtualization testing requires more storage IOPs than our standard Promise JBOD with six SAS drives can provide. To counter this, we added internal SSDs:
- We installed the Oracle Swingbench VMs (vApus Mark II) on two internal X25-E SSDs (no RAID). The Oracle database is only 6GB big. We test with two tiles. On each SSD, each OLTP VM accesses its own database data. All other VMs (web, SQL Server OLAP) are stored on the Promise JBOD (see above).
- With vApus FOS, Zimbra is the I/O intensive VM. We spread the Zimbra data over the two Intel X25-E SSDs (no RAID). All other VMs (web, MySQL OLAP) get their data from the Promise JBOD (see above).
We monitored disk activity and measured the phyiscal disk adapter latency (as reported by VMware vSphere) at between 0.5 and 2.5 ms.
Software Configuration
All vApus testing was done one ESXi vSphere 5--VMware ESXi 5.0.0 (b 469512 - VMkernel SMP build-348481 Jan-12-2011 x86_64) to be more specific. All vmdks use thick provisioning, independent, and persistent. The power policy is "Balanced Power" unless indicated otherwise. All other testing was done on Windows 2008 Enterprise R2 SP1. Unless noted otherwise, we used the "High Performance setting" on Windows 2008 R2 SP1.
Other Notes
Both servers were fed by a standard European 230V (16 Amps max.) powerline. The room temperature was monitored and kept at 23°C by our Airwell CRACs.
We used the Racktivity ES1008 Energy Switch PDU to measure power consumption. Using a PDU for accurate power measurements might seem pretty insane, but this is not your average PDU. Measurement circuits of most PDUs assume that the incoming AC is a perfect sine wave, but it never is. However, the Rackitivity PDU measures true RMS current and voltage at a very high sample rate: up to 20,000 measurements per second for the complete PDU.


81 Comments
View All Comments
alpha754293 - Tuesday, March 6, 2012 - link
Thanks for running those.Are those results with HTT or without?
If you can write a little more about the run settings that you used (with/without HTT, number of processes), that would be great.
Very interesting results thought.
It would have been interesting to see what the power consumption and total energy consumption numbers would be for these runs (to see if having the faster processor would really be that beneficial).
Thanks!
alpha754293 - Tuesday, March 6, 2012 - link
I should work with you more to get you running some Fluent benchmarks as well.But, yes, HPC simulations DO take a VERY long time. And we beat the crap out of our systems on a regular basis.
jhh - Tuesday, March 6, 2012 - link
This is the most interesting part to me, as someone interested in high network I/O. With the packets going directly into cache, as long as they get processed before they get pushed out by subsequent packets, the packet processing code doesn't have to stall waiting for the packet to be pulled from RAM into cache. Potentially, the packet never needs to be written to RAM at all, avoiding using that memory capacity. In the other direction, web servers and the like can produce their output without ever putting the results into RAM.meloz - Tuesday, March 6, 2012 - link
I wonder if this Data Direct I/O Technology has any relevance to audio engineering? I know that latency is a big deal for those guys. In past I have read some discussion on latency at gearslutz, but the exact science is beyond me.Perhaps future versions of protools and other professional DAWs will make use of Data Direct I/O Technology.
Samus - Tuesday, March 6, 2012 - link
wow. 20MB of on-die cache. thats ridiculous.PwnBroker2 - Tuesday, March 6, 2012 - link
dont know about the others but not ATT. still using AMD even on the new workstation upgrades but then again IBM does our IT support, so who knows for the future.the new xeon's processors are beasts anyways, just wondering what the server price point will be.
tipoo - Tuesday, March 6, 2012 - link
"AMD's engineers probably the dumbest engineers in the world because any data in AMD processor is not processed but only transferred to the chipset."...What?
tipoo - Tuesday, March 6, 2012 - link
Think you've repeated that enough for one article?tipoo - Wednesday, March 7, 2012 - link
Like the Ivy bridge comments, just for future readers note that this was a reply to a deleted troll and no longer applies.IntelUser2000 - Tuesday, March 6, 2012 - link
Johan, you got the percentage numbers for LS-Dyna wrong.You said for the first one: the Xeon E5-2660 offers 20% better performance, the 2690 is 31% faster. It is interesting to note that LS-Dyna does not scale well with clockspeed: the 32% higher clockspeed of the Xeon E5-2690 results in only a 14% speed increase.
E5-2690 vs Opteron 6276: +46%(621/426)
E5-2660 vs Opteron 6276: +26%(621/492)
E5-2690 vs E5-2660: +15%(492/426)
In the conclusion you said the E5 2660 is "56% faster than X5650, 21% faster than 6276, and 6C is 8% faster than 6276"
Actually...
LS Dyna Neon-
E5-2660 vs X5650: +77%(872/492)
E5-2660 vs 6276: +26%(621/492)
E5-2660 6C vs 6276: +9%(621/570)
LS Dyna TVC-
E5-2660 vs X5650: +78%(10833/6072)
E5-2660 vs 6276: +35%(8181/6072)
E5-2660 6C vs 6276: +13%(8181/7228)
It's funny how you got the % numbers for your conclusions. It's merely the ratio of lower number vs higher number multiplied by 100.