ASUS F1A75-I Deluxe Review – Llano and Mini-ITX
by Ian Cutress on October 1, 2011 5:30 PM EST- Posted in
- Motherboards
- Asus
- A75
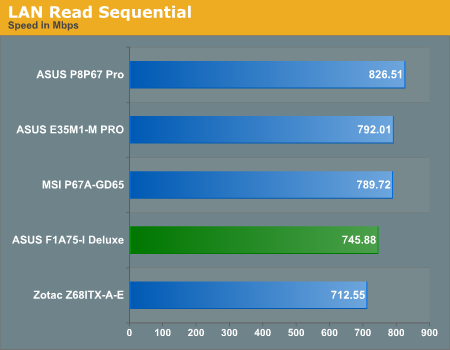
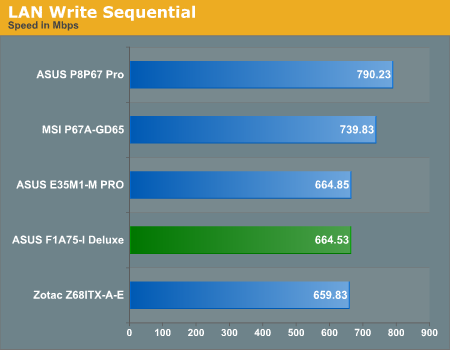
LAN Speed Test
LAN Speed Test is a freeware program designed for testing the network connection between two PCs on a home network. The speed of the transfer is limited by the lowest common denominator on the network, so if you have gigabit Ethernet capable computers but a 100 Mbit capable router, you are limited to 100 Mbit transfer. Note that this is really a formality – if a network port is rated at 1 Gbps, then chances are that it will hit at least 90+% of this value. For this test, we use LAN Speed Test to transfer a 1000 MB file across a home network with a 1 Gbps lowest common speed to the same machine each time, in a read/write scenario.
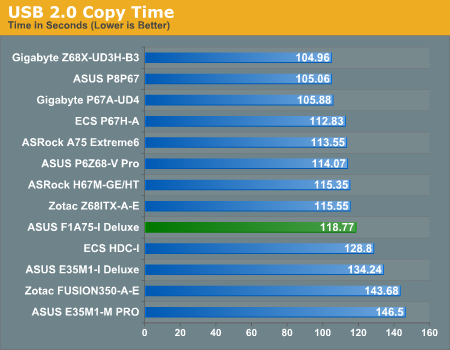
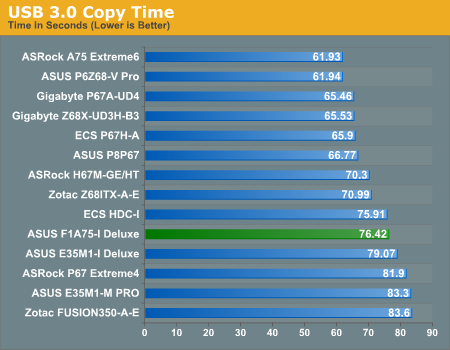
USB Speed
For this benchmark, we run CrystalDiskMark to determine the ideal sequential read and write speeds for the USB port using our 64GB Patriot SuperSpeed USB 3.0 drive. Then we transfer a set size of files from the SSD to the USB drive, and monitor the time taken to transfer. The files transferred are a 1.52 GB set of 2867 files across 320 folders – 95% of these files are small typical website files, and the rest (90% of the size) are the videos used in the Sorenson Squeeze test.
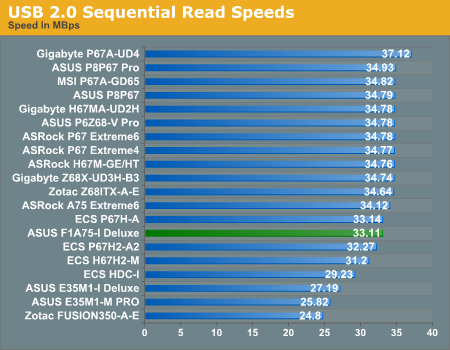
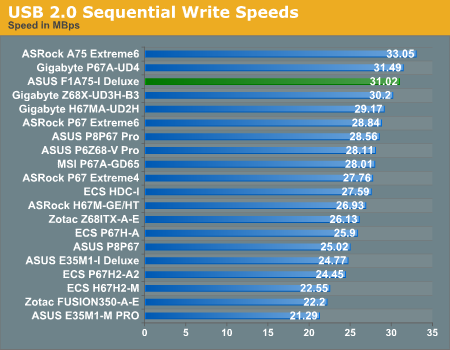
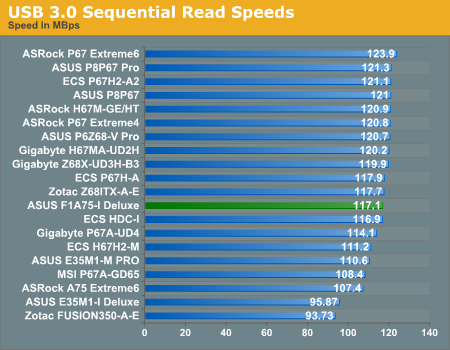
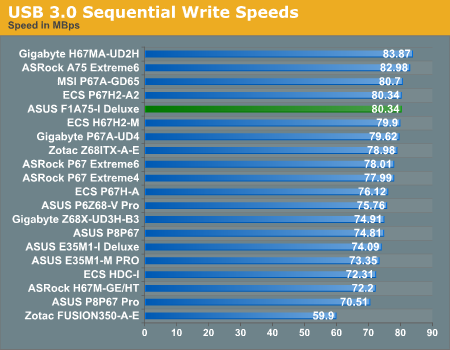
The F1A75-I Deluxe stands out in the USB 2.0 sequential writing performance test, but nothing particularly stands out in the other results.
SATA Testing
We also use CrystalDiskMark for SATA port testing. The operating system is installed on the Micron RealSSD C300, which is rated at 355 MB/s read and 215 MB/s write, and the sequential test is run at the 5 x 1000 MB level. This test probes the efficiency of the data delivery system between the chipset and the drive, or in the case of additional SATA ports provided by a third party controller, the efficiency between the controller, the chipset and the drive.
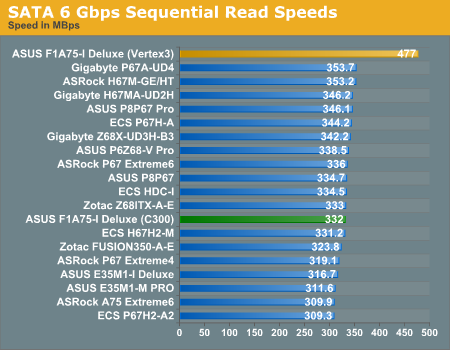
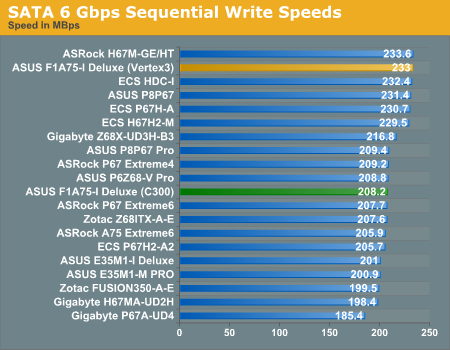
The SATA ports perform relatively standard in our sequential testing.
DPC Latency
Deferred Procedure Call latency is a way in which Windows handles interrupt servicing. In order to wait for a processor to acknowledge the request, the system will queue all interrupt requests by priority. Critical interrupts will be handled as soon as possible, whereas lesser priority requests, such as audio, will be further down the line. So if the audio device requires data, it will have to wait until the request is processed before the buffer is filled. If the device drivers of higher priority components in a system are poorly implemented, this can cause delays in request scheduling and process time, resulting in an empty audio buffer – this leads to characteristic audible pauses, pops and clicks. Having a bigger buffer and correctly implemented system drivers obviously helps in this regard. The DPC latency checker measures how much time is processing DPCs from driver invocation – the lower the value will result in better audio transfer at smaller buffer sizes. Results are measured in microseconds and taken as the peak latency while cycling through a series of short HD videos - less than 500 microseconds usually gets the green light, but the lower the better.
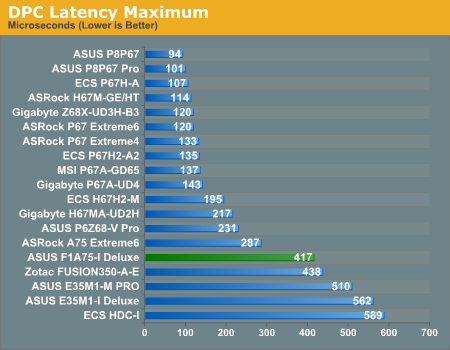
My initial findings gave a DPC Latency reading around 1000 microseconds, and would randomly jump to 3000 microseconds. Eventually I was able to track down my source of the issue - the ASUS AI Suite II software, which automatically starts up on boot when installed. When this software is turned off, my DPC latency would reduce to a sub 500 microsecond level. Note, many users wont actually notice a 3000 microsecond latency - after speaking with ASUS, they seem to have had some issues replicating this issue. However, there is a quick fix if it is an issue for any user. I would also like to note that this issue may be fixed in later BIOS versions when the board comes to market.


51 Comments
View All Comments
jensend - Sunday, October 2, 2011 - link
You're totally wrong. The 80 Plus standard tells you how efficient the PSU is at 20%, 50%, and 100% of its rated capacity. PSUs are usually most efficient at around 2/3 of their capacity, and though they can be almost as efficient at full load, efficiency inevitably drops off sharply for loads which are ~15% of the full load or below.For a 1KW PSU like the one used in the review, they only had to meet efficiency targets at 200W to get certified; it's probably operating at only ~60% efficiency when these machines are idling at around 30W. Even an 80 Plus Platinum 1000W PSU is likely to be no more efficient than a non-80 Plus-certified 300W PSU for the sub-100 wattages most computers use most of the time.
The 80 Plus certification program is badly designed. Too many people think they're getting an efficient PSU when the PSU is only efficient at wattages they'll never use, and manufacturers make more high wattage PSUs because it is easier to be high efficiency and get certified at ridiculously high wattages.
nubie - Sunday, October 2, 2011 - link
Exactly, the only way to be sure what the BOARD draw is would be to measure the 12v 3.3v and 5v lines going to the board.Re $119 deal, I don't think that is available to anyone anymore, $139 for just that processor on Newegg.
Nforce graphics are notoriously power hungry, I should know I have had half a dozen of them. That comparison is silly.
Did you try the true Dual Core AMD without the latency-adding L3 cache? The Athlon II x2 2x1MB Lvl 2 models are decent. You can find them for around $35 if you keep a lookout, I wouldn't knock it.
The 5 watts you may potentially save is nothing compared to what your monitor or an inefficient sound system may draw.
hp79 - Monday, October 3, 2011 - link
Yeah, before I upgraded the AMD system to X3 last year, it had a AMD BE 2300 in it. It sucked around 40W at the time and I was happy about the power consumption. But the thing was too slow even for normal web surf and stuff so I upgraded the CPU.I know the 80 Plus does not mean it's all-the-way 80% or more efficient. I was thinking that it can't be that far off even if it is at 10% load. In this case, it's even lower than that, and thinking again, it does make a lot of difference in such a small load.
Comparing this AMD system again with Intel Sandy Bridge system, unless you need to play games with so-so graphics of Llano, I don't think it's worth it to use it for HTPC usage. I read reviews that idling at 20W is normal for Sandy Bridge systems. I believe my desktop power usage will also drop to those levels if I take off my GTX 460 graphics card. Sure, if it was 5W we are talking about, it's not a big deal. But 50W AMD vs 20W Intel is a lot. Yes, I agree the test is flawed so they should redo the test using a lower wattage PSU.
Death666Angel - Monday, October 3, 2011 - link
Just a quick info: my HTPC build with these components:60W pico psu
AsRock A75M-ITX
A6-3500 (triple core)
2*2GB 1866MHZ (8/8/8/T1)
500GB 2.5" HDD Toshiba (still need a MicroSATA adapter for my 1.8" SSD)
draws ~51W when using Linx with 3 threads (it goes to P0 with 2.1GHZ). It draws ~56W when I set P0 as the B0 with 2.4GHz. With medium activity (web browsing while installing windows updates) I get ~35W. In idle I have between ~25W and ~30W.
Btw. this is all with K10Stat lowering the votlages by betwem .2V (P6,P5), .3 (P4) and .4V (P3-P0 and B0). Which is kinda ridiculous and makes you wonder if AMD did this on purpose to not conflict with their Brazos line....
Anyway, I think those voltages are pretty sweet.
jensend - Tuesday, October 4, 2011 - link
What case are you using? I'm planning on doing a very similar build (though with a higher capacity picopsu) and I'm having trouble settling on a case.Roland00Address - Sunday, October 2, 2011 - link
1) The item to my understanding is not on the market yet. Made more evident via an estimated price instead of a real one.2) Uses a pre-release bios
3) Item was shipped via ASUS, when previous we were told via Anandtech motherboard reviews (not neccessary other items such as laptops) would be bought on the open market.
We were told these policies were going to be implemented due to the disaster that was testing on the x58 roundup less than 3 years ago.
I do appreciate this article and I enjoyed reading it, but I believe it should be called a preview and not a review.
Nihility - Sunday, October 2, 2011 - link
It would be nice to know how long it takes EFI on different motherboards to finish loading.Especially with Windows 8 and its faster boot speed, it's an important metric.
Some older BIOSes when set to AHCI and RAID would take 20 seconds to load, I'd like to be able to avoid such products in the future.
Death666Angel - Sunday, October 2, 2011 - link
Why?All that really counts is that you can see how component x (ASUS mini ITX) fares against a competing component y (AsRock ATX), so you can make the decision what is better for your usage model. This standardized test setup delivers that. It does not show the performance, power consumption etc. that you will see at home, but it does show the difference between different components.
If this motherboards draws more power vs. the other tested FM1 from AsRock, it is true to say that the same would be true for you at home, same thing with different performance deltas.
I think this is the best setup if you want the biggest overall comparison size while still not devoting all your time. Because time really is the #1 constraint here.
AnandThenMan - Sunday, October 2, 2011 - link
You're just making excuses. Other sites are using proper better testing methods, what is the problem here? No one, and I mean no one, is going to pair this system with a 1000 watt power supply, and I don't know about you, but I like to read reviews that reflect how a typical system is actually going to be configured and used.Death666Angel - Monday, October 3, 2011 - link
I would like that as well, but I understand the time constraints behind it, because testing every system according to their usage will mean testing every system at least 2 to 3 times. This ITX mainboard could be used in a HTPC with a pico PSU, but it could also be used in a Lian Li case with 6 3.5" HDDs for a selfmade mini-NAS, which would need more power. You would also need to test other motherboards with this little pico PSU, because otherwise you cannot compare the motherboards to one another.In a perfect world, we would have 5 different setups for this motherboard, the HTPC with pico PSU and undervolted. The HTPC with a pico PSU and an additional graphics card. The mini-NAS with 5-8 3.5" HDDs. The gamer PC with a powerful graphics card and overclocked CPU. And maybe the 5th can be overclocked CPU with pico PSU as HTPC with better decoding capabilities.
Every one of those usages probably has readers who are interested in it. And then you would need to have all those test setups applied to every other FM1 motherboard or else you cannot decide which one uses the least power, has the best overclock etc. You see the problem you start running into without a few standardized test setups?
I'm not making excuses, why would I? I have no affiliation to this website and am just a reader.