OCZ Vertex 3 MAX IOPS & Patriot Wildfire SSDs Reviewed
by Anand Lal Shimpi on June 23, 2011 4:35 AM ESTAnandTech Storage Bench 2011
Last year we introduced our AnandTech Storage Bench, a suite of benchmarks that took traces of real OS/application usage and played them back in a repeatable manner. I assembled the traces myself out of frustration with the majority of what we have today in terms of SSD benchmarks.
Although the AnandTech Storage Bench tests did a good job of characterizing SSD performance, they weren't stressful enough. All of the tests performed less than 10GB of reads/writes and typically involved only 4GB of writes specifically. That's not even enough exceed the spare area on most SSDs. Most canned SSD benchmarks don't even come close to writing a single gigabyte of data, but that doesn't mean that simply writing 4GB is acceptable.
Originally I kept the benchmarks short enough that they wouldn't be a burden to run (~30 minutes) but long enough that they were representative of what a power user might do with their system.
Not too long ago I tweeted that I had created what I referred to as the Mother of All SSD Benchmarks (MOASB). Rather than only writing 4GB of data to the drive, this benchmark writes 106.32GB. It's the load you'd put on a drive after nearly two weeks of constant usage. And it takes a *long* time to run.
1) The MOASB, officially called AnandTech Storage Bench 2011 - Heavy Workload, mainly focuses on the times when your I/O activity is the highest. There is a lot of downloading and application installing that happens during the course of this test. My thinking was that it's during application installs, file copies, downloading and multitasking with all of this that you can really notice performance differences between drives.
2) I tried to cover as many bases as possible with the software I incorporated into this test. There's a lot of photo editing in Photoshop, HTML editing in Dreamweaver, web browsing, game playing/level loading (Starcraft II & WoW are both a part of the test) as well as general use stuff (application installing, virus scanning). I included a large amount of email downloading, document creation and editing as well. To top it all off I even use Visual Studio 2008 to build Chromium during the test.
The test has 2,168,893 read operations and 1,783,447 write operations. The IO breakdown is as follows:
| AnandTech Storage Bench 2011 - Heavy Workload IO Breakdown | ||||
| IO Size | % of Total | |||
| 4KB | 28% | |||
| 16KB | 10% | |||
| 32KB | 10% | |||
| 64KB | 4% | |||
Only 42% of all operations are sequential, the rest range from pseudo to fully random (with most falling in the pseudo-random category). Average queue depth is 4.625 IOs, with 59% of operations taking place in an IO queue of 1.
Many of you have asked for a better way to really characterize performance. Simply looking at IOPS doesn't really say much. As a result I'm going to be presenting Storage Bench 2011 data in a slightly different way. We'll have performance represented as Average MB/s, with higher numbers being better. At the same time I'll be reporting how long the SSD was busy while running this test. These disk busy graphs will show you exactly how much time was shaved off by using a faster drive vs. a slower one during the course of this test. Finally, I will also break out performance into reads, writes and combined. The reason I do this is to help balance out the fact that this test is unusually write intensive, which can often hide the benefits of a drive with good read performance.
There's also a new light workload for 2011. This is a far more reasonable, typical every day use case benchmark. Lots of web browsing, photo editing (but with a greater focus on photo consumption), video playback as well as some application installs and gaming. This test isn't nearly as write intensive as the MOASB but it's still multiple times more write intensive than what we were running last year.
As always I don't believe that these two benchmarks alone are enough to characterize the performance of a drive, but hopefully along with the rest of our tests they will help provide a better idea.
The testbed for Storage Bench 2011 has changed as well. We're now using a Sandy Bridge platform with full 6Gbps support for these tests. All of the older tests are still run on our X58 platform.
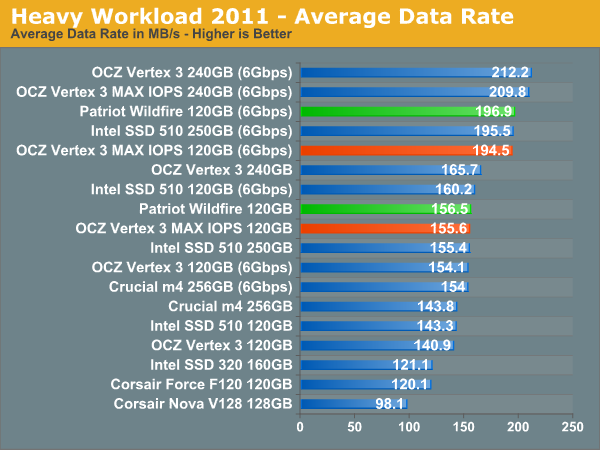
AnandTech Storage Bench 2011 - Heavy Workload
We'll start out by looking at average data rate throughout our new heavy workload test:
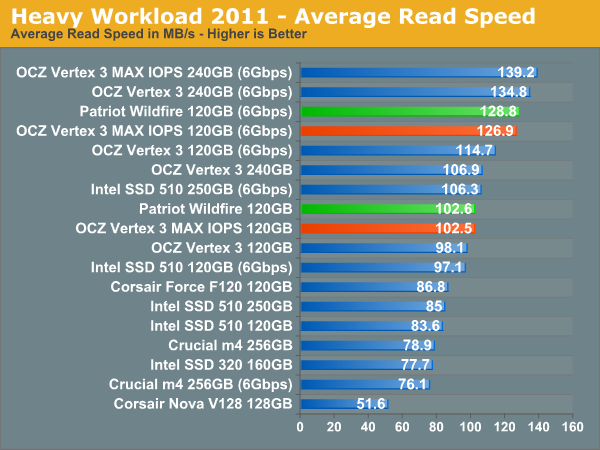
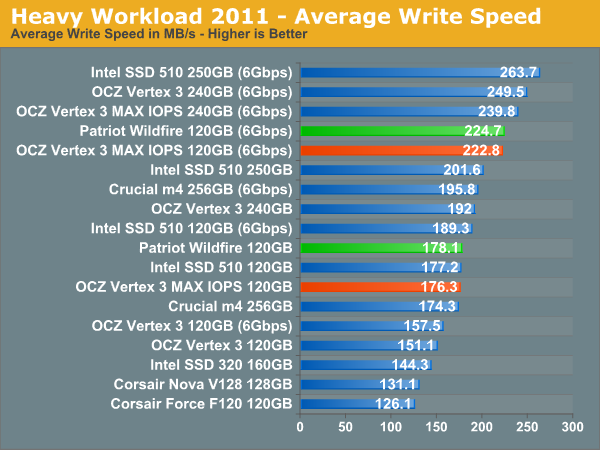
The breakdown of reads vs. writes tells us more of what's going on:
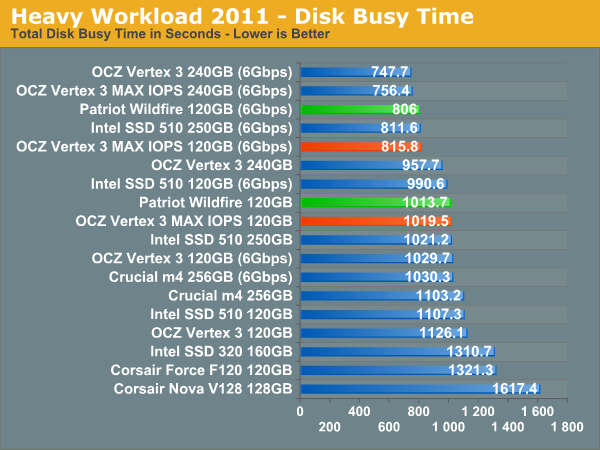
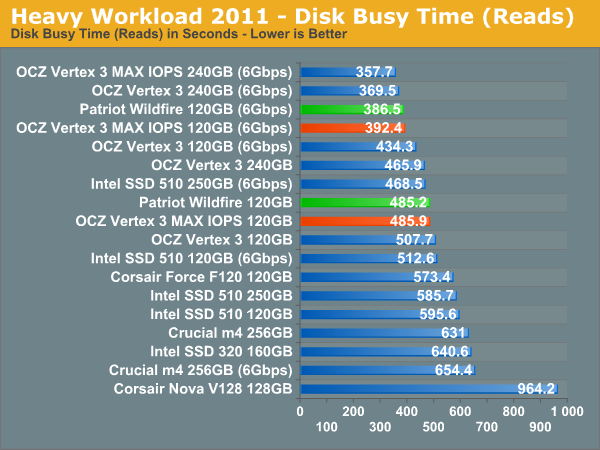
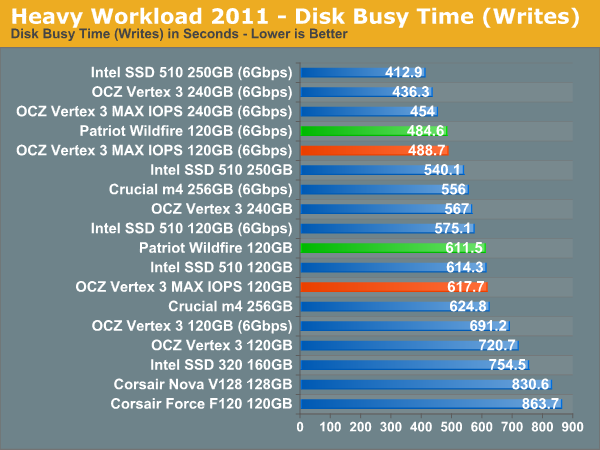
The next three charts just represent the same data, but in a different manner. Instead of looking at average data rate, we're looking at how long the disk was busy for during this entire test. Note that disk busy time excludes any and all idles, this is just how long the SSD was busy doing something:


112 Comments
View All Comments
Chloiber - Thursday, June 23, 2011 - link
Hi Anand,is it possible to do the same (1 hour) torture tests for other SSDs such as Intel 320, Intel 510 and C300/m4? It would be interesting to see how the, in my opinion, huge performance hit with the Sandforce drives compares to other SSDs/controllers.
Impulses - Thursday, June 23, 2011 - link
I think he's done similar tests in past reviews, though probably not the very same 60 min test. Crucial drives had issues recovering from similar situations, and Intel drives were the most resilient (shocking right?). The SF drives are particularly susceptible to that sort of degradation when hammering them with incompressible data due to the very nature of how their compression algorithm works.That's one reason I've never been very high on SF drives... Currently I have two Intel drives being used as OS drives (where that sorta scenario is improbable), but if I decided to upgrade the desktop OS drive I could very well end up using one of those smaller drives as a scratch disk for working with video, or as a spare disk for game installs. SF wouldn't necessarily be ideally suited for that.
Chloiber - Friday, June 24, 2011 - link
Yes, but without the same 60mins the comparison is pretty much useless, sadly. You can see this very well in the Agility 3 review - nearly no performance drop with 20min torture test.I know that the SF drives drop performance to about 65% (write), both SF1 and SF2. And that it's not a state that you reach when you torture your drive is known because nearly everyone who does a ASS benchmark some month after the initial use show the lower performance (in case of SF2 that's 70-90MB/s seq. write).
But I'd like to see a direct comparison from Anand, would just be great.
And yes - that's also a reason why I won't buy SF drives. I just don't like it how they try to confuse customers. They say 450MB/s+ write...yeah right. In a very special case. And even worse, it drops down even more. Intel is honest about the performance of their SSD, that's what I like about it. But I'm pretty sure SF gained countless customers just because of those "incredible" performance stats.
Phil NBR - Thursday, June 23, 2011 - link
"So why not exclusively use real world performance tests? It turns out that although the move from a hard drive to a decent SSD is tremendous, finding differences between individual SSDs is harder to quantify in a single real world metric. "I don't think it's that hard. Sites like Hardwareheaven and Techspot show meaningful differences between SSDs in real world settings. I would like to see Anandtech include real real world benchmarks again. I/O bound benchmarks don't tell the whole story.
ckryan - Thursday, June 23, 2011 - link
It's my belief that these real world tests are contrived in and of themselves to some degree.Impulses - Thursday, June 23, 2011 - link
I don't frequent Hardware Heaven often but I do like the way they compare and present results for their GPU reviews, so I went looking for their "real world" SSD tests when I saw that comment. Out of the 5 or 6 tests like 3 or 4 are just large sequential read/write tests... Sure seeing 200 minutes vs 210 minutes might be somewhat more intuitive than a generic benchmark score, but it doesn't tell you a whole lot more tbh. It's all basically just OS/game install tests and file transfer/scan tests, with two exceptions...One is their OS boot up test, where the difference between all current drives is usually 2-3 sec at most (time to hibernate and resume might be more valuable imo), and the other is an HD video capture test that might actually be the only real world test they're doing of any actual value. It showcases the biggest disparity between the drives (due to sequential write speeds using raw uncompressed footage), and it really is something you could be doing day in and day out and not easily represented by synthetic benchmarks or some of the other test scenarios Anand uses. Worth looking into...
cjs150 - Thursday, June 23, 2011 - link
Seems to be a lot of conspiracy theorists about today.I read Anandtech because I do not detect bias. When it is wrong he will tell us. Sometimes I do not understand what he is saying - but that is because I am an amateur geek not a full time pro!
Now my noob question.
What is best way of setting up a system with an SSD and a traditional HD. Should I use the SSD for OS and programs and the HD for widows swap file. Or would it be fine to use the SSD for all OS functions? Happy to partition the HD so that there is a small partition for the OS swap
Impulses - Thursday, June 23, 2011 - link
Leave the swap file alone, Windows manages it just fine and a Windows engineer was quoted during the launch of Win7 as saying that SSD are particularly well suited for the swap file's purpose... If you have enough RAM it's gonna see little use besides background maintenance Windows does of active processes. Just install your OS and apps as you normally do on the SSD, let Win7 partition it (or Vista, if you're using XP you'll wanna look into proper partition alignment), and then use your HDD for large game installs that don't fit on the SSD and data.If you have lots of games at any one time it's worth looking into system links or junction links, they provide any easy way to move game directories to the SSD and back w/o altering or affecting the existing install (or w/o messing w/registry keys, it's like an OS level shortcut that's transparent to the programs).
If you have a small SSD (and particularly if you have lots of RAM), it's worth turning off hibernate as the hibernate file will take up a few GB of space on the drive (depending on the amount of RAM). Swap file should be dynamic and shouldn't grow too large if it's rarely used.
jwilliams4200 - Thursday, June 23, 2011 - link
Did I miss where you commented on the Desktop Iometer - 4KB Random Read chart?The 120GB Vertex 3 Max IOPS and the Patriot Wildfire were in the basement, with 35 MB/s or lower performance.
What is going on?
Anand Lal Shimpi - Thursday, June 23, 2011 - link
The 240GB Vertex 3 results were a typo, I've updated/corrected that entry. The Toshiba 32nm drives are even slower, likely due to the specific characteristics of that NAND vs. the IMFT devices.Random read performance is a weak area of many drives this generation for some reason. Even Crucial's m4 is slower than last year's C300 in this department.
Take care,
Anand