The OCZ Vertex 3 Review (120GB)
by Anand Lal Shimpi on April 6, 2011 6:32 PM ESTAnandTech Storage Bench 2011
I didn't expect to have to debut this so soon, but I've been working on updated benchmarks for 2011. Last year we introduced our AnandTech Storage Bench, a suite of benchmarks that took traces of real OS/application usage and played them back in a repeatable manner. I assembled the traces myself out of frustration with the majority of what we have today in terms of SSD benchmarks.
Although the AnandTech Storage Bench tests did a good job of characterizing SSD performance, they weren't stressful enough. All of the tests performed less than 10GB of reads/writes and typically involved only 4GB of writes specifically. That's not even enough exceed the spare area on most SSDs. Most canned SSD benchmarks don't even come close to writing a single gigabyte of data, but that doesn't mean that simply writing 4GB is acceptable.
Originally I kept the benchmarks short enough that they wouldn't be a burden to run (~30 minutes) but long enough that they were representative of what a power user might do with their system.
Not too long ago I tweeted that I had created what I referred to as the Mother of All SSD Benchmarks (MOASB). Rather than only writing 4GB of data to the drive, this benchmark writes 106.32GB. It's the load you'd put on a drive after nearly two weeks of constant usage. And it takes a *long* time to run.
I'll be sharing the full details of the benchmark in some upcoming SSD articles but here are some details:
1) The MOASB, officially called AnandTech Storage Bench 2011 - Heavy Workload, mainly focuses on the times when your I/O activity is the highest. There is a lot of downloading and application installing that happens during the course of this test. My thinking was that it's during application installs, file copies, downloading and multitasking with all of this that you can really notice performance differences between drives.
2) I tried to cover as many bases as possible with the software I incorporated into this test. There's a lot of photo editing in Photoshop, HTML editing in Dreamweaver, web browsing, game playing/level loading (Starcraft II & WoW are both a part of the test) as well as general use stuff (application installing, virus scanning). I included a large amount of email downloading, document creation and editing as well. To top it all off I even use Visual Studio 2008 to build Chromium during the test.
Update: As promised, some more details about our Heavy Workload for 2011.
The test has 2,168,893 read operations and 1,783,447 write operations. The IO breakdown is as follows:
| AnandTech Storage Bench 2011 - Heavy Workload IO Breakdown | ||||
| IO Size | % of Total | |||
| 4KB | 28% | |||
| 16KB | 10% | |||
| 32KB | 10% | |||
| 64KB | 4% | |||
Only 42% of all operations are sequential, the rest range from pseudo to fully random (with most falling in the pseudo-random category). Average queue depth is 4.625 IOs, with 59% of operations taking place in an IO queue of 1.
Many of you have asked for a better way to really characterize performance. Simply looking at IOPS doesn't really say much. As a result I'm going to be presenting Storage Bench 2011 data in a slightly different way. We'll have performance represented as Average MB/s, with higher numbers being better. At the same time I'll be reporting how long the SSD was busy while running this test. These disk busy graphs will show you exactly how much time was shaved off by using a faster drive vs. a slower one during the course of this test. Finally, I will also break out performance into reads, writes and combined. The reason I do this is to help balance out the fact that this test is unusually write intensive, which can often hide the benefits of a drive with good read performance.
There's also a new light workload for 2011. This is a far more reasonable, typical every day use case benchmark. Lots of web browsing, photo editing (but with a greater focus on photo consumption), video playback as well as some application installs and gaming. This test isn't nearly as write intensive as the MOASB but it's still multiple times more write intensive than what we were running last year.
As always I don't believe that these two benchmarks alone are enough to characterize the performance of a drive, but hopefully along with the rest of our tests they will help provide a better idea.
The testbed for Storage Bench 2011 has changed as well. We're now using a Sandy Bridge platform with full 6Gbps support for these tests. All of the older tests are still run on our X58 platform.
AnandTech Storage Bench 2011 - Heavy Workload
We'll start out by looking at average data rate throughout our new heavy workload test:
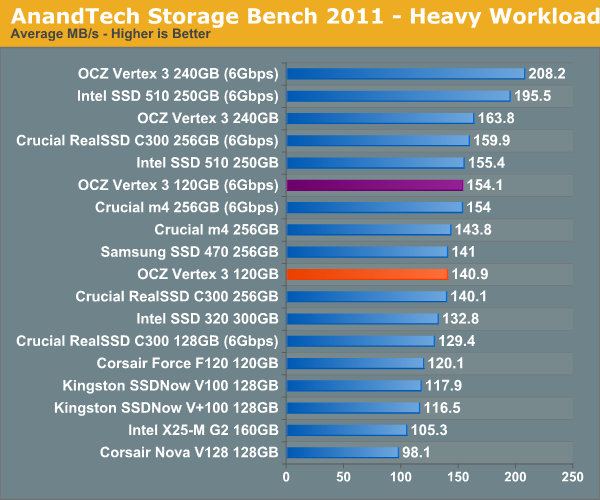
In our heavy test for 2011 the 120GB Vertex 3 is noticeably slower than the 240GB sample we tested a couple of months ago. Fewer available die are the primary explanation. We're still waiting on samples of the 120GB Intel SSD 320 and the Crucial m4 but it's looking like this round will be more competitive than we originally thought.
The breakdown of reads vs. writes tells us more of what's going on:
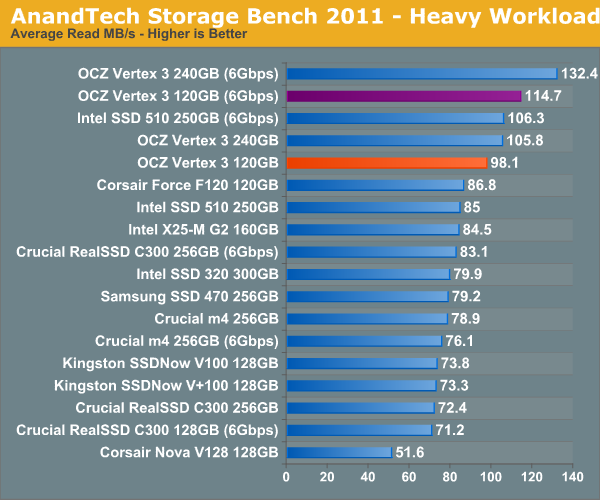
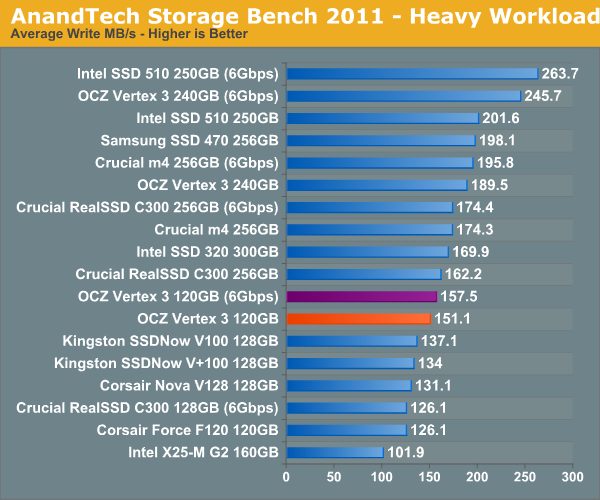
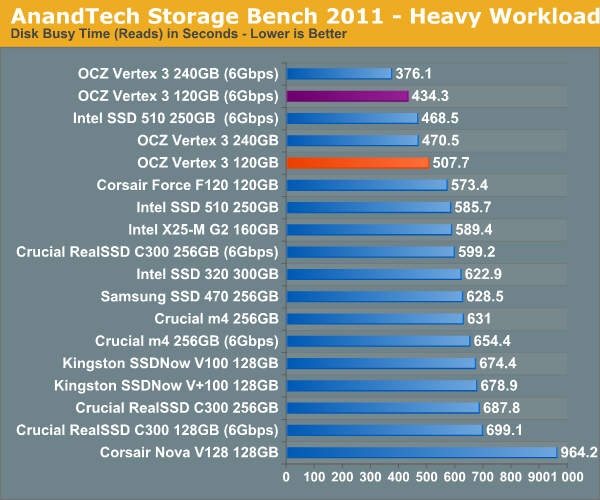
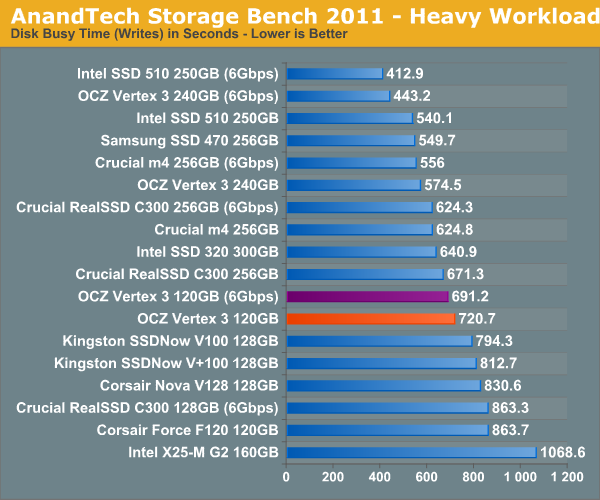
Surprisingly enough it's not read speed that holds the 120GB Vertex 3 back, it's ultimately the lower (incompressible) write speed:
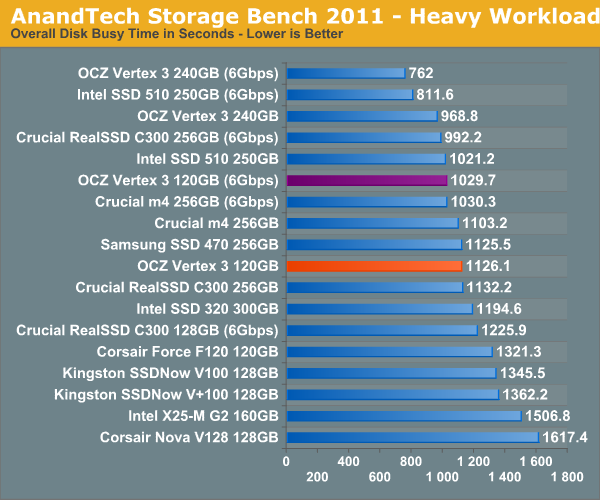
The next three charts just represent the same data, but in a different manner. Instead of looking at average data rate, we're looking at how long the disk was busy for during this entire test. Note that disk busy time excludes any and all idles, this is just how long the SSD was busy doing something:


153 Comments
View All Comments
kensiko - Thursday, April 7, 2011 - link
It's true, I never saw any big company letting customers having so much impact on them. The forum is really the big thing here.lukechip - Wednesday, April 6, 2011 - link
I've just bought an 80GB Vertex 2. OCZ state that only "E" parts are affected, but at StorageReview, they show that they had a non "E" part which contained 25nm NAND. Also, OCZ say that the only parts affected are the 60 GB and 120 GB models.I've just purchased an 80 GB model, and have no idea what is inside it, nor whether I'd prefer it to be an 'old' one or a 'new' one.
The new SKUs that Anand listed indicate that moving forwards, all 80, 160 and 200 GB Vertex 2 units will be 25nm only, and all 60, 120 and 240 GB Vertex 2 units will be 34nm only. I can't imagine they can keep this up for long, as 34nm runs out and they have to move the 60, 120 and 240 GB models to 25 nm.
What I suspect is that prior to 25 nm NAND becoming available, all 80 GB units used the Hynix 32 nm NAND. Based on Anand's tests, I suspect this mean they were the worst performing units in the line up. 80 GB units built using the new 25 nm NAND would actually perform better than those built with Hynix 32 nm NAND.
So whereas 60 GB and 120 GB customers really want to have a unit based on 34 nm NAND, 80 GB customers like me really want to have a drive based on 25 nm NAND. Hence OCZ are not offering replacements for 80 GB units. A new 80 GB unit is better than an old 80 GB unit, even though it is not as good as an old 60 GB unit
So my questions are:
1/ Is what I am suggesting above true ?
2/ How can I tell what NAND I've got ? I've updated the firmware on my 80 GB unit soon after buying it, so the approach of using firmware version to determine NAND type doesn't seem too reliable to me ?
Personally, I find my unit plenty fast enough. And I understand that OCZ and other SSD vendors must accomodate what their suppliers present them with. However the lack of tranparency, and the "lucky dip" approach that we have to take when buying an SSD from OCZ lead me to conclude that they
1/ don't respect their customers and/or
2/ are very naive and stupid to expect that customers won't notice them pulling a 'bait and switch'
B3an - Thursday, April 7, 2011 - link
Anand... you seem to have forgotten something in your conclusion. You say it's best to go for the 240GB if torn between that and the 120GB. But being as two 120GB Vertex 3's are only very slightly more expensive than the 240GB version, wouldn't it make more sense to just get two 120GB's for RAID 0? Because you'd get considerably better performance than the 240GB then considering how well SSD's scale in RAID 0.Really great and interesting review BTW.
Alopex - Thursday, April 7, 2011 - link
I'd really like to see this question addressed, as well. According to several tests, SSDs scale in pretty much all categories after a minimal queue depth. It seems like the random reads here are the 120gb model's achilles' heel, but given the linearity of the scaling, it might be safe-ish to assume that 2x 120gb RAID 0 will equal 1x 240gb. For nearly the same price, it would then seem you get the same storage size, fixed the discrepancy between the two models, and hopefully see significant performance gains in the other categories like sequential read/write.I'm building a new computer at the moment, and in light of this article, I'm still planning to go with 2x 120gb Vertex 3s in RAID 0, unless someone can provide a convincing argument to do otherwise. At the moment, the only thing that really makes me hesitate is to see what the other vendors have planned for "next-gen" SSD performance. Then again, if I had that attitude I'd be waiting forever ;-)
Many thanks for the article, though!
casteve - Thursday, April 7, 2011 - link
No TRIM available in RAID.B3an - Thursday, April 7, 2011 - link
Not a big problem. I've had 3 different SSD sets in RAID 0 over the years, and i've not needed TRIM. And a certain crappy OS with a fruity theme dont even support TRIM without a hack job.ComputerNovice22 - Thursday, April 7, 2011 - link
You wrote "In the worst case comparison the F120 we have here is 30% faster than your 34nm Hynix Vertex 2."
I believe you meant 32nm Hynix, I'm not sure I'm right or not and I'm not trying to be one of those people that just likes to be right either, just wanted to let you know just in-case.
On another note though I LOVE the article, I bought a vertex 2 recently and I was very angry with OCZ after I hooked it up and realized it was a 25nm SSD ... I ended up just buying a 120Gb (510 elm-crest)
Lux88 - Thursday, April 7, 2011 - link
1. Thank you for investigating NAND performance so thoroughly.2. Thank you for benching drives with "common" capacities.
3. Thank you for protecting consumer interests.
Great article. Great site. Fantastic Anand.
sor - Thursday, April 7, 2011 - link
I worked at a Micron test facility years ago. I can only speak for DRAM, but I imagine NAND is much the same. Whenever someone drops a tray of chips and they go sprawling all over the floor... SpekTek. Whenever a machine explodes and starts crunching chips... SpekTek. I used to laugh when I saw PNY memory in BestBuy with a SpecTek mark on its chips selling for 2x what good RAM at newegg would cost.Basically anything that's dropped, damaged, or doesn't meet spec somehow, gets put into SpecTek and re-binned according to what it's now capable of. It's a brand that allows Micron to make money off of otherwise garbage parts, without diluting their own brand. On the good end the part may have just had some bent leads that needed to be fixed, on the bad end the memory can be sold and run at much slower specs or smaller capacity (blowing fuses in the chip to disable bad parts), or simply scrapped altogether.
sleepeeg3 - Thursday, April 7, 2011 - link
Thanks for the info, but IMO the bottom line is if it works reliably and it allows them to deliver something at a lower price, I am all for it. If it backfires on them and they get massive failure rates, consumers will respond by buying someone else's product. That's the beauty of capitalism.