The OCZ Vertex 3 Review (120GB)
by Anand Lal Shimpi on April 6, 2011 6:32 PM ESTThe NAND Matrix
It's not common for SSD manufacturers to give you a full list of all of the different NAND configurations they ship. Regardless how much we appreciate transparency, it's rarely offered in this industry. Manufacturers love to package all information into nice marketable nuggets and the truth doesn't always have the right PR tone to it. Despite what I just said, below is a table of every NAND device OCZ ships in its Vertex 2 and Vertex 3 products:
| OCZ Vertex 2 & Vertex 3 NAND Usage | ||||
| Process Node | Capacities | |||
| Intel L63B | 34nm | Up to 240GB | ||
| Micron L63B | 34nm | Up to 480GB | ||
| Spectek L63B | 34nm | 240GB to 360GB | ||
| Hynix | 32nm | Up to 120GB | ||
| Micron L73A | 25nm | Up to 120GB | ||
| Micron L74A | 25nm | 160GB to 480GB | ||
| Intel L74A | 25nm | 160GB to 480GB | ||
The data came from OCZ and I didn't have to sneak around to get it, it was given to me by Alex Mei, Executive Vice President of OCZ.
You've seen the end result, now let me explain how we got here.
OCZ accidentally sent me a 120GB Vertex 2 built with 32nm Hynix NAND. I say it was an accident because the drive was supposed to be one of the new 25nm Vertex 2s, but there was a screwup in ordering and I ended up with this one. Here's a shot of its internals:
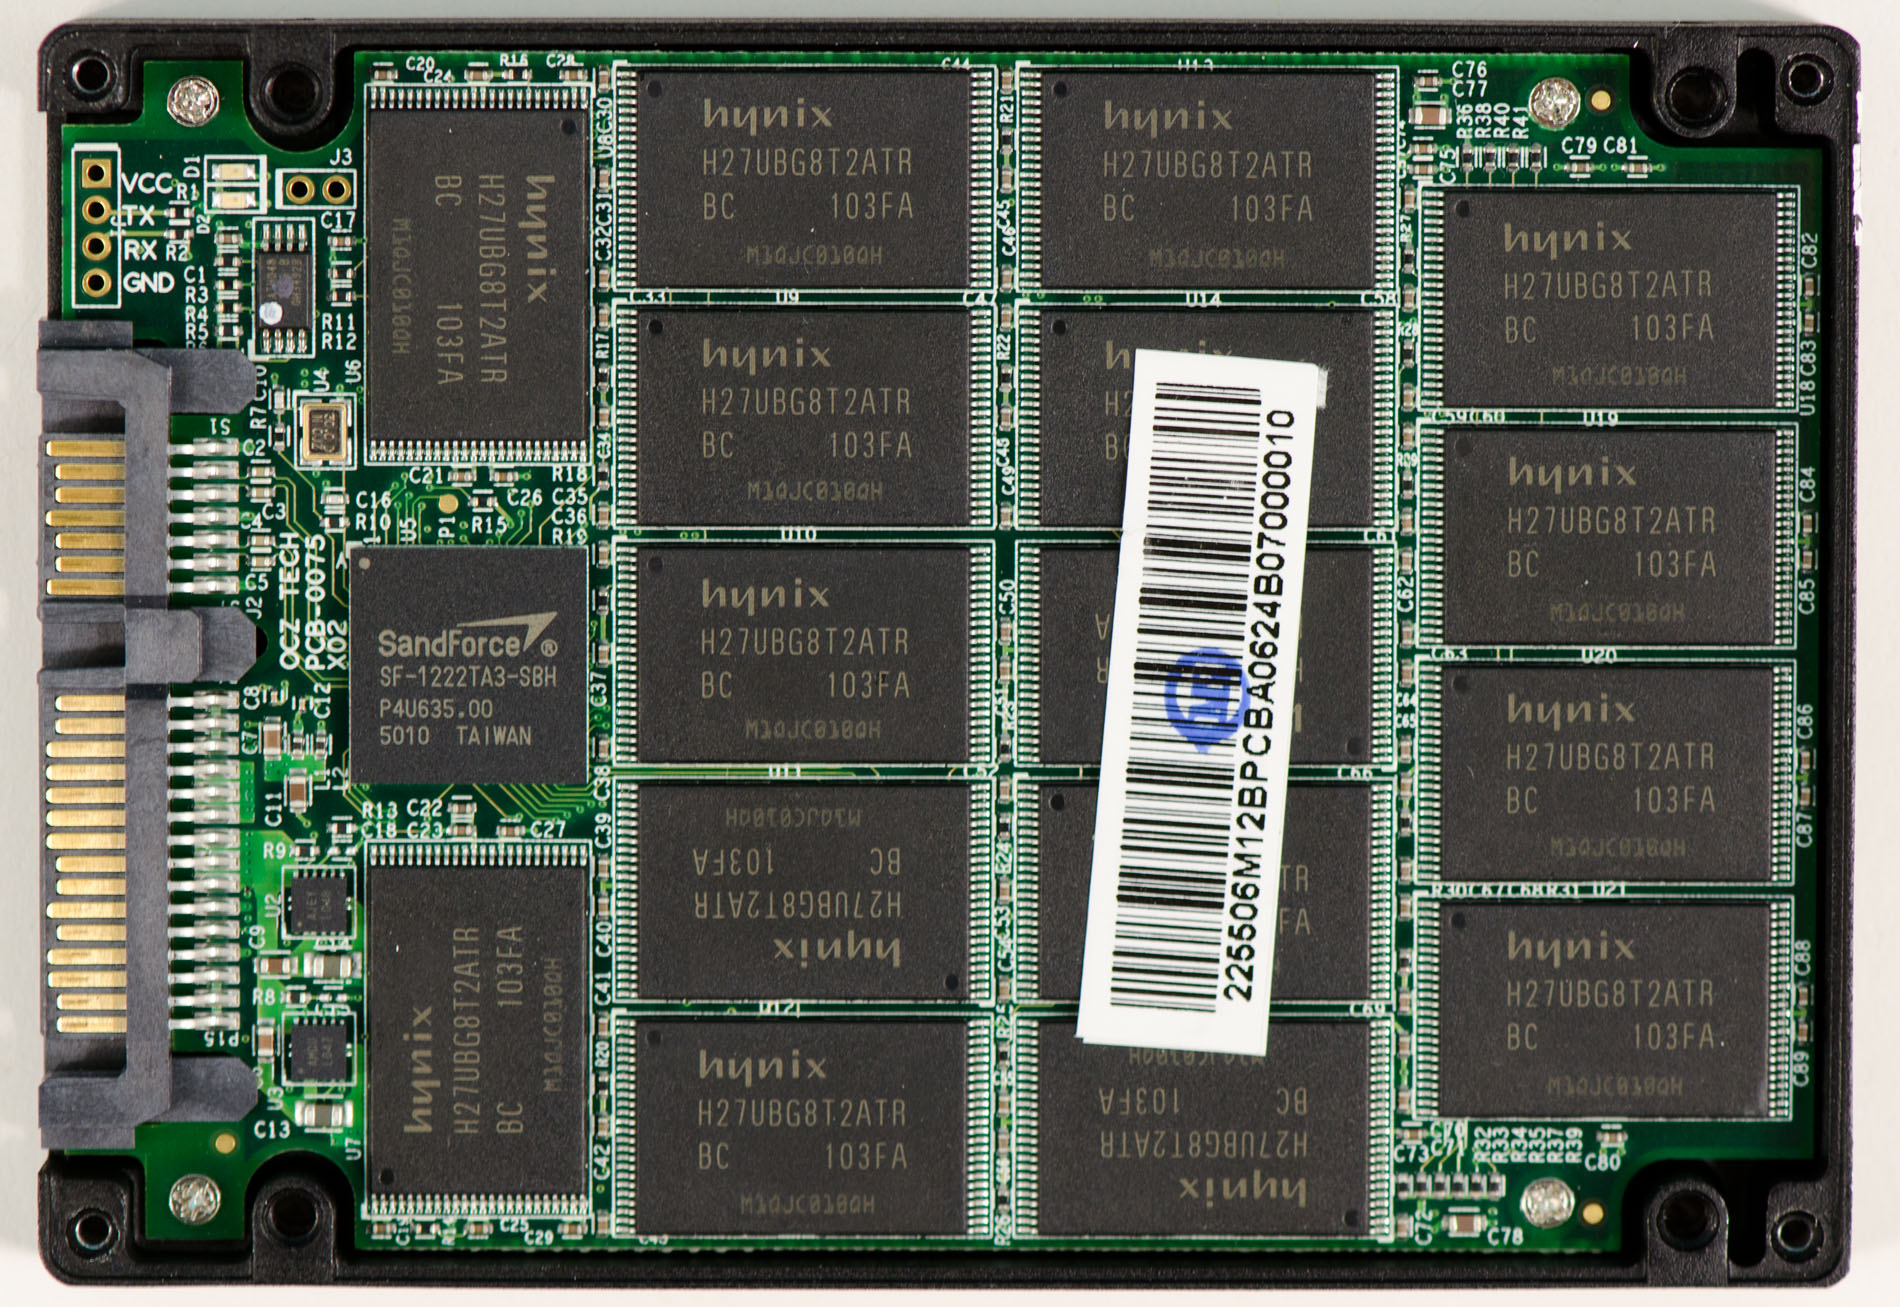
You'll see that there are a ton of NAND devices on the board. Thirty two to be exact. That's four per channel. Do the math and you'll see we've got 32 x 4GB 32nm MLC NAND die on the PCB. This drive has the same number of NAND die per package as the new 25nm 120GB Vertex 2 so in theory performance should be the same. It isn't however:
| Vertex 2 NAND Performance Comparison | ||||
| AT Storage Bench Heavy 2011 | AT Storage Bench Light 2011 | |||
| 34nm IMFT | 120.1 MB/s | 155.9 MB/s | ||
| 25nm IMFT | 110.9 MB/s | 145.8 MB/s | ||
| 32nm Hynix | 92.1 MB/s | 125.6 MB/s | ||
Performance is measurably worse. You'll notice that I also threw in some 34nm IMFT numbers to show just how far performance has fallen since the old launch NAND.
Why not just keep using 34nm IMFT NAND? Ultimately that product won't be available. It's like asking for 90nm CPUs today, the whole point to Moore's Law is to transition to smaller manufacturing processes as quickly as possible.
Why is the Hynix 32nm NAND so much slower? That part is a little less clear to me. For starters we're only dealing with one die per package, we've established can have a negative performance impact. On top of that, SandForce's firmware may only be optimized for a couple of NAND devices. OCZ admitted that around 90% of all Vertex 2 shipments use Intel or Micron NAND and as a result SandForce's firmware optimization focus is likely targeted at those NAND types first and foremost. There are differences in NAND interfaces as well as signaling speeds which could contribute to performance differences unless a controller takes these things into account.

25nm Micron NAND
The 25nm NAND is slower than the 34nm offerings for a number of reasons. For starters page size increased from 4KB to 8KB with the transition to 25nm. Intel used this transition as a way to extract more performance out of the SSD 320, however that may have actually impeded SF-1200 performance as the firmware architecture wasn't designed around 8KB page sizes. I suspect SandForce just focused on compatibility here and not performance.
Secondly, 25nm NAND is physically slower than 34nm NAND:
| NAND Performance Comparison | ||||
| Intel 34nm NAND | Intel 25nm NAND | |||
| Read | 50 µs | 50 µs | ||
| Program | 900 µs | 1200 µs | ||
| Block Erase | 2 µs | 3 µs | ||
Program and erase latency are both higher, although admittedly you're working with much larger page sizes (it's unclear whether Intel's 1200 µs figure is for a full page program or a partial program).
The bad news is that eventually all of the 34nm IMFT drives will dry up. The worse news is that the 25nm IMFT drives, even with the same number of NAND devices on board, are lower in performance. And the worst news is that the drives that use 32nm Hynix NAND are the slowest of them all.
I have to mention here that this issue isn't exclusive to OCZ. All other SF drive manufacturers are faced with the same potential problem as they too must shop around for NAND and can't guarantee that they will always ship the same NAND in every single drive.
The Problem With Ratings
You'll notice that although the three NAND types I've tested perform differently in our Heavy 2011 workload, a quick run through Iometer reveals that they perform identically:
| Vertex 2 NAND Performance Comparison | ||||
| AT Storage Bench Heavy 2011 | Iometer 128KB Sequential Write | |||
| 34nm IMFT | 120.1 MB/s | 214.8 MB/s | ||
| 25nm IMFT | 110.9 MB/s | 221.8 MB/s | ||
| 32nm Hynix | 92.1 MB/s | 221.3 MB/s | ||
SandForce's architecture works by reducing the amount of data that actually has to be written to the NAND. When writing highly compressible data, not all NAND devices are active and we're not bound by the performance of the NAND itself since most of it is actually idle. SandForce is able to hide even significant performance differences between NAND implementations. This is likely why SandForce is more focused on NAND compatibility than performance across devices from all vendors.
Let's see what happens if we write incompressible data to these three drives however:
| Vertex 2 NAND Performance Comparison | ||||
| Iometer 128KB Sequential Write (Incompressible Data) | Iometer 128KB Sequential Write | |||
| 34nm IMFT | 136.6 MB/s | 214.8 MB/s | ||
| 25nm IMFT | 118.5 MB/s | 221.8 MB/s | ||
| 32nm Hynix | 95.8 MB/s | 221.3 MB/s | ||
It's only when you force SandForce's controller to write as much data in parallel as possible that you see the performance differences between NAND vendors. As a result, the label on the back of your Vertex 2 box isn't lying - whether you have 34nm IMFT, 25nm IMFT or 32nm Hynix the drive will actually hit the same peak performance numbers. The problem is that the metrics depicted on the spec sheets aren't adequate to be considered fully honest.
A quick survey of all SF-1200 based drives shows the same problem. Everyone rates according to maximum performance specifications and no one provides any hint of what you're actually getting inside the drive.
| SF-1200 Drive Rating Comparison | ||||
| 120GB Drive | Rated Sequential Read Speed | Rated Sequential Write Speed | ||
| Corsair Force F120 | 285 MB/s | 275 MB/s | ||
| G.Skill Phoenix Pro | 285 MB/s | 275 MB/s | ||
| OCZ Vertex 2 | Up to 280 MB/s | Up to 270 MB/s | ||
I should stop right here and mention that specs are rarely all that honest on the back of any box. Whether we're talking about battery life or SSD performance, if specs told the complete truth then I'd probably be out of a job. If one manufacturer is totally honest, its competitors will just capitalize on the aforementioned honesty by advertising better looking specs. And thus all companies are forced to bend the truth because if they don't, someone else will.


153 Comments
View All Comments
kmmatney - Thursday, April 7, 2011 - link
The answer is pretty easy, I think. Anand's own storage bench is a great test of real world performance, especially the "typical workload"http://www.anandtech.com/show/4256/the-ocz-vertex-...
The bottom line: Version 3 is better than Verion 2, although not by an amazing amount
sunbear - Thursday, April 7, 2011 - link
"3) Finally, are you willing to commit, publicly and within a reasonable period of time, to exchanging any already purchased product for a different configuration should our readers be unhappy with what they've got?"The problem is that it is not straight forward for a customer to know "what they've got" without opening up the SSD and voiding their warranty. OCZ provides the "OCZ Toolbox" that tells you whether your SSD contains 32Gb or 64Gb NAND chips but they don't currently provide any too; to determine whether you have the dreaded Hynix flash or the superior IMFT flash.
I asked in the OCZ forum and their response was to do a secure erase and run the AS SSD benchmark. I have no idea what numbers from the AS SSD benchmark would indicate Hynix versus IMFT.
cptcolo - Friday, April 8, 2011 - link
Hats off to both Anand and OCZ for fixing the Vertex 2 issue. I am really impressed by both Anand and Alex Mei. Anand thanks fo rbeing proactive and presenting OCZ with the problem, and thanks to Alex Mei and Ryan for taking care of the problem 100% (via the change in name and SKUs). You are both true alturists.B0GiE - Friday, April 8, 2011 - link
I just cancelled my order of the 120Gb OCZ Vertex. It says on Scan webpage that it is 550mbs Read and 500mbs Write.Due to this review i'm not sure i believe it. I will wait for further reviews before I purchase a new SSD.
I am interested in game load times for the Vertex 3 such as Black Ops but Anandtech does not show any???
gietrzy - Friday, April 8, 2011 - link
I've just cancelled 120GB Vertex 3 drive. I have no time to investigate whether or not my drive performs as promised.I also have a Vertex 2 60 GB I think "E" version - how do I check if it's faulty.
My scenario is #2 at this page http://www.anandtech.com/show/4256/the-ocz-vertex-...
I also have lots of 1080p avchd videos and even more raw files from my camera so I think I will wait for Intel 510 120 GB review and buy Intel.
One thing's for sure: I will never buy OCZ again.
Thanks Anand, thanks guys!
mattcpa - Friday, April 8, 2011 - link
I ordered the 120GB Vertex 3 from Computers4Sure on the morning before you published this review... :(I also picked up an HDD Optical Bay to put my MBPro 750GB HDD there and plan to put the 120GB in the 6gbps SATA.
I use the Macbook Pro 15" 2.2 SBP for laptop DJ work along with handbraking movies and such; sprinkle in some random gaming.
Hopefully for these processes, it appears this drive will still be near the top of the pack in terms of performance, as I feel I perform many read functions daily rather than performing constant writes. If someone has an opinion, let me know if I am wrong...
Affectionate-Bed-980 - Friday, April 8, 2011 - link
Come on. You HAVE to compare against last generation's Vertex 2. It's selling for $169 at Newegg, and you don't even bench against that. Sigh. Like it's fine if you miss out on some of the other ways say the Kingston, but to skip on the Vertex 2 is a major /facepalm.Shark321 - Friday, April 8, 2011 - link
Yes, Vertex 2 and Agility 2 benchmarks compared to Vertex 3 would be really helpful here.db808 - Friday, April 8, 2011 - link
Hi Anand,First, let me join in with the others in complementing you on your excellent article.
I saw some interesting data hidden in the information describing the IO access patterns of your new IO benchmarks. I was very surprised that the IO size was so small, and that you mentioned that a majority of the IO was sequential.
Some of this can be explained by the multi-threaded nature of the tests. Two applications, each doing sequential IO, running against each other, result in interleaved IOs going to the disk, with a result that is very non-sequential. Some of this may be explained by the application runtime actually requesting 4kb IO, and Windows not having time to do "read aheads".
Windows does have the capability to do larger-IO than was requested by the application (opportunistic IOs), as well as read-ahead and write behinds(that are often coalesced into larger IOs) ... but SSDs may actually be so fast, that the Windows IO optimization algorithms don't have enough time to "think".
You also pointed out that SSD IO performance increases very quickly has the IO size increases above 4kb. It appears that most of the modern controllers parallel stripe the IO across multiple channels, wear-leveling notwithstanding. So an 8kb IO is 2 parallel 4kb IO, for example (ignoring SandForce compression behavior).
The simplest way to cajole the large share of 4kb IO's to 8kb or larger sizes is to simply increase the NTFS cluster size. This has been a performance optimization techniques used with high performance storage arrays for many years. Many Unix systems actually default to 8kb or larger block sizes, and EMC internally uses a 32kb block size as examples.
There is a small negative tradeoff ... some additional slack space at the end of every file. The average slack space per file is 1/2 the cluster size, or 2kb for the default 4kb cluster. Increasing the cluster to 8kb, increases the slack space to 4kb per file ... for a 64kb cluster, it would be 32kb slack per file. The JAM Software "Treesize" utility will actually compute the total slack space for you. With TreeSize Pro, you can even do "what if" analysis and see the impact of changing the cluster size on total slack space.
In summary, slack space overhead only represent a few percentage points of the disk capacity. For example, on my business laptop, by C: drive has about 262K files, and my total wasted space is ~ 644 MB. Increasing the cluster size to 8kb would roughly double my wasted space ... an additional 644MB. Not much.
On my hard-disk based systems that are also memory rich, I regularly run NTFS cluster sizes of 8kb and 16kb ... 64kb for temp file systems. I am pro-actively trading a few percentage points of disk space for higher performance levels. The cost of a few GB of extra overhead on a 1TB disk is a no brainer.
But SSDs are a lot more expensive, and space is a lot tighter. I use a SSD as a boot disk on one PC, and I've filled it about 1/2 full, with the OS, applications, page, hibernate, and temps. Performance is great, and the 40%-ish free space is a form of over-provisioning.
My performance was so good, I had not yet experimented with increasing my cluster size, because I was not able to quantify what the IO size profile looked like. Your IO size statistics from your IO storage benchmark was very enlightening as it shows the (unexpected) large amount of small IO.
On Sandforce-based SSDs, the controller would compress away all the slack space at the end a file, since Windows pads the last cluster in a file with zeros. So with a larger cluster size, your file system would look fuller under Windows, but all the extra slack space would be compressed on the SSD ... with little detriment to the over-provisioning headroom.
I know you are exceedingly busy, but it would be extremely interesting to be able to re-run your controlled test environment with the Anand IO Storage 2011 tests on systems that were built with different cluster sizes. I suspect that using a larger cluster size would improve performance on all SSDs, with SSDs with weaker performance showing the most relative gain. From what I have read, increasing the cluster size beyond 16kb (for Sandforce controllers) will have diminishing (but still positive) returns.
Increasing a Windows 7 boot disk's cluster size from 4kb to 16 kb would increase the wasted space about 4-fold. On my system that would be less than 3GB. It could be a worthwhile trade for performance.
Another reason to explore larger cluster sizes is the fact that the new 28nm Flash chips typically have page sizes of 8kb, not the smaller 4kb used in the 32/34 nm Flash chips. When Windows does 4kb IO on these new 28nm Flash SSDs, it is actually doing sub-page IO, causing the controller to perform a read/modify/write function, and increasing the write amplification effect. The impact would be similar to doing 2kb IO on the SSDs with 4kb page sizes.
If you assume that the typical compression factor is 2:1 for Sandforce controllers, a 16kb NTFS cluster would often be compressed to fit in a single 8kb page ... sounds like a sweet spot.
Using a larger cluster size, also decrease the amount of work needed to append to a file, as fewer clusters need to be allocated. The cluster size also defines the lower limit of contiguousness. This could be important on SSDs, since we normally don't run defrag utilities on SSDs, so we know that fragmentation will only get worse over time.
I will point out that using larger cluster sizes may increase memory usage for the kernel buffer pool, and/or reduce the effective number of buffers for a buffer pool of a given size. I only recommend increasing cluster sizes on systems in a "memory rich" environment.
Again, thank you for your excellent report. Exploring the impact of larger cluster sizes, especially on 28nm based SSDs could add an additional dimension to your analysis. 8kb and larger cluster sizes could further improve real-world SSD performance, and mask some of the performance drop from using the 28nm chips.
db
mpx999 - Sunday, April 10, 2011 - link
That's a big limitation for number of total I/Os. Eg. in 300MB/s SATA-II you'd be limited to ~37.5k IOPS with 8kB transfers, less than some SSDs are capable of, while the limit with 4kB clusters is 2 times higher, which is still beyond current SSDs for random transfers.4kB clusters are a perfect match for x86 processors that use hardware 4kB page size, as each page size is one block on disk. This is especially important for pagefile reads, which tend to be random by nature, rather than pagefile writes that are mostly sequential dumps of memory content. Some Unix systems may use 8kB disc block sizes because it's a default page size for SPARC and Itanium processors. For Power and ARM 4kB is the default but also 64kB can be used. So I'd advice against using large (larger than hw. page size) block sizes on a system/boot partition.
8kB disk block sizes can be useful on partitions dedicated for SQL Server as default database blocks are 8kB for SQL Server, so it's doing 8kB transfers anyway. Oracle supports multiple page sizes and their advice is:
http://www.dba-oracle.com/t_multiple_blocksizes_su...
"Oracle recommends smaller Oracle Database block sizes (2 KB or 4 KB) for online transaction processing (OLTP) or mixed workload environments and larger block sizes (8 KB, 16 KB, or 32 KB) for decision support system (DSS) workload environments."
32kB cluster sizes are a default value on flash cards for digital cameras, as sequential writes of large prictures are done on them.
BTW. The slow speed of both Hynix and Intel 25nm versions of Vertex 2 may be because it's aging controller cannot deal with 8kB flash pages.