The OCZ Vertex 3 Review (120GB)
by Anand Lal Shimpi on April 6, 2011 6:32 PM ESTAnandTech Storage Bench 2011
I didn't expect to have to debut this so soon, but I've been working on updated benchmarks for 2011. Last year we introduced our AnandTech Storage Bench, a suite of benchmarks that took traces of real OS/application usage and played them back in a repeatable manner. I assembled the traces myself out of frustration with the majority of what we have today in terms of SSD benchmarks.
Although the AnandTech Storage Bench tests did a good job of characterizing SSD performance, they weren't stressful enough. All of the tests performed less than 10GB of reads/writes and typically involved only 4GB of writes specifically. That's not even enough exceed the spare area on most SSDs. Most canned SSD benchmarks don't even come close to writing a single gigabyte of data, but that doesn't mean that simply writing 4GB is acceptable.
Originally I kept the benchmarks short enough that they wouldn't be a burden to run (~30 minutes) but long enough that they were representative of what a power user might do with their system.
Not too long ago I tweeted that I had created what I referred to as the Mother of All SSD Benchmarks (MOASB). Rather than only writing 4GB of data to the drive, this benchmark writes 106.32GB. It's the load you'd put on a drive after nearly two weeks of constant usage. And it takes a *long* time to run.
I'll be sharing the full details of the benchmark in some upcoming SSD articles but here are some details:
1) The MOASB, officially called AnandTech Storage Bench 2011 - Heavy Workload, mainly focuses on the times when your I/O activity is the highest. There is a lot of downloading and application installing that happens during the course of this test. My thinking was that it's during application installs, file copies, downloading and multitasking with all of this that you can really notice performance differences between drives.
2) I tried to cover as many bases as possible with the software I incorporated into this test. There's a lot of photo editing in Photoshop, HTML editing in Dreamweaver, web browsing, game playing/level loading (Starcraft II & WoW are both a part of the test) as well as general use stuff (application installing, virus scanning). I included a large amount of email downloading, document creation and editing as well. To top it all off I even use Visual Studio 2008 to build Chromium during the test.
Update: As promised, some more details about our Heavy Workload for 2011.
The test has 2,168,893 read operations and 1,783,447 write operations. The IO breakdown is as follows:
| AnandTech Storage Bench 2011 - Heavy Workload IO Breakdown | ||||
| IO Size | % of Total | |||
| 4KB | 28% | |||
| 16KB | 10% | |||
| 32KB | 10% | |||
| 64KB | 4% | |||
Only 42% of all operations are sequential, the rest range from pseudo to fully random (with most falling in the pseudo-random category). Average queue depth is 4.625 IOs, with 59% of operations taking place in an IO queue of 1.
Many of you have asked for a better way to really characterize performance. Simply looking at IOPS doesn't really say much. As a result I'm going to be presenting Storage Bench 2011 data in a slightly different way. We'll have performance represented as Average MB/s, with higher numbers being better. At the same time I'll be reporting how long the SSD was busy while running this test. These disk busy graphs will show you exactly how much time was shaved off by using a faster drive vs. a slower one during the course of this test. Finally, I will also break out performance into reads, writes and combined. The reason I do this is to help balance out the fact that this test is unusually write intensive, which can often hide the benefits of a drive with good read performance.
There's also a new light workload for 2011. This is a far more reasonable, typical every day use case benchmark. Lots of web browsing, photo editing (but with a greater focus on photo consumption), video playback as well as some application installs and gaming. This test isn't nearly as write intensive as the MOASB but it's still multiple times more write intensive than what we were running last year.
As always I don't believe that these two benchmarks alone are enough to characterize the performance of a drive, but hopefully along with the rest of our tests they will help provide a better idea.
The testbed for Storage Bench 2011 has changed as well. We're now using a Sandy Bridge platform with full 6Gbps support for these tests. All of the older tests are still run on our X58 platform.
AnandTech Storage Bench 2011 - Heavy Workload
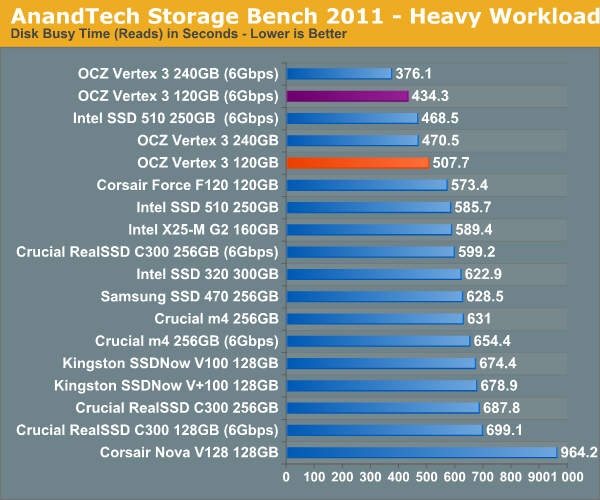
We'll start out by looking at average data rate throughout our new heavy workload test:
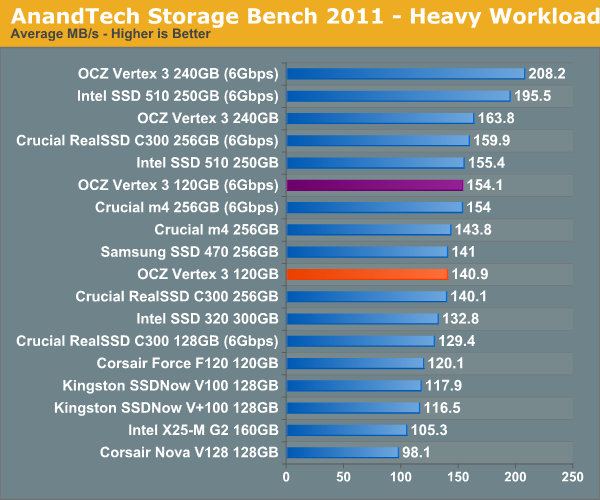
In our heavy test for 2011 the 120GB Vertex 3 is noticeably slower than the 240GB sample we tested a couple of months ago. Fewer available die are the primary explanation. We're still waiting on samples of the 120GB Intel SSD 320 and the Crucial m4 but it's looking like this round will be more competitive than we originally thought.
The breakdown of reads vs. writes tells us more of what's going on:
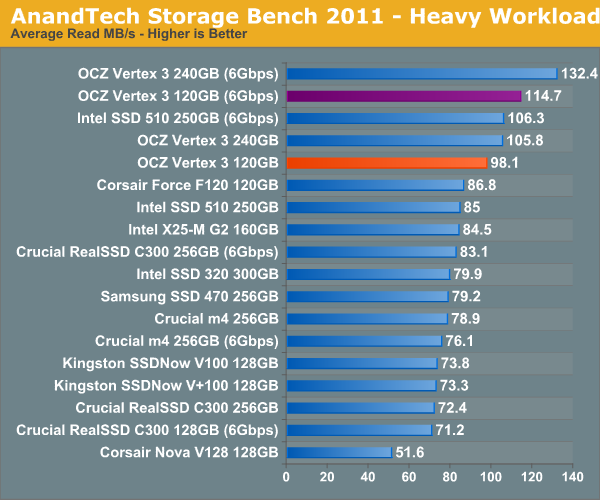
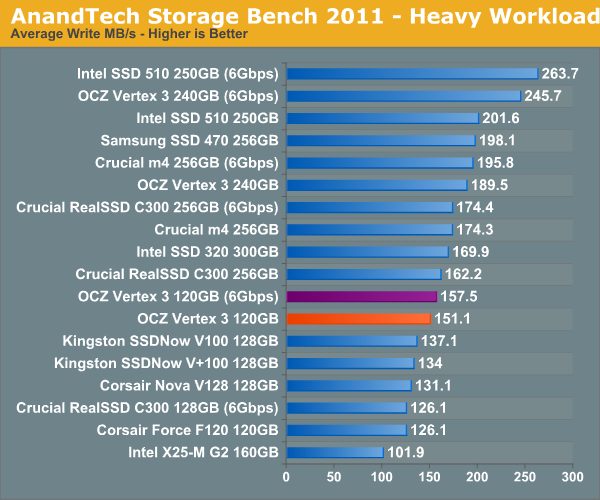
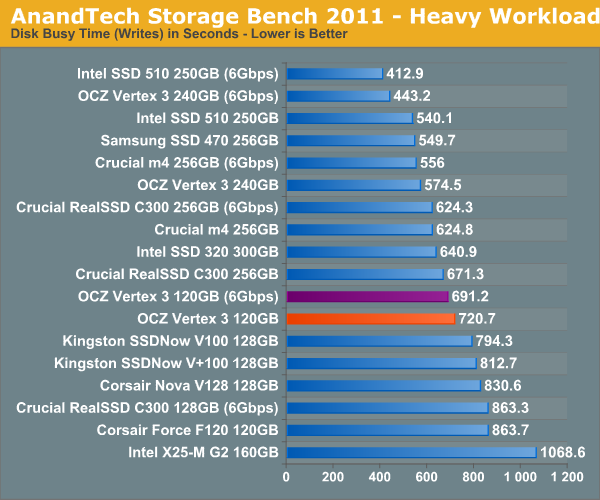
Surprisingly enough it's not read speed that holds the 120GB Vertex 3 back, it's ultimately the lower (incompressible) write speed:
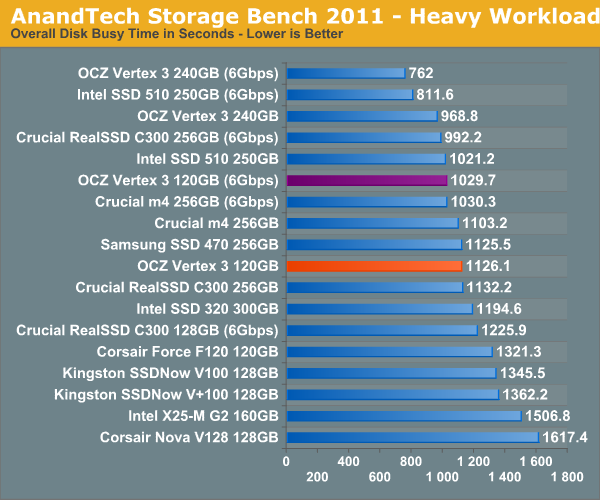
The next three charts just represent the same data, but in a different manner. Instead of looking at average data rate, we're looking at how long the disk was busy for during this entire test. Note that disk busy time excludes any and all idles, this is just how long the SSD was busy doing something:


153 Comments
View All Comments
casteve - Thursday, April 7, 2011 - link
Great review! Thanks for carrying the 120GB torch :)I'd love to see a couple of HDDs added to the 2011 bench (like they are in the 2010 bench) to keep the perspective in play.* Most people are still moving from an HDD to an SSD and not just upgrading their SSD's.
* stuff a 120GB SSD in yer laptop for $200 to replace a 5400rpm HDD and improve gaming IOPS by 5x is more impressive than replacing an existing 120GB SSD with a newer one for $250 and improve gaming IOPS by 10%. Extreme example...but you get the idea.
Gasaraki88 - Thursday, April 7, 2011 - link
I want to thank you for writing this article and keeping the companies honest. Without smart people like you, companies will overstate performance and to the common person it will look fine because we don't have the proper tools to test.I'll been reading Anandtech for 11 years now. The quality is still top notch unlike some other sites I used to go to.
cknobman - Thursday, April 7, 2011 - link
Dont buy OCZ products.Anand and countless consumer reviews from Newegg have proved that OCZ does not put out a consistent and reliable level of product.
Im not one for rolling the crap dice with my hundreds of hard earned dollars.
hackztor - Thursday, April 7, 2011 - link
LOL, okay go spend your hard earned money on last year performance intel new drives.seapeople - Thursday, April 7, 2011 - link
Wow you got him there! Yeah, why doesn't he just buy an Intel drive. That would be funny because then he would have to wait 5.6 seconds to open Photoshop instead of 5.2 seconds. Or it would take a full 33 seconds to reboot instead of 35 seconds. I bet he's so unintelligent that he would actually accept crappy last-generation solid state drive performance like that at a lower price.semo - Friday, April 8, 2011 - link
Corsair, patriot and many other SSD makers use SF controllers. You just have to be sure you know what firmware you're getting. You have to be much more careful with OCZ as you can't trust them to sell you what they claim on the box.Stargrazer - Thursday, April 7, 2011 - link
It's awesome that you're reviewing the 120GB version first. It's the version that I believe most people would be most interested in getting, so it's great that we'll be able to see how it performs, rather than only seeing the higher numbers of a ~256GB version that's so expensive that most people would never get it. It's fantastic even. Did I mention that it's awesome?Unfortunately, since the ~128GB versions haven't always been reviewed in the past, this also means that we don't really have much to compare the numbers to. How do we know if the 120GB Vertex 3 is competitive if we don't know the performance of its competitors?
I can understand if it might take a while to get the numbers for comparable versions of the 510, 310 and m4 (though I really hope that in the future you continue to press on for getting ~128GB versions in time for the initial reviews), but would it at least be possible to get the complete numbers for the 128GB version of the RealSSD C300? For some reason it doesn't seem to be in the IOmeter tests.
Oh. Isn't it time that you stopped using "I didn't expect to have to debut this so soon" in the introduction to the 2011 Storage Bench? :)
KenPC - Thursday, April 7, 2011 - link
A humorous thought of little relevance. but.. if OCZ rebrands the Vertex 2 as the 2b to solidify performance specs. then as I shop I will be thinking....Is this OCZ drive a 2b or not 2b, that is the question.....
Omid.M - Thursday, April 7, 2011 - link
They saw Anand's Vibrams and knew he meant business (casual).:)
sethm1 - Thursday, April 7, 2011 - link
I was looking forward to the Vertex 3 as being the next best thing.And so was hoping for a more positive review (but yes appreciate the candor in the review).
My question is, after all is said and done, is the Vertex 3 still better than the Vertex 2 (120GB versions)?
Should I go out and get a version 2?