OCZ Vertex 3 Pro Preview: The First SF-2500 SSD
by Anand Lal Shimpi on February 17, 2011 3:01 AM ESTAnandTech Storage Bench 2010
To keep things consistent we've also included our older Storage Bench. Note that the old storage test system doesn't have a SATA 6Gbps controller, so we only have one result for the Vertex 3 Pro (and the C300). The SF-2500 controller does respectably here, but with a 3Gbps controller we're only marginally faster than other SSDs (which is why we've moved to a new storage platform for 2011).
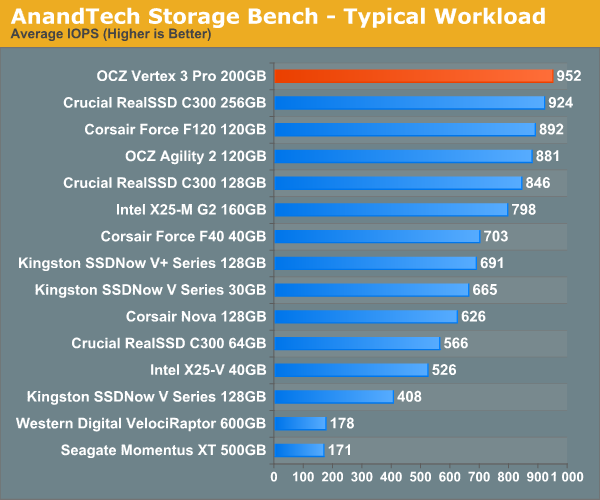
The first in our benchmark suite is a light/typical usage case. The Windows 7 system is loaded with Firefox, Office 2007 and Adobe Reader among other applications. With Firefox we browse web pages like Facebook, AnandTech, Digg and other sites. Outlook is also running and we use it to check emails, create and send a message with a PDF attachment. Adobe Reader is used to view some PDFs. Excel 2007 is used to create a spreadsheet, graphs and save the document. The same goes for Word 2007. We open and step through a presentation in PowerPoint 2007 received as an email attachment before saving it to the desktop. Finally we watch a bit of a Firefly episode in Windows Media Player 11.
There’s some level of multitasking going on here but it’s not unreasonable by any means. Generally the application tasks proceed linearly, with the exception of things like web browsing which may happen in between one of the other tasks.
The recording is played back on all of our drives here today. Remember that we’re isolating disk performance, all we’re doing is playing back every single disk access that happened in that ~5 minute period of usage. The light workload is composed of 37,501 reads and 20,268 writes. Over 30% of the IOs are 4KB, 11% are 16KB, 22% are 32KB and approximately 13% are 64KB in size. Less than 30% of the operations are absolutely sequential in nature. Average queue depth is 6.09 IOs.
The performance results are reported in average I/O Operations per Second (IOPS):
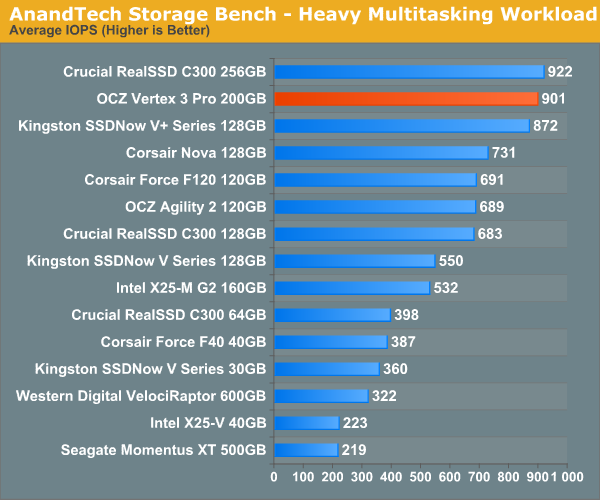
If there’s a light usage case there’s bound to be a heavy one. In this test we have Microsoft Security Essentials running in the background with real time virus scanning enabled. We also perform a quick scan in the middle of the test. Firefox, Outlook, Excel, Word and Powerpoint are all used the same as they were in the light test. We add Photoshop CS4 to the mix, opening a bunch of 12MP images, editing them, then saving them as highly compressed JPGs for web publishing. Windows 7’s picture viewer is used to view a bunch of pictures on the hard drive. We use 7-zip to create and extract .7z archives. Downloading is also prominently featured in our heavy test; we download large files from the Internet during portions of the benchmark, as well as use uTorrent to grab a couple of torrents. Some of the applications in use are installed during the benchmark, Windows updates are also installed. Towards the end of the test we launch World of Warcraft, play for a few minutes, then delete the folder. This test also takes into account all of the disk accesses that happen while the OS is booting.
The benchmark is 22 minutes long and it consists of 128,895 read operations and 72,411 write operations. Roughly 44% of all IOs were sequential. Approximately 30% of all accesses were 4KB in size, 12% were 16KB in size, 14% were 32KB and 20% were 64KB. Average queue depth was 3.59.
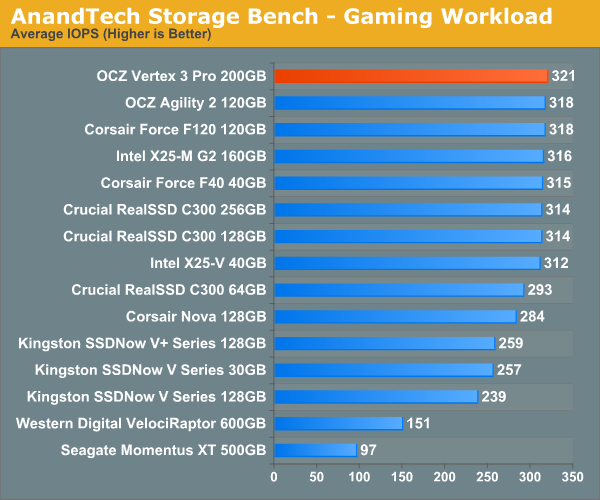
The gaming workload is made up of 75,206 read operations and only 4,592 write operations. Only 20% of the accesses are 4KB in size, nearly 40% are 64KB and 20% are 32KB. A whopping 69% of the IOs are sequential, meaning this is predominantly a sequential read benchmark. The average queue depth is 7.76 IOs.


144 Comments
View All Comments
eva2000 - Thursday, February 17, 2011 - link
Thanks for the review, curious why the 256GB Crucial RealSSD C300 only included in some benchmarks and not others ?Anand Lal Shimpi - Thursday, February 17, 2011 - link
That's simply a data entry issue, I'll get it fixed :)Take care,
Anand
therealnickdanger - Thursday, February 17, 2011 - link
Also, I'm curious as to why none of the REVO benchmarks are included? On the one hand, I understand how niche PCIe drives may be, but on the other, they can offer significant performance over both SATA 3Gbps and 6Gbps drives. It would be nice to see the new Heavy and Light benchmarks applied to those as well.ludikraut - Thursday, February 17, 2011 - link
+1 on including REVO drive results in the drive comparisons.markjx1 - Thursday, February 17, 2011 - link
because REVO drives are garbage. they're nothing more than a bunch of vertex2's slapped onto a board with a cheap Silicone Image controller that has a PCI-X to PCIe bridge. Resale value on REVO is crap and if one of the drives dies, you have a nice paperweight.bji - Thursday, February 17, 2011 - link
Your own personal opinion on the drives are not a reason to disclude them from the review.therealnickdanger - Thursday, February 17, 2011 - link
Garbage that can pull down 800MB/s...? Go away, troll. For users without SATA 6Gbps, it's a very practical solution to achieve huge speed. In fact, even people WITH SATA 6Gbps would get a boost. The cost/GB is even under $2 for some of the REVOs, making them a reasonable alternative.Anand Lal Shimpi - Thursday, February 17, 2011 - link
All graphs should now have the 256GB C300 in them :)Breogan - Thursday, February 17, 2011 - link
Is the data in the Incompressible Write Speed Test mixed for the SF2500 drive or does it perform actually worse after trim?. It seems weird to me that a dirty drive performs as if it was stock and the trim actually worsens its perfomance.Anand Lal Shimpi - Thursday, February 17, 2011 - link
It's not TRIM that is making the drive slower, it's the next write pass that's actually pushing the drive into a lower performance state as there's more garbage collection/cleaning that's going on. If I hadn't TRIMed and just ran another pass of the AS-SSD test you'd see the same number.Take care,
Anand