OCZ Vertex 3 Pro Preview: The First SF-2500 SSD
by Anand Lal Shimpi on February 17, 2011 3:01 AM ESTAnandTech Storage Bench 2011: Much Heavier
I didn't expect to have to debut this so soon, but I've been working on updated benchmarks for 2011. Last year we introduced our AnandTech Storage Bench, a suite of benchmarks that took traces of real OS/application usage and played them back in a repeatable manner. I assembled the traces myself out of frustration with the majority of what we have today in terms of SSD benchmarks.
Although the AnandTech Storage Bench tests did a good job of characterizing SSD performance, they weren't stressful enough. All of the tests performed less than 10GB of reads/writes and typically involved only 4GB of writes specifically. That's not even enough exceed the spare area on most SSDs. Most canned SSD benchmarks don't even come close to writing a single gigabyte of data, but that doesn't mean that simply writing 4GB is acceptable.
Originally I kept the benchmarks short enough that they wouldn't be a burden to run (~30 minutes) but long enough that they were representative of what a power user might do with their system.
Not too long ago I tweeted that I had created what I referred to as the Mother of All SSD Benchmarks (MOASB). Rather than only writing 4GB of data to the drive, this benchmark writes 106.32GB. It's the load you'd put on a drive after nearly two weeks of constant usage. And it takes a *long* time to run.
I'll be sharing the full details of the benchmark in some upcoming SSD articles (again, I wasn't expecting to have to introduce this today so I'm a bit ill prepared) but here are some details:
1) The MOASB, officially called AnandTech Storage Bench 2011 - Heavy Workload, mainly focuses on the times when your I/O activity is the highest. There is a lot of downloading and application installing that happens during the course of this test. My thinking was that it's during application installs, file copies, downloading and multitasking with all of this that you can really notice performance differences between drives.
2) I tried to cover as many bases as possible with the software I incorporated into this test. There's a lot of photo editing in Photoshop, HTML editing in Dreamweaver, web browsing, game playing/level loading (Starcraft II & WoW are both a part of the test) as well as general use stuff (application installing, virus scanning). I included a large amount of email downloading, document creation and editing as well. To top it all off I even use Visual Studio 2008 to build Chromium during the test.
Many of you have asked for a better way to really characterize performance. Simply looking at IOPS doesn't really say much. As a result I'm going to be presenting Storage Bench 2011 data in a slightly different way. We'll have performance represented as Average MB/s, with higher numbers being better. At the same time I'll be reporting how long the SSD was busy while running this test. These disk busy graphs will show you exactly how much time was shaved off by using a faster drive vs. a slower one during the course of this test. Finally, I will also break out performance into reads, writes and combined. The reason I do this is to help balance out the fact that this test is unusually write intensive, which can often hide the benefits of a drive with good read performance.
There's also a new light workload for 2011. This is a far more reasonable, typical every day use case benchmark. Lots of web browsing, photo editing (but with a greater focus on photo consumption), video playback as well as some application installs and gaming. This test isn't nearly as write intensive as the MOASB but it's still multiple times more write intensive than what we were running last year.
As always I don't believe that these two benchmarks alone are enough to characterize the performance of a drive, but hopefully along with the rest of our tests they will help provide a better idea.
The testbed for Storage Bench 2011 has changed as well. We're now using a Sandy Bridge platform with full 6Gbps support for these tests. All of the older tests are still run on our X58 platform.
AnandTech Storage Bench 2011 - Heavy Workload
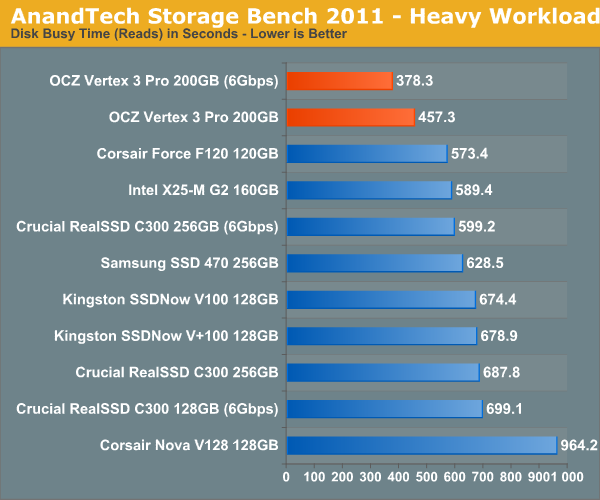
We'll start out by looking at average data rate throughout our new heavy workload test:
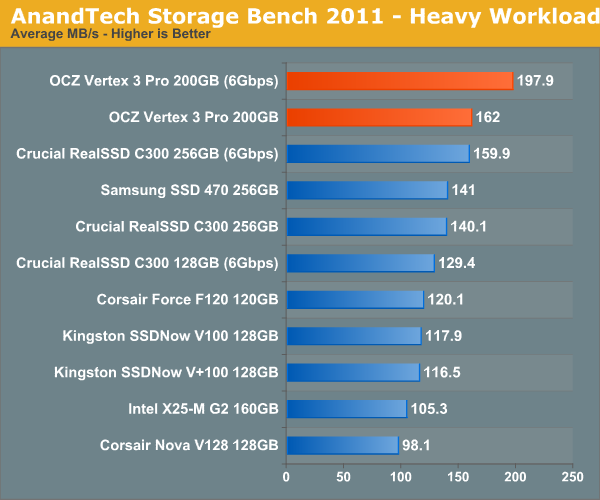
The Vertex 3 Pro on a 6Gbps interface is around 24% faster than Crucial's RealSSD C300. Note that the old SF-1200 (Corsair Force F120) can only deliver 60% of the speed of the new SF-2500. Over a 3Gbps interface the Vertex 3 Pro is quick, but only 15% faster than the next fastest 3Gbps drive. In order to get the most out of the SF-2500 you need a 6Gbps interface.
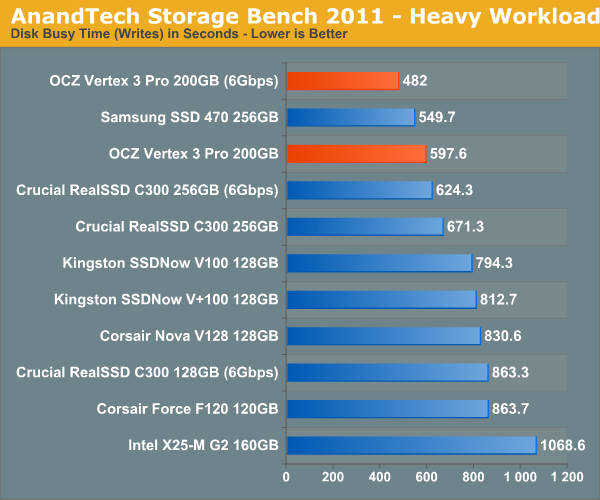
If we break out our performance results into average read and write speed we get a better idea for the Vertex 3 Pro's strengths:
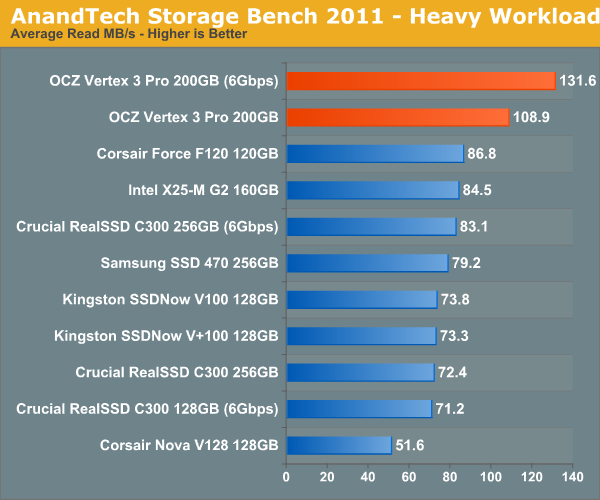
The SF-2500 is significantly faster than its predecessor and all other drives in terms of read performance. Good read speed is important as it influences application launch time as well as overall system responsiveness.
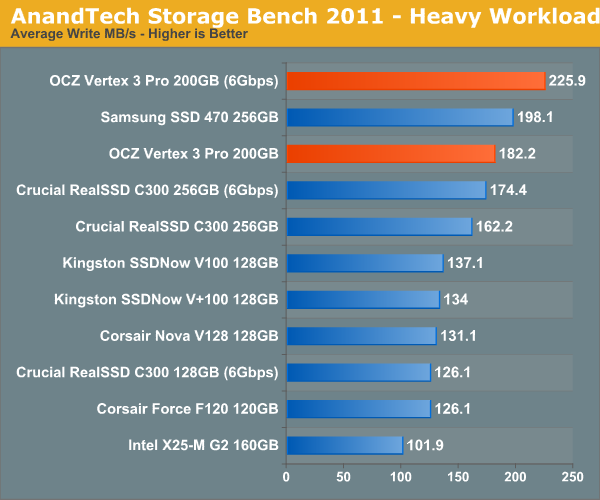
Average write speed is still class leading, but this benchmark uses a lot of incompressible data - you'll note that the Vertex 3 Pro only averages 225.9MB/s - barely over its worst case write speed. It's in this test that I'm expecting the new C400 to do better than SandForce.
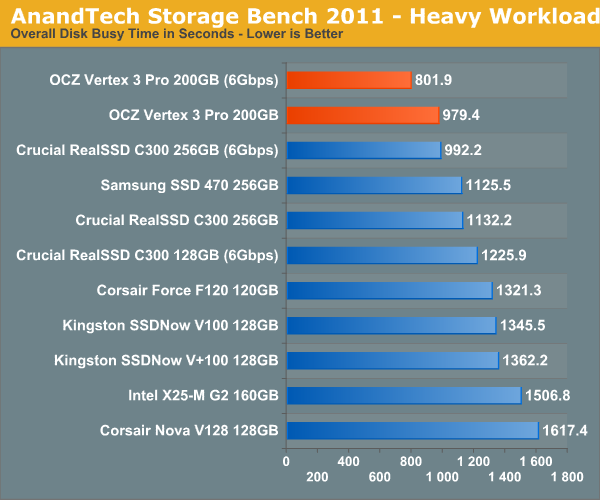
The next three charts just represent the same data, but in a different manner. Instead of looking at average data rate, we're looking at how long the disk was busy for during this entire test. Note that disk busy time excludes any and all idles, this is just how long the SSD was busy doing something:


144 Comments
View All Comments
bigboxes - Thursday, February 17, 2011 - link
Anand, I know you mentioned read/write and having your data a year after your last write. Does the future of SSD going to allow long-term storage on these devices? Will our data last longer than a year in storage or in use as read-only? I figured when cost went down and capacity went up that we'd start seeing SSD's truly replace HDD as the medium of long-term storage. Any insights into the (near) future?marraco - Thursday, February 17, 2011 - link
We need a roundup of SATA 6Gb controllers on AMD and Intel.How do added cards perform against integrated SATA 6Gb?
jwilliams4200 - Thursday, February 17, 2011 - link
Here are the numbers given in the AS-SSD incompressible write speed chart forSF-2500 (clean, dirty, after TRIM):
229.5 MB/s 230.0 MB/s 198.2 MB/s
Logically, I would expect the dirty number to be less than or equal to the after-TRIM number. Is there a typo here?
jwilliams4200 - Thursday, February 17, 2011 - link
Anand:Could you run the data files for your 2011 storage bench (heavy and light cases) through a couple of standard compression programs and report the compressed and uncompressed file sizes? That would be useful information to know when evaluating the performance of Sandforce SSDs on your storage benchmark.
Chloiber - Thursday, February 17, 2011 - link
Indeed, this would be an important piece of information.mstone29 - Thursday, February 17, 2011 - link
It's been out for a few weeks and the performance is on par w/ the OCZ V3.Does OCZ pay better?
Anand Lal Shimpi - Sunday, February 20, 2011 - link
We're still waiting for our Corsair P3 sample, as soon as we get it you'll see a review :)Take care,
Anand
gotFrosty - Thursday, February 17, 2011 - link
I personally will never buy from OCZ ever again... The way that they are treating the customers (including me) with this shady marketing scandal. Never will I deal with them. Never. Who is to say that they will not pull this crap somewhere down the line again.They changed the way they manufactured the drives. Ok thats well and fine, but at least change the product number/name whatever so that end users can distinguish between the products. Right now I'm sitting with a drive that they can't tell me whether its the slower 25nm or the 34. What kind of crap is that. I can't tell either because my build is waiting on the P67's to get fixed. Oh and to still market the drive as the same Vertex 2 that got all the great reviews.
Lets just say I'm a little irritated with the whole scheme. I feel robbed.
Mr Perfect - Friday, February 18, 2011 - link
Just stumbled across the whole Vertex 2 issue myself. Link to an explanation of what Frosty is mad about below:http://www.storagereview.com/ocz_issues_mea_culpa_...
I'm not impressed with OCZ right now. Anand, any way you could talk to OCZ about this issue?
db808 - Thursday, February 17, 2011 - link
Hi Anand,Thanks for another great SSD article. I own a OCZ Vertex 2 for my personal use, and I have been doing some testing of SSDs for work use.
I have a questions/comments that will probably stir up some additional discussion.
1) You present a good description on your personal workload write volume at 7GB / day, and how that even with that heavy amount of activity, the SSD life expectancy is much greater than the warranty period.
Did you ever try to correlate this with the life expectancy (or read and write activity) reported by the SSD using the SMART attributes?
In my first 3 weeks using a new Vertex 2 SSD as my boot disk, I averaged over 18 GB/day of write activity ... much greater than your reported 7 GB/day.
I can not say for other Sandforce implementations, but the OCZ Vertex 2 does report a wide variety of useful statistics via the vendor-specific SMART statistics. These statistics can be displayed using the OCZ Toolbox:
http://www.ocztechnologyforum.com/forum/showthread...
I don't know if other SSD vendors have similar information. Crystal Disk Info (http://crystalmark.info/software/CrystalDiskInfo/i... also displays and formats many of the vendor-specific fields, but I don't know if it specifically displays the extended info for specific SSDs.
Using the OCZ Toolbox (which works with all OCZ Sandforce SSDs), you can display a lot of interesting information. Here is the statistics for the first 3 weeks of usage from my SSD. No real benchmarking, just doing the initial install of Windows 7 64-bit, and then installing all the apps that I run. My 120 GB SSD is about half full, including a 8 gb page and 8 gb hiberbate file. I also relocated my Windows search index off the SSD. Temp IS on the SSD (my choice).
SMART READ DATA
Revision: 10
Attributes List
1: SSD Raw Read Error Rate Normalized Rate: 100 total ECC and RAISE errors
5: SSD Retired Block Count Reserve blocks remaining: 100%
9: SSD Power-On Hours Total hours power on: 351
12: SSD Power Cycle Count Count of power on/off cycles: 84
171: SSD Program Fail Count Total number of Flash program operation failures: 0
172: SSD Erase Fail Count Total number of Flash erase operation failures: 0
174: SSD Unexpected power loss count Total number of unexpected power loss: 19
177: SSD Wear Range Delta Delta between most-worn and least-worn Flash blocks: 0
181: SSD Program Fail Count Total number of Flash program operation failures: 0
182: SSD Erase Fail Count Total number of Flash erase operation failures: 0
187: SSD Reported Uncorrectable Errors Uncorrectable RAISE errors reported to the host for all data access: 0
194: SSD Temperature Monitoring Current: 1 High: 129 Low: 127
195: SSD ECC On-the-fly Count Normalized Rate: 100
196: SSD Reallocation Event Count Total number of reallocated Flash blocks: 0
231: SSD Life Left Approximate SDD life Remaining: 100%
241: SSD Lifetime writes from host Number of bytes written to SSD: 384 GB
242: SSD Lifetime reads from host Number of bytes read from SSD: 832 GB
For my first 3 weeks, using the PC primarily after work and on weekends, I averaged 18.2 GB/day of write activity ... or 384 GB total.
You may want to re-assess the classification of your 7 GB/day workload as "heavy". I don't think my 18.2 GB/day workload was extra heavy. My system has 8 GB of memory, and typically runs between 2-3 gb used, so I don't believe that there is a lot of activity to the page file. I have a hibernate file because I use a UPS, and it allows me to "resume" after a power blip vs. a full shutdown.
Well ... back to the point .... The OCZ toolbox reports an estimated remaining life expectancy. I have not run my SSD long enough to register a 1% usage yet, but I will be looking at what volume of total write activity finally triggers the disk to report only 99% remaining life.
I don't know if the OCZ Toolbox SMART reporting will work with non-OCZ Sandforce-based SSDs.
If you can get a life expectancy value from your Sandforce SSDs, it would be interesting to see how it correlates with your synthetic estimates.
Thanks again for a great article!