Kingston SSDNow V+100 Review
by Anand Lal Shimpi on November 11, 2010 3:05 AM EST- Posted in
- Storage
- SSDs
- Kingston
- SSDNow V+100
AnandTech Storage Bench
To avoid any potential optimizations for industry standard benchmarks and to provide another example of real world performance we've assembled our own storage benchmarks that we've creatively named the AnandTech Storage Bench.
The first in our benchmark suite is a light/typical usage case. The Windows 7 system is loaded with Firefox, Office 2007 and Adobe Reader among other applications. With Firefox we browse web pages like Facebook, AnandTech, Digg and other sites. Outlook is also running and we use it to check emails, create and send a message with a PDF attachment. Adobe Reader is used to view some PDFs. Excel 2007 is used to create a spreadsheet, graphs and save the document. The same goes for Word 2007. We open and step through a presentation in PowerPoint 2007 received as an email attachment before saving it to the desktop. Finally we watch a bit of a Firefly episode in Windows Media Player 11.
There’s some level of multitasking going on here but it’s not unreasonable by any means. Generally the application tasks proceed linearly, with the exception of things like web browsing which may happen in between one of the other tasks.
The recording is played back on all of our drives here today. Remember that we’re isolating disk performance, all we’re doing is playing back every single disk access that happened in that ~5 minute period of usage. The light workload is composed of 37,501 reads and 20,268 writes. Over 30% of the IOs are 4KB, 11% are 16KB, 22% are 32KB and approximately 13% are 64KB in size. Less than 30% of the operations are absolutely sequential in nature. Average queue depth is 6.09 IOs.
The performance results are reported in average I/O Operations per Second (IOPS):
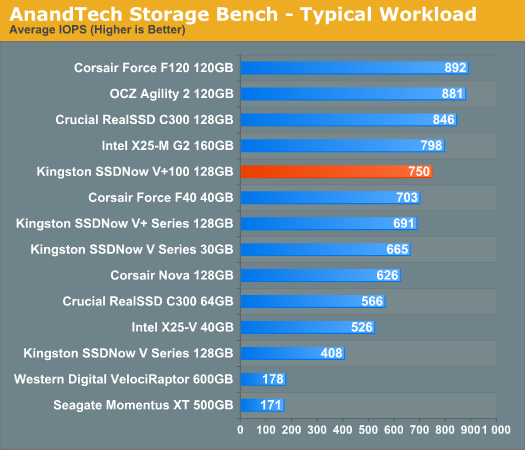
The higher capacity SandForce drives rule the roost here, but the C300, X25-M G2 and V+100 are not too far behind. Despite its age, Intel's X25-M G2 performs very well in our light usage test. The V+100 isn't far behind thanks to its 8.5% improvement over the original V+.
As far as small capacity drives go, the Corsair Force F40 and other similarly sized SandForce drives are the clear winners here. Crucial's 64GB RealSSD C300 is quicker than the X25-V, but no match for the 40GB SF drive.
If there’s a light usage case there’s bound to be a heavy one. In this test we have Microsoft Security Essentials running in the background with real time virus scanning enabled. We also perform a quick scan in the middle of the test. Firefox, Outlook, Excel, Word and Powerpoint are all used the same as they were in the light test. We add Photoshop CS4 to the mix, opening a bunch of 12MP images, editing them, then saving them as highly compressed JPGs for web publishing. Windows 7’s picture viewer is used to view a bunch of pictures on the hard drive. We use 7-zip to create and extract .7z archives. Downloading is also prominently featured in our heavy test; we download large files from the Internet during portions of the benchmark, as well as use uTorrent to grab a couple of torrents. Some of the applications in use are installed during the benchmark, Windows updates are also installed. Towards the end of the test we launch World of Warcraft, play for a few minutes, then delete the folder. This test also takes into account all of the disk accesses that happen while the OS is booting.
The benchmark is 22 minutes long and it consists of 128,895 read operations and 72,411 write operations. Roughly 44% of all IOs were sequential. Approximately 30% of all accesses were 4KB in size, 12% were 16KB in size, 14% were 32KB and 20% were 64KB. Average queue depth was 3.59.
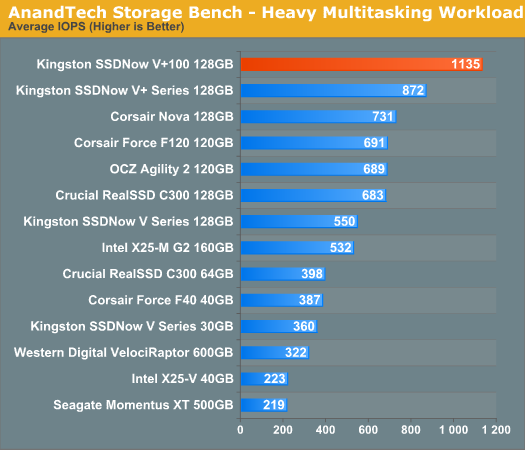
This is another one of those SYSMark-like situations. The old Toshiba controller did just awesome in our heavy multitasking workload and the new update does even better. At 1135 IOPS, the V+100 is 55% faster than the Indilinx based Corsair Nova. Thanks to the incompressible nature of much of the data we're moving around in this benchmark the SandForce drives don't do so well. Although not pictured here, the 256GB C300 would be #2 - still outperformed by the V+100.
The gaming workload is made up of 75,206 read operations and only 4,592 write operations. Only 20% of the accesses are 4KB in size, nearly 40% are 64KB and 20% are 32KB. A whopping 69% of the IOs are sequential, meaning this is predominantly a sequential read benchmark. The average queue depth is 7.76 IOs.
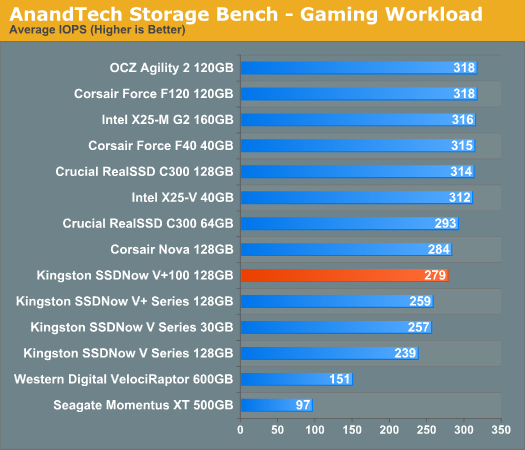
The perplexing nature of the V+100 continues here. While it boasts great sequential read numbers, the smaller and somewhat random accesses drop the V+100 behind the SandForce and Crucial SSDs.


96 Comments
View All Comments
dagamer34 - Saturday, November 13, 2010 - link
If you're buying an SSD, I see no reason why your OS should still be Windows XP.Oxford Guy - Sunday, November 14, 2010 - link
Some may not want to pay the Microsoft tax.Out of Box Experience - Monday, November 15, 2010 - link
What you see is irrelevant to what I use!I see several good reasons to use XP and None to using Windows 7
The number 1 OS is still XP and has the highest user base so why does OCZ think the public will spend an extra $200 for Windows 7 just to use their overhyped SSD's?
Why doesn't OCZ just build SSD's for the majority of people on XP instead of making their customers jusmp though all these hoops just to get synthetic speeds from their drives that have little to do with real world results?
sprockkets - Sunday, November 21, 2010 - link
Oh, I don't know, TRIM support, built in alignment support, build in optimization after running WEI for SSDs?But if you want to stick with a 9 year old OS which lacks basic security, poor desktop video rendering, etc, go right on ahead.
Anand Lal Shimpi - Thursday, November 11, 2010 - link
Representing the true nature of "random" access on the desktop is very difficult to do. Most desktops don't exhibit truly random access, instead what you get is a small file write followed by a table update somewhere else in the LBA space (not sequential, but not random). String a lot of these operations together and you get small writes peppered all over specific areas of the drive. The way we simulate this is running a 100% random sweep of 4KB writes but constraining it to a space of about 8GB of LBAs. This is overkill as well for most users, however what the benchmark does do is give an indication of worst case small file, non-sequential write performance. I agree with you that we need more synthetic tests that are representative of exactly what desktop random write behavior happens to be, however I haven't been able to come across the right combination to deliver just that. Admittedly I've been off chasing phones and other SSD issues as of late (you'll read more about this in the coming weeks) so I haven't been actively looking for a better 4KB test.Now OS X feeling snappier vs. SandForce I can completely agree with. I don't believe this is 100% attributable to the data you see here, Apple also has the ability to go in and tweak its firmwares specifically for its software. I believe the ultra quick response time you see from boot and resume comes from firmware optimizations specific to OS X. Although I am going to toss this Kingston drive in my MBP to see what things look like at that point.
Take care,
Anand
iwodo - Friday, November 12, 2010 - link
ARH, Thx,"toss this Kingston drive in my MBP to see what things look like at that point."
I never thought of that. Keep thinking mSATA was blocking anyone from testing it.
I am looking forward to see your SSD issues and MBP testing.
Tech news has been dull for number of years, SSD finally make thing interesting again.
sunjava04 - Friday, November 12, 2010 - link
hey anand,would you provide a different SSD test result with macbook pro?
like me, many macbook unibody or new mac book pro users use mainly for browsers and office, iphoto, itunes. we like to have ssd to make our experience better and faster. i search many website and blogs, but there are no clear answer for this.
even, apple keeping quite about "TRIM" support!
after, reading your article, i am still not sure which ssd is good for my macbook unibody. i got the an idea of garbage collection which was very helpful. but didn't know, how long ssd last if we use for general purpose?
i really appreciate if you provide descriptive guideline of ssd for OS X.
please, also tell us, is it worth to waiting for intel 3rd gen.?
i desperately need ssd for mac book unibody!
i dont mind to pay premium as long as performance stay as it is! also, i can store movies and other data in external hard drive!
Sincerely,
Rishi
iwodo - Saturday, November 13, 2010 - link
As of Today, i just read another review on SSD comparison. Namely Intel SSD and Sandforce,While the Sandforce wins on all synthetic benchmarks like Seq Read Write and Random Read Write.
It was booting slower, starting up Apps slower, finish task slower then Intel SSD.
And by an noticeable amount of percentage. ( 10 - 30% )
I am beginning to think there are things Sandforce dont work well at all. But again, we have yet to find out what.
Out of Box Experience - Tuesday, November 16, 2010 - link
Sandforce controllers give you the "illusion" of speed by writing less data to flash than contollers without hardware compressionIf I wanted to test the speed of a copy and paste involving 200MB of data in the flash cells of a sandforce based controller, how can I tell exactly how much data is in the flash cells?
I mean, would Windows tell me how much compressed data is represented in the flash cells (200MB), or would Windows tell me how much compressed data is in the cells (maybe only 150MB) ?
The only way I can see fairly comparing an SSD with hardware compression and one without is to be sure you are actually writing the same amount of data to the flash cells (in this case - 200MB)
If sandforce based SSD's will only tell you how much data is represented and not what is actually on the drive, then I think the best way would be to use data that cannot be compressed
The tests I described in another post here involved copying and pasting 200MB of data which took 55 seconds on an ATOM computer with a Vertex 2
200MB / 55 sec = 3.6MB/sec
But if the 200MB was only a representation and the actual amount of data was for example 165MB in flash, then the actual throughput of my Vertex was even worse than I thought (In this case - 165MB / 55sec = 3.0MB/sec)
I need to know exactly how much data is indeed in flash or I need to start using non-compressible data for my tests
Make sense?
Out of Box Experience - Monday, November 15, 2010 - link
There has to be an missing pieces in our performance test, something that these companies knows and we dont.------------------------------------------
Like smoke & Mirrors?
Sandforce Controllers Compress the data to give you the impression of speed
check the speed without compression and then compare drives