AMD's Fall Refresh: New Phenom II and Athlon II CPUs Balance Price and Performance
by Anand Lal Shimpi on September 21, 2010 2:52 AM EST- Posted in
- CPUs
- AMD
- Phenom II X6
- Athlon II
Overclocking
Global Foundries has been hard at work. While most of its public discussion has been about ARM and 28nm, AMD’s foundry partner continues to crank out 45nm SOI parts. Overclocking in general has improved on AMD’s CPUs as GF’s 45nm process is fairly mature.
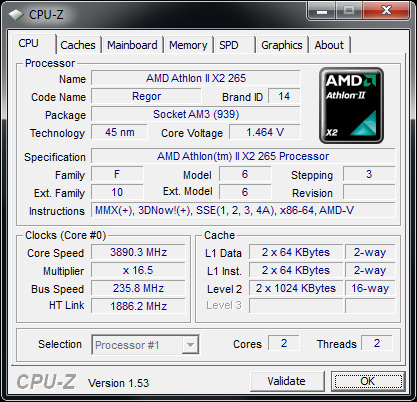
When I reviewed the Athlon II X2 255 in January I indicated a 3.7 - 3.8GHz overclock was within reason. My Athlon II X2 265 sample managed 3.89GHz:
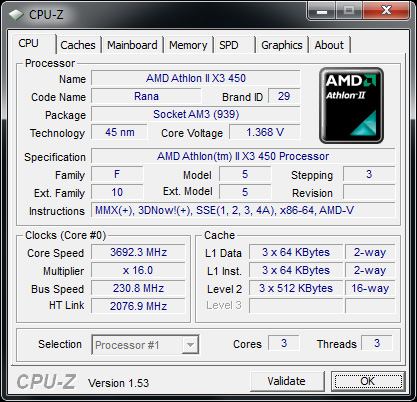
Moving up the totem pole the Athlon II X3 450 topped out at 3.692GHz:
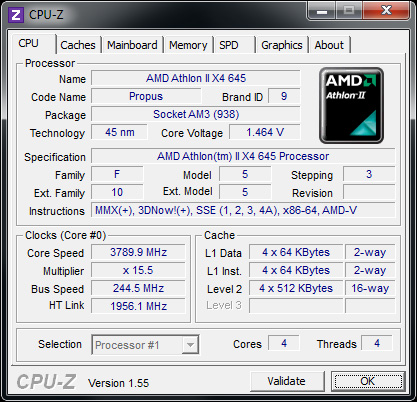
The Athlon II X4 645 managed a 22% overclock to 3.789GHz:
Our best overclock with the stock cooler came from the Phenom II X4 970 at 4.1GHz:

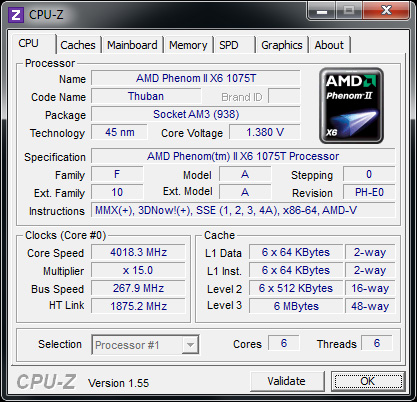
Finally we have the 1075T that managed a 4GHz overclock, although I wasn't convinced of the overclock's stability in my tests - dropping down to 3.9GHz is probably a safer bet in this case:


98 Comments
View All Comments
Guspaz - Tuesday, September 21, 2010 - link
A few price to performance graphs would be nice. You know, "sysmarks per dollar", or that sort of thing. It would help identify the sweet spot in processor reviews.Anand Lal Shimpi - Tuesday, September 21, 2010 - link
I've been thinking about doing it for a while, it looks like there's overwhelming desire for it so I'll begin working on the best way to put it together :)Take care,
Anand
Taft12 - Tuesday, September 21, 2010 - link
I'm not sure "Sysmarks/$" is all that more useful than a general recommendation that the results reveal quite clearly. In this article for example, the Athlon X3 is a stellar value while the Athlon X4 and i5 quad cores are also very good.However, this has been common knowledge for over a year now, so are we really getting anything we didn't already know from a "Sysmarks/$"-type of graph?
RyuDeshi - Monday, September 27, 2010 - link
I haven't been in the market for a new processor/chipset for over a year now, so price/performance is something that would be very helpful for me right now with all these newer chips since Core2 and Phenom I. So I concur with the OP, I would love to see some price references in or near some graphs.marraco - Tuesday, September 21, 2010 - link
No, please. Do not do bar charts. Do X-Y price-performance charts. They are far more useful.vol7ron - Tuesday, September 21, 2010 - link
I'm kind of partial to the smallnetbuilder's price-performance chart: http://www.smallnetbuilder.com/index.php?option=co...You can hover to see the item.
evilspoons - Tuesday, September 21, 2010 - link
Seconded. X-Y performance charts are the way to go!!evilspoons - Tuesday, September 21, 2010 - link
Err, price-performance.Brucmack - Wednesday, September 22, 2010 - link
If you do that, please integrate the differences in power consumption somehow. It would be silly to save $20 by buying an AMD processor if it costs $50 more to run over its lifetime.strikeback03 - Wednesday, September 22, 2010 - link
How long would that lifetime be? 1 year? 4 years? Is the machine on all the time but idling 22 hrs a day? Is it gamed on 10 hrs a day but off the rest?