Server Clash: DELL's Quad Opteron DELL R815 vs HP's DL380 G7 and SGI's Altix UV10
by Johan De Gelas on September 9, 2010 7:30 AM EST- Posted in
- IT Computing
- AMD
- Intel
- Xeon
- Opteron
Response Times
At low 30% to 60% utilization, we cannot compare throughput. The throughput is more or less the same on all machines. Response times make the difference here. It is important to interprete the numbers carefully though.
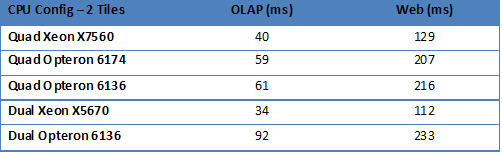
This might come as a surprise, but the dual Xeon X5670 inside the HP DL380 G7 comes out as the best (fastest) server here. The Xeon X5670 extracts more parallelism out of the code of one thread and clocks one core quite a bit higher than the other cores. Response times are measured per URL/query, thus single threaded performance is the determining factor until all cores are working as hard as they can.
We are working on about 30 virtual CPUs, or “worlds” in the eye of the ESX scheduler. The dual Xeon X5670 can offer 24 Hardware Execution Contexts (HECs), the quad Opteron 6174 can offer 48. However, the Opteron cannot leverage the HEC advantage enough in this scenario. The Xeon X7560 has more or less the same core, but a lower clock but it does not suffer from the small scheduling overhead that the Xeon 5670 suffers having less HECs than VMs running. So that is why the 2.26 Xeon 7560 offers only 10-15% higher response times.
So how important is this? Is the Xeon twice as fast as the Opteron? Not really. Remember that we measured this over low latency LAN. A typical web request send from Europe to the AnandTech server in North Carolina will take up to 400 ms. In that scenario the extra 100 ms difference between the Xeon and Opteron will start to fade.
The higher the load, the more the Opteron will narrow the gap as it starts to leverage the higher throughput.
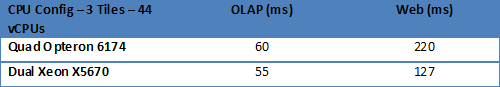
The difference in user experience is hardly as dramatic as the numbers indicate. Whether you will care or not will also depend on the application. Some web requests can take up to 2 seconds (220 ms is only an average), so it really depends on how complex your application is. If you run at a light load and the heaviest requests are answered within half a second, nobody will notice if it is 300 or 180 ms. But if some of your requests take more than a second even under "normal" load, this difference will be noticeable.
So response time under "normal" load might not be as important as under heavy load, but the numbers above also show you that throughput is not everything. Single threaded performance is still important, and we definitely feel that the UltraSparc T2 approach is the wrong one for most business applications out there. A good balance between single-threaded and multi-core is still advisable for our web applications that get heavier as we build upon feature rich Content Management Systems.
Once we load the systems close their maximum, a totally different picture emerges. Below you can see the response times with much higher concurrencies and the four tiles of full vApus Mark II testing. Remember that the concurrencies are 10 times higher and the OLTP test is included.
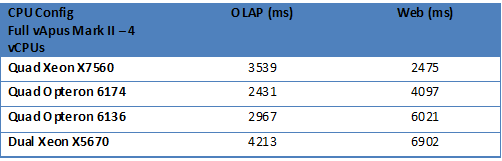
The quad Xeon wins in the web tests while the quad Opteron leads in the OLAP tests. The OLAP test is more bandwidth sensitive and that is one of the reasons that the quad Opteron configurations excel there.
The dual Xeon 5670 has only 24 HECs to offer and 72 worlds are constantly demanding CPU power. No wonder that the dual Xeon is completely swamped and as a result has the worst response times.


51 Comments
View All Comments
JohanAnandtech - Friday, September 10, 2010 - link
Thanks, appreciate you took the time to let us know. We went through 5 weeks of intensive testing and my eyes still hurt from looking at the countless excel sheets, with endless power and response time readings. ;-)FourthLiver - Thursday, September 9, 2010 - link
at the end of page 12, you allude to a performance per watt analysis. looks like you forgot to put it up. i'm chomping at the bit to see those numbers!please disregard me if i failed to rtfa correctly. Anandtech is the best; your (all of you collectively) articles are brilliant and correct down to the smallest details. This is another article that was an absolute joy to read. :]
JohanAnandtech - Thursday, September 9, 2010 - link
Well you can't really calculate it, as it depends on the situation. On low load loads, the system that consumes the less, is the winner, on the condition that the response times stay low. But of course, if your systems are running at low load all time, there might be something wrong: you should have bought more RAM and consolidated more VMs per system.At higher loads, the power consumption at high load divided by the throughput (vApusmark) is close to the truth. But it is definitely not the performance/watt number for everyone
It depends on your workloads. The more critical processing power (think response time SLA) is, the more the last mentioned calculation makes sense. The more we are talking about lots of lightly loaded VMs (like authentification servers, fileservers etc.), the more simply looking at the energy consumed at page 12 make sense.
mino - Thursday, September 9, 2010 - link
First, congratulations to a great article !Now to the small ammount of mess in there:
"the CPUs consume more than the ACP ratings that AMD mentions everywhere"
1) Avegare CPU Power (ACP) is NOT supposed/marketed to represent 100% load power use
Wikipedia: "The average CPU power (ACP), is a scheme to characterize power consumption of new central processing units under "average" daily usage..."
2) 122W at the wall and 110W at the CPU ??? Are you telling us the PSU's are 95% along with VRM/power/fans at 95% efficiency ? (0.95*0.95*1.22=1.10)
. Sorry to spoil the party but that is NOT the case. 122W at wall means 100W at CPU at the most realistically 95W.
Otherwise a great work. Keep is up!
JohanAnandtech - Friday, September 10, 2010 - link
"1) Avegare CPU Power (ACP) is NOT supposed/marketed to represent 100% load power useWikipedia: "The average CPU power (ACP), is a scheme to characterize power consumption of new central processing units under "average" daily usage...""
You are right. But what value does it have? As an admin I want to know what the maximum could be realistically (TDP is the absolute maximum for non-micro periods) and if you read between the lines that is more or less what AMD communicated (see their white paper). if it is purely "average", it has no meaning, because average power can be a quite a bit lower as some servers will run at 30% on average, others at 60%.
These PSU are supposed to be 92-94% efficient and AFAIK the VRMs are at least 90% efficient. So 122 x 0.92 x 0.90 = 101 W.
mino - Saturday, September 11, 2010 - link
Well, I was bit unslept when writing it but anyway. So got a bit harser than should have.In my experience the ACP values pretty well represent your average loaded server (<= 80% load). But that is not the point.
AMD created ACP in a response to the fact that their TDP numbers are conservative while Intel's are optimistic. That was the main cause wery well known to you as well.
Call me an ass but I certainly do not remember AT bitching about Intel TDPs no bein representative (during last 6 years at least).
And we all know too well that those NEVER represented the real power use of their boxen nor did they EVER represented what the "TDP" moniker stands for.
Currently the situation is as such that identical 2P AMD box with 80W ACP has ~ the same power requirements as 2P Intel box with 80W TDP. You have just proven that.
Therefore I believe it would be fair to stop bitching about AMD (or Intel) cheating in marketing (both do) and just say whether the numbers are comparable or not.
Arguing about spin wattage is not really needed.
JohanAnandtech - Monday, September 13, 2010 - link
"Arguing about spin wattage is not really needed. "I have to disagree. The usual slogan is "don't look at TDP, look at measurements". What measurments? The totally unrealistic SPECpower numbers?
It is impossible for review sites to test all CPUs. So it is up to vendors to gives us a number that does not have to be accurate on a few percent, but that let us select CPUs quickly.
Customers should have one number that allows them to calculate worst case numbers which are realistic (heavily load webserver for example, not a thermal virus). So all CPU vendors should agree on a standard. That is not bitching, but is a real need of the sysadmins out there.
mino - Thursday, September 9, 2010 - link
One thing I would love to see is having the lowest end HP server put to its paces.So far it seems to us a the best option for vCenter hosting in small environments (with FT Vm's hosting vCenter).
Maybe even run 1-tile vAPUS (v1? perhaps) on it ?
m3rdpwr - Thursday, September 9, 2010 - link
I would have prepared to have had the DL385 G7 compared.They can be had with 8 and 12 core CPU's.
We have close to 200 HP servers of all models, rack and blades.
Many running vm in our Data Center.
-Mario
duploxxx - Friday, September 10, 2010 - link
same here, we moved also to 385g7 with the new 8-12core cpu's, Nice servers with huge core count since we never run more vCPU then pCPU in a system. Dell 815 looks like a good solution also, it was mentioned in the review the BL685 and DL585 are way more expensive.