MSI’s GeForce N470GTX & GTX 470 SLI
by Ryan Smith on July 30, 2010 1:28 PM ESTMSI N470GTX: Power, Temperature, Noise, & Overclocking
As we’ve discussed in previous articles, with the Fermi family GPUs no longer are binned for operation at a single voltage, rather they’re assigned whatever level of voltage is required for them to operate at the desired clockspeeds. As a result any two otherwise identical cards can have a different core voltage, which muddies the situation some. This is particularly the case for our GTX 470 cards, as our N470GTX has a significantly different voltage than our reference GTX 470 sample.
|
GeForce GTX 400 Series Voltage |
||||
| Ref GTX 480 | Ref GTX 470 | MSI N470GTX | Ref GTX 460 768MB | Ref GTX 460 1GB |
|
0.987v
|
0.9625v
|
1.025v
|
0.987v
|
1.025v
|
While our reference GTX 470 has a VID of 0.9625v, our N470GTX sample has a VID of 1.025v, a 0.0625v difference. Bear in mind that this comes down to the luck of the draw, and the situation could easily have been reversed. In any case this is the largest difference we’ve seen among any of the GTX 400 series cards we’ve tested, so we’ve gone ahead and recorded separate load numbers for our N470GTX sample to highlight the power/temperature/noise range that exists within a single product line.
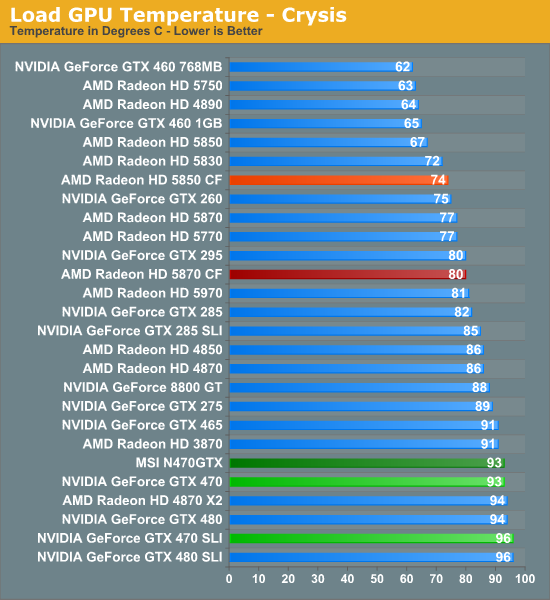
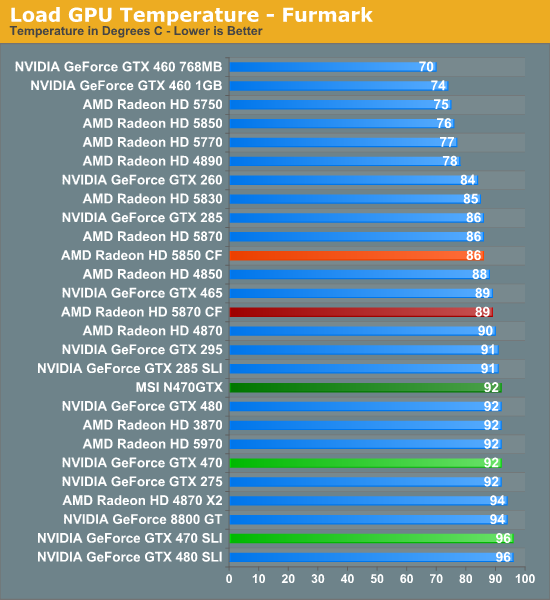
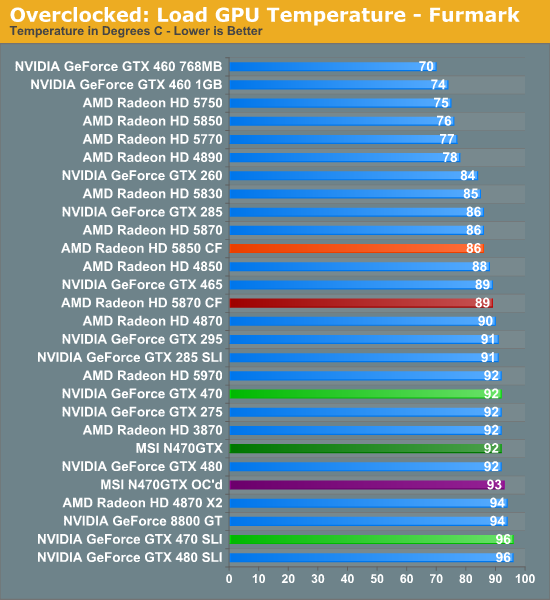
Quickly looking at load temperatures, in practice these don’t vary due to the fact that the cooler is programed to keep the card below a predetermined temperature and will simply ramp up to a higher speed on a hotter card.
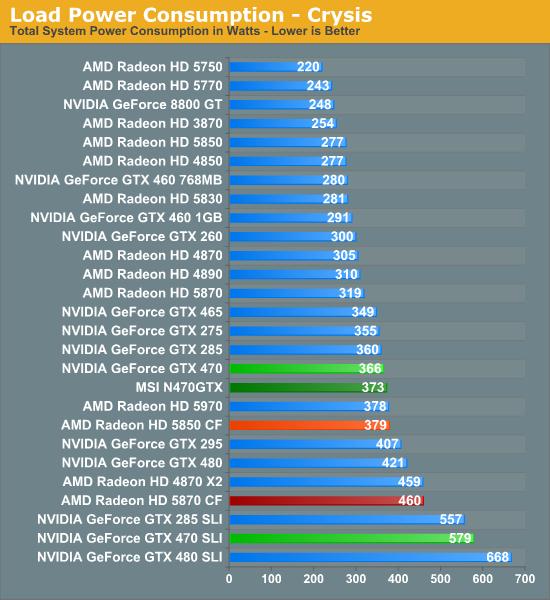
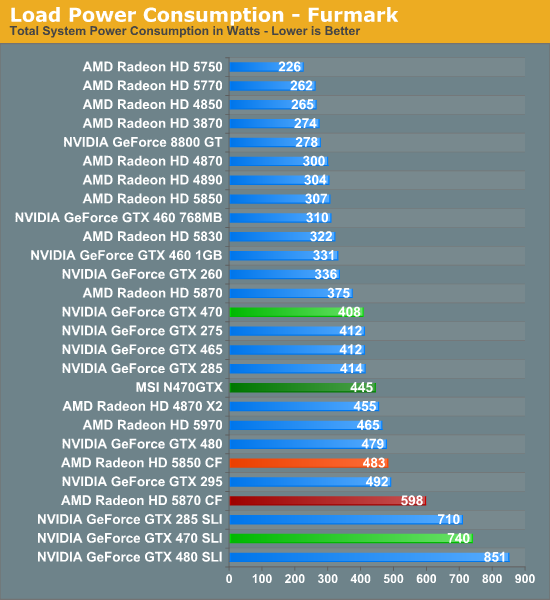
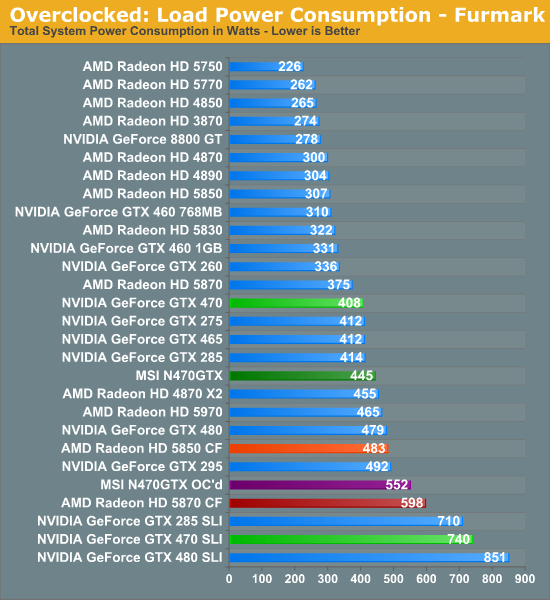
This brings us to power consumption where the difference in VID makes itself much more apparent. With all things being held equal, under Crysis our N470GTX sample ends up consuming 7W more than our reference sample GTX 470. However under Furmark this becomes a 37W difference, showcasing just how wide of a variance the use of multiple VIDs can lead to in a single product. Ultimately for most games such a large VID isn’t going to result in more than a few watts’ difference in power consumption, but under extreme loads having a card with a lower VID GPU can have its advantages.
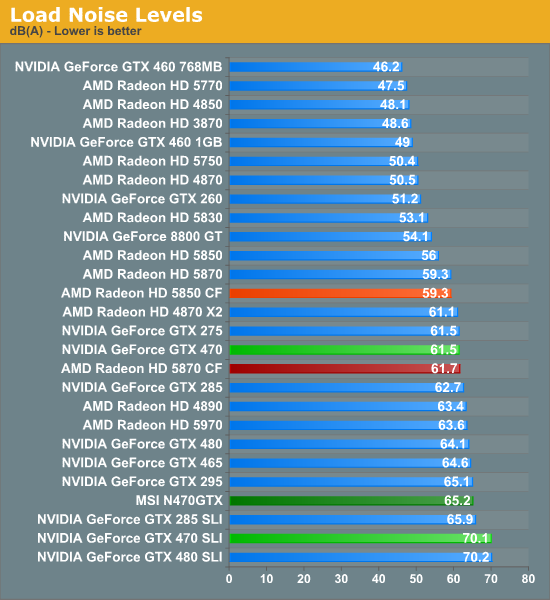
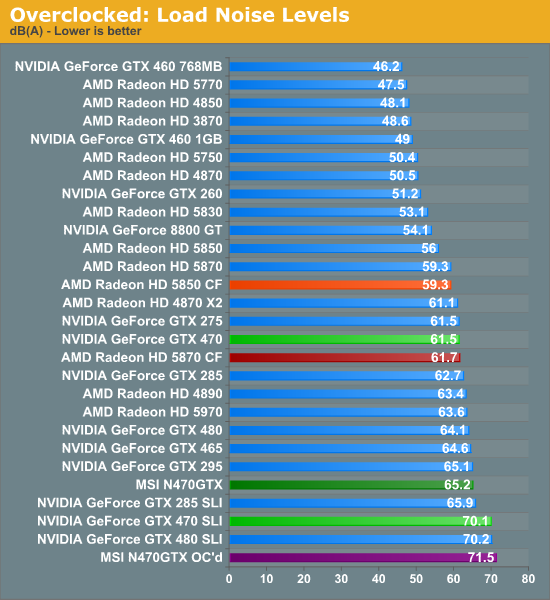
As we started before, the cooler on the GTX 470 targets a specific temperature, varying the fan speed to match it. With the higher VID and greater power consumption of our N470GTX sample, this means the card ends up being a good 3.7dB louder under Furmark than our reference sample, thanks to the higher power draw (and hence heat dissipation) of the card. Note that this is a worst-case scenario though, as under most games there’s a much smaller power draw difference between cards of different VIDs, and as a result the difference in load noise is also minimal.
Overclocking
With MSI’s Afterburner software it’s possible to increase the core voltage on the N470GTX up to 1.0875v, 0.0625v above the stock voltage of our sample card. Although by no means a small difference, neither is it more than the reference GTX 470 cooler can handle, so in a well-ventilated case we’ve found that it’s safe to go all the way to 1.0875v.
| Stock Clock | Max Overclock | Stock Voltage | Overclocked Voltage | |
| MSI N470GTX | 675MHz | 790MHz | 1.025v | 1.087v |
With our N470GTX cranked up to 1.0875v, we were able to increase the core clock to 790MHz (which also gives us a 1580MHz shader clock), a 183MHz (30%) increase in the core clock speed. Anything beyond 790MHz would result in artifacting.
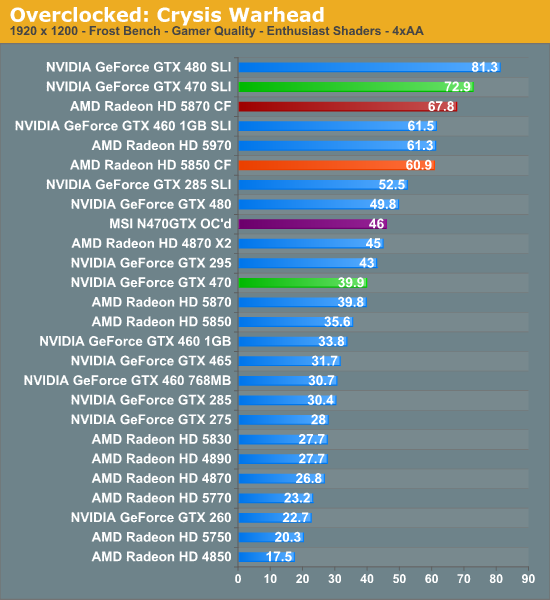
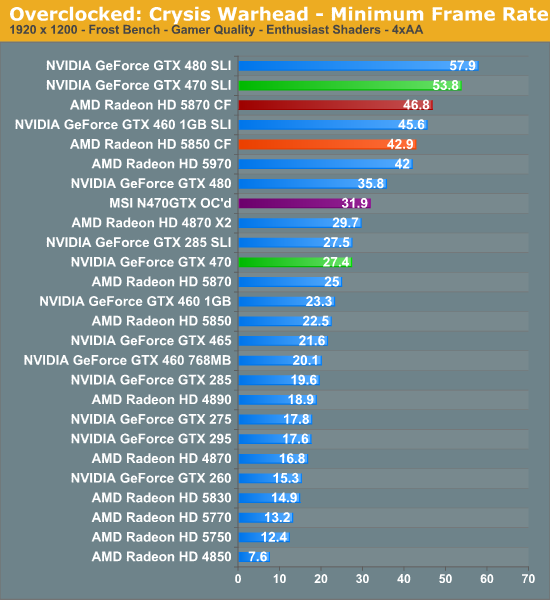
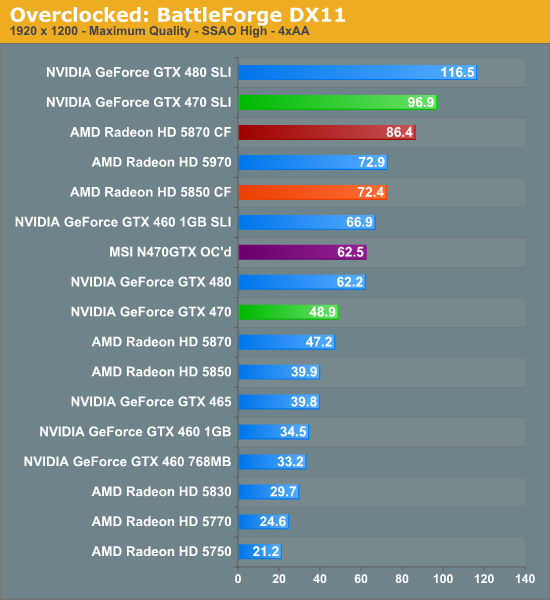
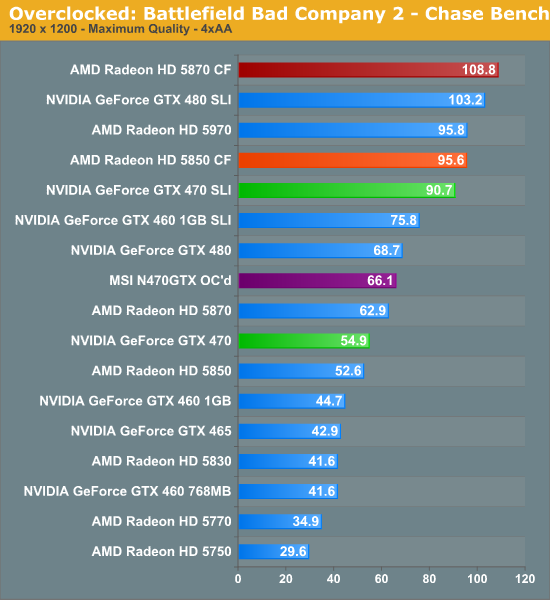
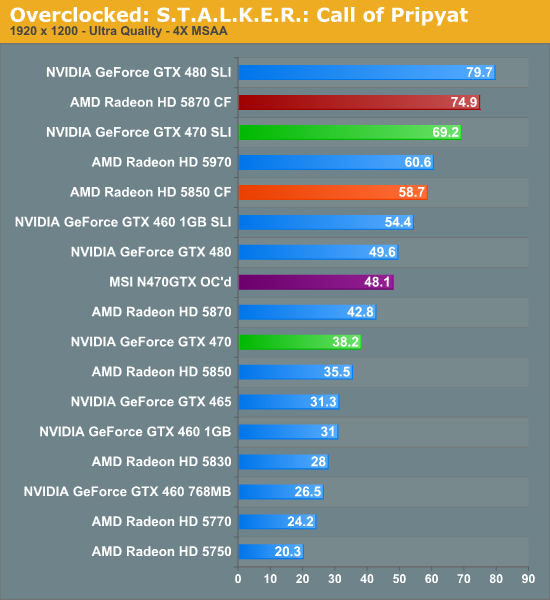
Overclocking alone isn’t enough to push the N470GTX to GTX 480 levels, but it’s enough to come close much of the time. In cases where the GTX 480 already has a solid lead over its competition the overclocked N470GTX is often right behind it – in this case this means the overclocked N470GTX manages to consistently beat the Radeon 5870, something a stock-clocked GTX 470 cannot do.
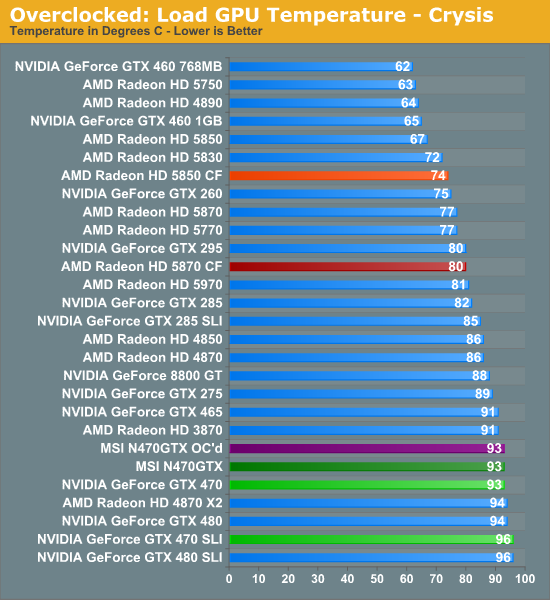
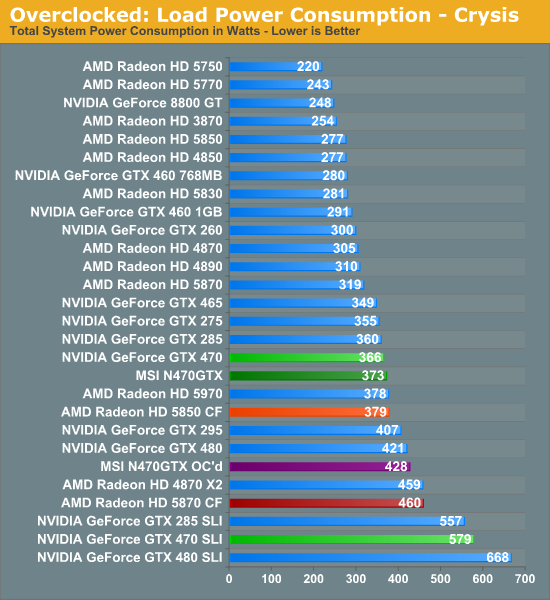
But due to the use of overvolting, that extra performance means there comes a time to pay the piper. While our temperatures hold consistent the additional voltage directly leads to additional power draw and higher fan speeds. The overclocked N470GTX can approach GTX 480 performance, but it exceeds the GTX 480 in these metrics. In terms of load noise the overclocked N470GTX is pushing just shy of 100% fan speed, making it the loudest card among our test suite. Similarly, load power consumption under both Crysis and Furmark exceeds any of our stock-clocked single-GPU cards.
Ultimately overclocking the N470GTX provides a very generous performance boost, but to make use of it you need to put up with an incredible amount of heat and noise, so it’s not by any means an easy tradeoff.


41 Comments
View All Comments
erple2 - Saturday, July 31, 2010 - link
Normally I'd agree with you, but I think that Ryan hit the nail on the head. I can recall when NVidia and ATI were optimizing the specific internal compilers specifically for 3Dmark. Tuning for one specific engine (which is what they had to do) is very time consuming and difficult, and takes more time away from optimizing the drivers in general (or for a more "worthy" cause - another popular game).I seem to recall the optimizations were things like:
if product executable matches 3dmark.exe
then
do special tweaks that work only for the 3dmark app
else
do nothing
endif
I think that's the situation we're trying to avoid nowadays - optimizing specifically for a single executable (ultimately where you end up when you want your numbers to look "best"), hurts everything else but that one thing you're optimizing for.
There's a difference between optimizing for the API vs. the specific executable...
mapesdhs - Saturday, July 31, 2010 - link
I've spent some time trying to find out why my 8800GT SLI setup was the
same or faster than a friend's 4890 CF system. Using 3DMark06 did prove
very useful in working out the reason (shader performance). See:
http://www.sgidepot.co.uk/misc/pctests.html
http://www.sgidepot.co.uk/misc/stalkercopbench.txt
Thus, though I agree with Ryan about the dangers of GPU makers
optimising for these metrics, they can be revealing sometimes, in my
case coming to the conclusion that, if one is still playing older games,
then buying a newer card might not give that much of a speedup since
the newer design may focus on newer features.
What about including the Vantage results as a point of interest, kindof
a 'by the way' addition, but downplaying the importance of such data?
Focus on the game results, but include Vantage as an 'appendix' in
terms of presentation.
Ian.
Porksmuggler - Monday, August 2, 2010 - link
Wait, you're trying to find out why your 8800GT SLI is faster than 4890CF? You need to look elsewhere than the GPUs, 8800GT SLI is not even as fast as 4850 CF, I have both on otherwise identical setups. Your links show testing of just 3DMark06, and you tested with two entirely different systems?Ryan is spot on, don't use synthetic benchmarks to compare similar generation GPUs. They are primarily used for testing when the GPU is the constant.
It seems from the replies above there is confusion about how the coding/engine of a synthetic benchmark (so-called? really?) is very different from actual games. Reviewers do far better with a battery of games, as Anandtech uses for their articles.
imaheadcase - Saturday, July 31, 2010 - link
Thats listed in THE TEST, but its excluded from graphs.Would like to compare that to it, considering upgrading to this card from that.
anactoraaron - Saturday, July 31, 2010 - link
Yeah I noticed that also. More importantly I'd like to see 2 of those in SLI along with 2 5770s in CF. I think the 2 5770's in CF has been the best bang for your buck for awhile now, especially 2 can be had for $270AR. As I recall, the 5770 (single card setup) was ~5% less than what a 260 core 216 would get you but it was cheaper (about $30 less ATM at newegg). If you have the ability to do CF/SLI having 2 lower priced cards makes the 460/470 & 5850 decision easy IMO. However since SLI scales performance better it would be interesting to see if the added $60 for 2 260's is justified against 2 5770's.Maybe for the next article?
Kyanzes - Saturday, July 31, 2010 - link
MORE minimum frame rate measurements in the articles please!!! That's the whole essence of it! Ofc, for sheer comparison, max FPS could also be included for sure, but the MIN FPS is the real interesting part.Keep it up pls!!!!
One of the reasons I tend to check out HardOCP is that they include MIN FPS.
Please, please do it often. Do it every time.
Tunnah - Saturday, July 31, 2010 - link
awesome review as usual but how come the focus on the 470 ? i thought with the release of the 460 the 470 was kind of like..its the core i7 940 to the 920 - sure it's faster but the price difference doesn't warrant the minor speed bump, and it OC's like a dreamalso, from what i've read the 460 has amazing scaling with SLI..and the temperatures are better
but this is just what i've read in 1 review so waiting to read it here before i start to believe it :D
ggathagan - Saturday, July 31, 2010 - link
RTFA3rd sentence:
"As part of a comprehensive SLI & CrossFire guide we’re working on for next month we needed a second GTX 470 for testing GTX 470 SLI operation, and MSI answered our call with their N470GTX."
Tunnah - Saturday, July 31, 2010 - link
yeah i read it, was just saying it seemed a little redundant to do a full article on an overpriced card that was being overshadowed by a cheaper, newer revisionMatrices - Saturday, July 31, 2010 - link
The 460 numbers are still there, so what's to complain about?And the 470 can be had for $275 now rather than the $350 MSRP.
If you actually read the benchmarks, you'd see that it's hardly 'overshadowed' by the 460 on performance. It's noticeably faster in more demanding titles.