Western Digital's New VelociRaptor VR200M: 10K RPM at 450GB and 600GB
by Anand Lal Shimpi on April 6, 2010 8:00 AM EST- Posted in
- Storage
Overall System Performance using PCMark Vantage
Next up is PCMark Vantage, another system-wide performance suite. For those of you who aren’t familiar with PCMark Vantage, it ends up being the most real-world-like hard drive test I can come up with. It runs things like application launches, file searches, web browsing, contacts searching, video playback, photo editing and other completely mundane but real-world tasks. I’ve described the benchmark in great detail before but if you’d like to read up on what it does in particular, take a look at Futuremark’s whitepaper on the benchmark; it’s not perfect, but it’s good enough to be a member of a comprehensive storage benchmark suite. Any performance impacts here would most likely be reflected in the real world.
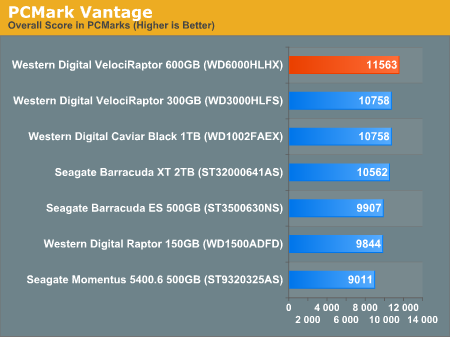
Impacting overall system performance with just a hard drive change is difficult if you're comparing fairly quick drives. You'll note that despite the competitive sequential speeds of the newer 7200RPM TB drives, the 300GB VelociRaptor is still on top. It just goes to show you the value of random access performance. It's not everything, but it's something worth paying attention to.
Compared to the old VelociRaptor, the new 600GB drive posts a 7% higher overall score in PCMark Vantage. The gains in the individual tests range from 3 to 20%.
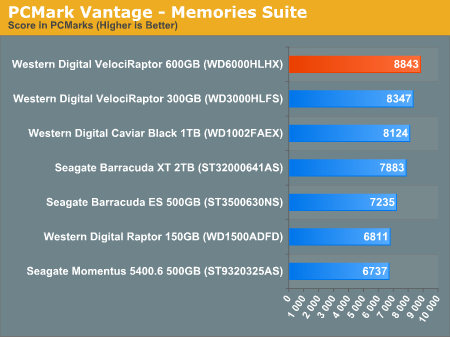
The memories suite includes a test involving importing pictures into Windows Photo Gallery and editing them, a fairly benign task that easily falls into the category of being very influenced by disk performance.
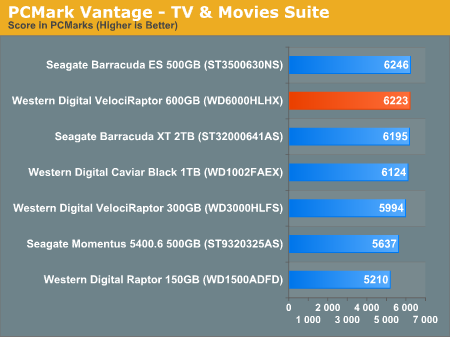
The TV and Movies tests focus on on video transcoding which is mostly CPU bound, but one of the tests involves Windows Media Center which tends to be disk bound.
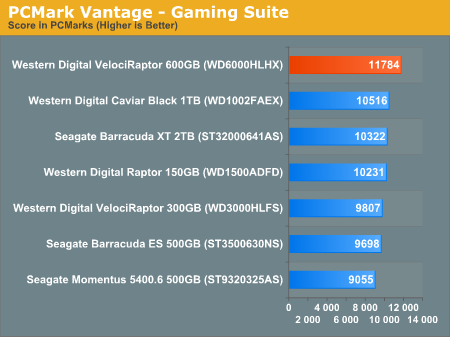
The gaming tests are effectively read tests since they spend a good portion of their time focusing on reading textures and loading level data. Actual game loading performance will differ depending on the game. Take these results as a best case scenario of what can happen, not the norm.
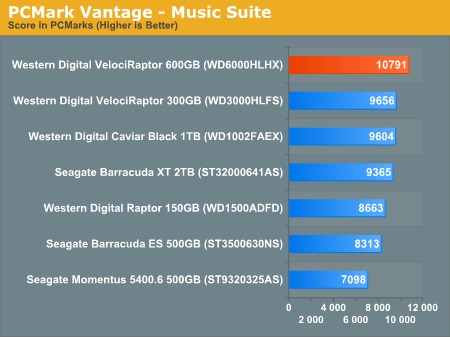
In the Music suite the main test is a multitasking scenario: the test simulates surfing the web in IE7, transcoding an audio file and adding music to Windows Media Player (the most disk intensive portion of the test).
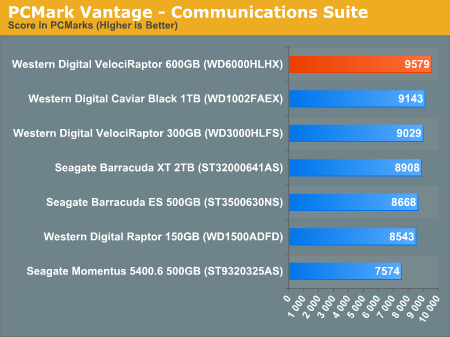
The Communications suite is made up of two tests, both involving light multitasking. The first test simulates data encryption/decryption while running message rules in Windows Mail. The second test simulates web surfing (including opening/closing tabs) in IE7, data decryption and running Windows Defender.
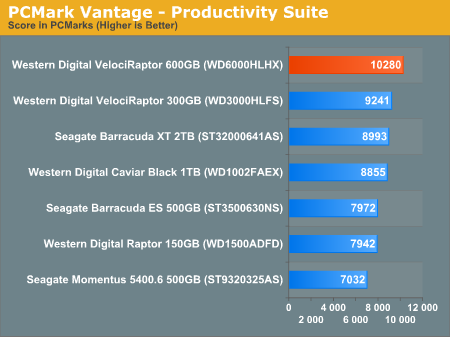
I love PCMark's Productivity test; in this test there are four tasks going on at once, searching through Windows contacts, searching through Windows Mail, browsing multiple webpages in IE7 and loading applications. This is as real world of a scenario as you get and it happens to be representative of one of the most frustrating HDD usage models - trying to do multiple things at once. There's nothing more annoying than trying to launch a simple application while you're doing other things in the background and have the load take forever.
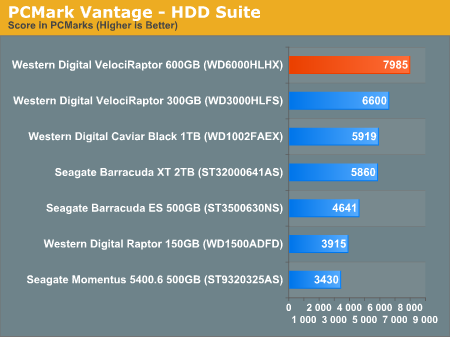
The final PCMark Vantage suite is HDD specific and this is where you'll see the biggest differences between the drives:


77 Comments
View All Comments
vol7ron - Tuesday, April 6, 2010 - link
Agreed, it could be done, but it would also cause more confusion when you could see data in one place, but not in another. Not to mention, it's probably easier not to have to worry about it from an editor's standpoint - a bad excuse, but probably true.vol7ron
Muon - Tuesday, April 6, 2010 - link
Skewing the graphs is a ludicrous argument not to include SSD in the test. Why not use a logarithmic scale? I guess maybe people in the USA are too dumb to understand such graphs and would think the performance difference is much smaller then it really is.Earthmonger - Tuesday, April 6, 2010 - link
What would be the point of including SSD results?Would you compare a horse and buggy to a turbo-diesel 18-wheeler?
A wax candle to a halogen headlamp?
HotFoot - Tuesday, April 6, 2010 - link
People aren't really selling oxen and wagons to compete with 18-wheelers, whereas the Raptor here is a new product brought into the high-performance storage for desktops market. It certainly is competing against SSDs or a combination of SSD+HDD.I think the general consensus is if you're wanting a lot of performance in a desktop, you'd do better to take the $330 and buy an 80 GB SSD and a 1 TB HDD. I think, given it's about the same price for nearly double the storage capacity, it's be a VERY interesting combination to see on the performance charts.
This entire article basically starts out with the understanding that the new Raptors were obsolete before they ever launched to market.
+
Anand Lal Shimpi - Tuesday, April 6, 2010 - link
The assumption here is someone who wants a VelociRaptor for whatever reason has already ruled out an SSD. If I threw in SSD results it'd be very difficult to make comparisons between the VR and other hard drives as they'd get compressed in the chart.In the not too distant future we'll allow cross technology comparisons between HDDs and SSDs in Bench, but until then I figured just pointing folks at Bench if they wanted SSD results would suffice.
Take care,
Anand
jimhsu - Wednesday, April 7, 2010 - link
Not exactly. Even using this drive in lieu of a SSD for a boot drive is "stupid" (which I think it is), people with hundreds of gigabytes of Steam games or such simply aren't satisfied with the performance of a 1 TB drive. Putting 500 GB of games on SSD is ... expensive. Plus as I have shown in some forum posts, *most* modern games aren't so sensitive to random read/write rates anyways, so the benefit of a SSD is less than for general apps. (MMORPGs, particularly WoW in my testing, are a very clear exception)vol7ron - Tuesday, April 6, 2010 - link
@Muon:
"Skewing the graphs is a ludicrous argument not to include SSD in the test."
I'm guessing most figures from these tests are not done all at once. The charts are more likely a compilation of all the singular tests for that product, for that test bed. Meaning one test may have been run a month ago. Therefore, the SSDs are included in the tests, the results are just posted someplace else. -- go check the storage bench
"Why not use a logarithmic scale?"
Charts are included to have something visible and simple, not something you want to have think about to understand what it represents - that's the whole idea of chart vs table. Bar graphs are perfect because they are proportional and are able to list quanity, rather than a power or base of that quanity. Additionally, how would propose introducing a logarithmic chart - instituting a trendline? - if you take each value to the same base log, you're going to have the same problem with scale, and if you're using the trendline, your graph may be relational, but it will be also be visually innacurate for this type of data.
"I guess maybe people in the USA are too dumb to understand such graphs and would think the performance difference is much smaller then it really is."
That may be. Again, you'd be losing the quick-glance feature of the charts. Not to mention, AT probably has some simple charting software (or macros) that they use, which would need to be changed. If something is so much different, it's not worth including or modifying the portion of your chart. SSDs are in a league of their own and therefore have their own charts - HDDs are included in them because they won't skew the SSD chart AND the value doesn't need to be legible, all that needs to be seen is that the HDDs are insignificant. Because this particular value is about HDDs, the visual true-value comparison is necessary. You would not get that if an SSD was present.
vol7ron
vol7ron - Tuesday, April 6, 2010 - link
I'm just curious what the Windows index rating is. I know that doesn't really account for anything, but I like looking at that, for some awful reason.RaistlinZ - Tuesday, April 6, 2010 - link
I can buy two Samsung Spinpoint F3 1TB drives ($180.00) and put them in RAID 0 and get way more performance, and way more storage space, for 2/3 of the price of the 450GB Raptor. So what's the point of these Raptors exactly? I still don't see where they fit in.Fastidious - Tuesday, April 6, 2010 - link
Yeah, they seem pointless. I never understood why people buy them. With SSD around now it's just that much worse.