NVIDIA’s GeForce GTX 480 and GTX 470: 6 Months Late, Was It Worth the Wait?
by Ryan Smith on March 26, 2010 7:00 PM EST- Posted in
- GPUs
Tessellation & PhysX
We’ll kick off our in-depth look at the performance of the GTX400 series with Tessellation and PhysX. These are two of the biggest features that NVIDIA is pushing with the GTX400 series, with tessellation in particular being the major beneficiary of NVIDIA’s PolyMorph Engine strategy.
As we covered in our GF100 Recap, NVIDIA seeks to separate themselves from AMD in spite of the rigid feature set imposed by DirectX 11. Tessellation is one of the ways they intend to do that, as the DirectX 11 standard leaves them plenty of freedom with respect to tessellation performance. To accomplish this goal, NVIDIA needs significantly better tessellation performance, which has lead to them having 14/15/16 tesselators through having that many PolyMorph Engines. With enough tessellation performance NVIDIA can create an obvious image quality improvement compared to AMD, all the while requiring very little on the part of developers to take advantage of this.
All things considered, NVIDIA’s claim of having superior tessellation performance is one of the easiest claims to buy, but all the same we’ve gone ahead and attempted to confirm it.
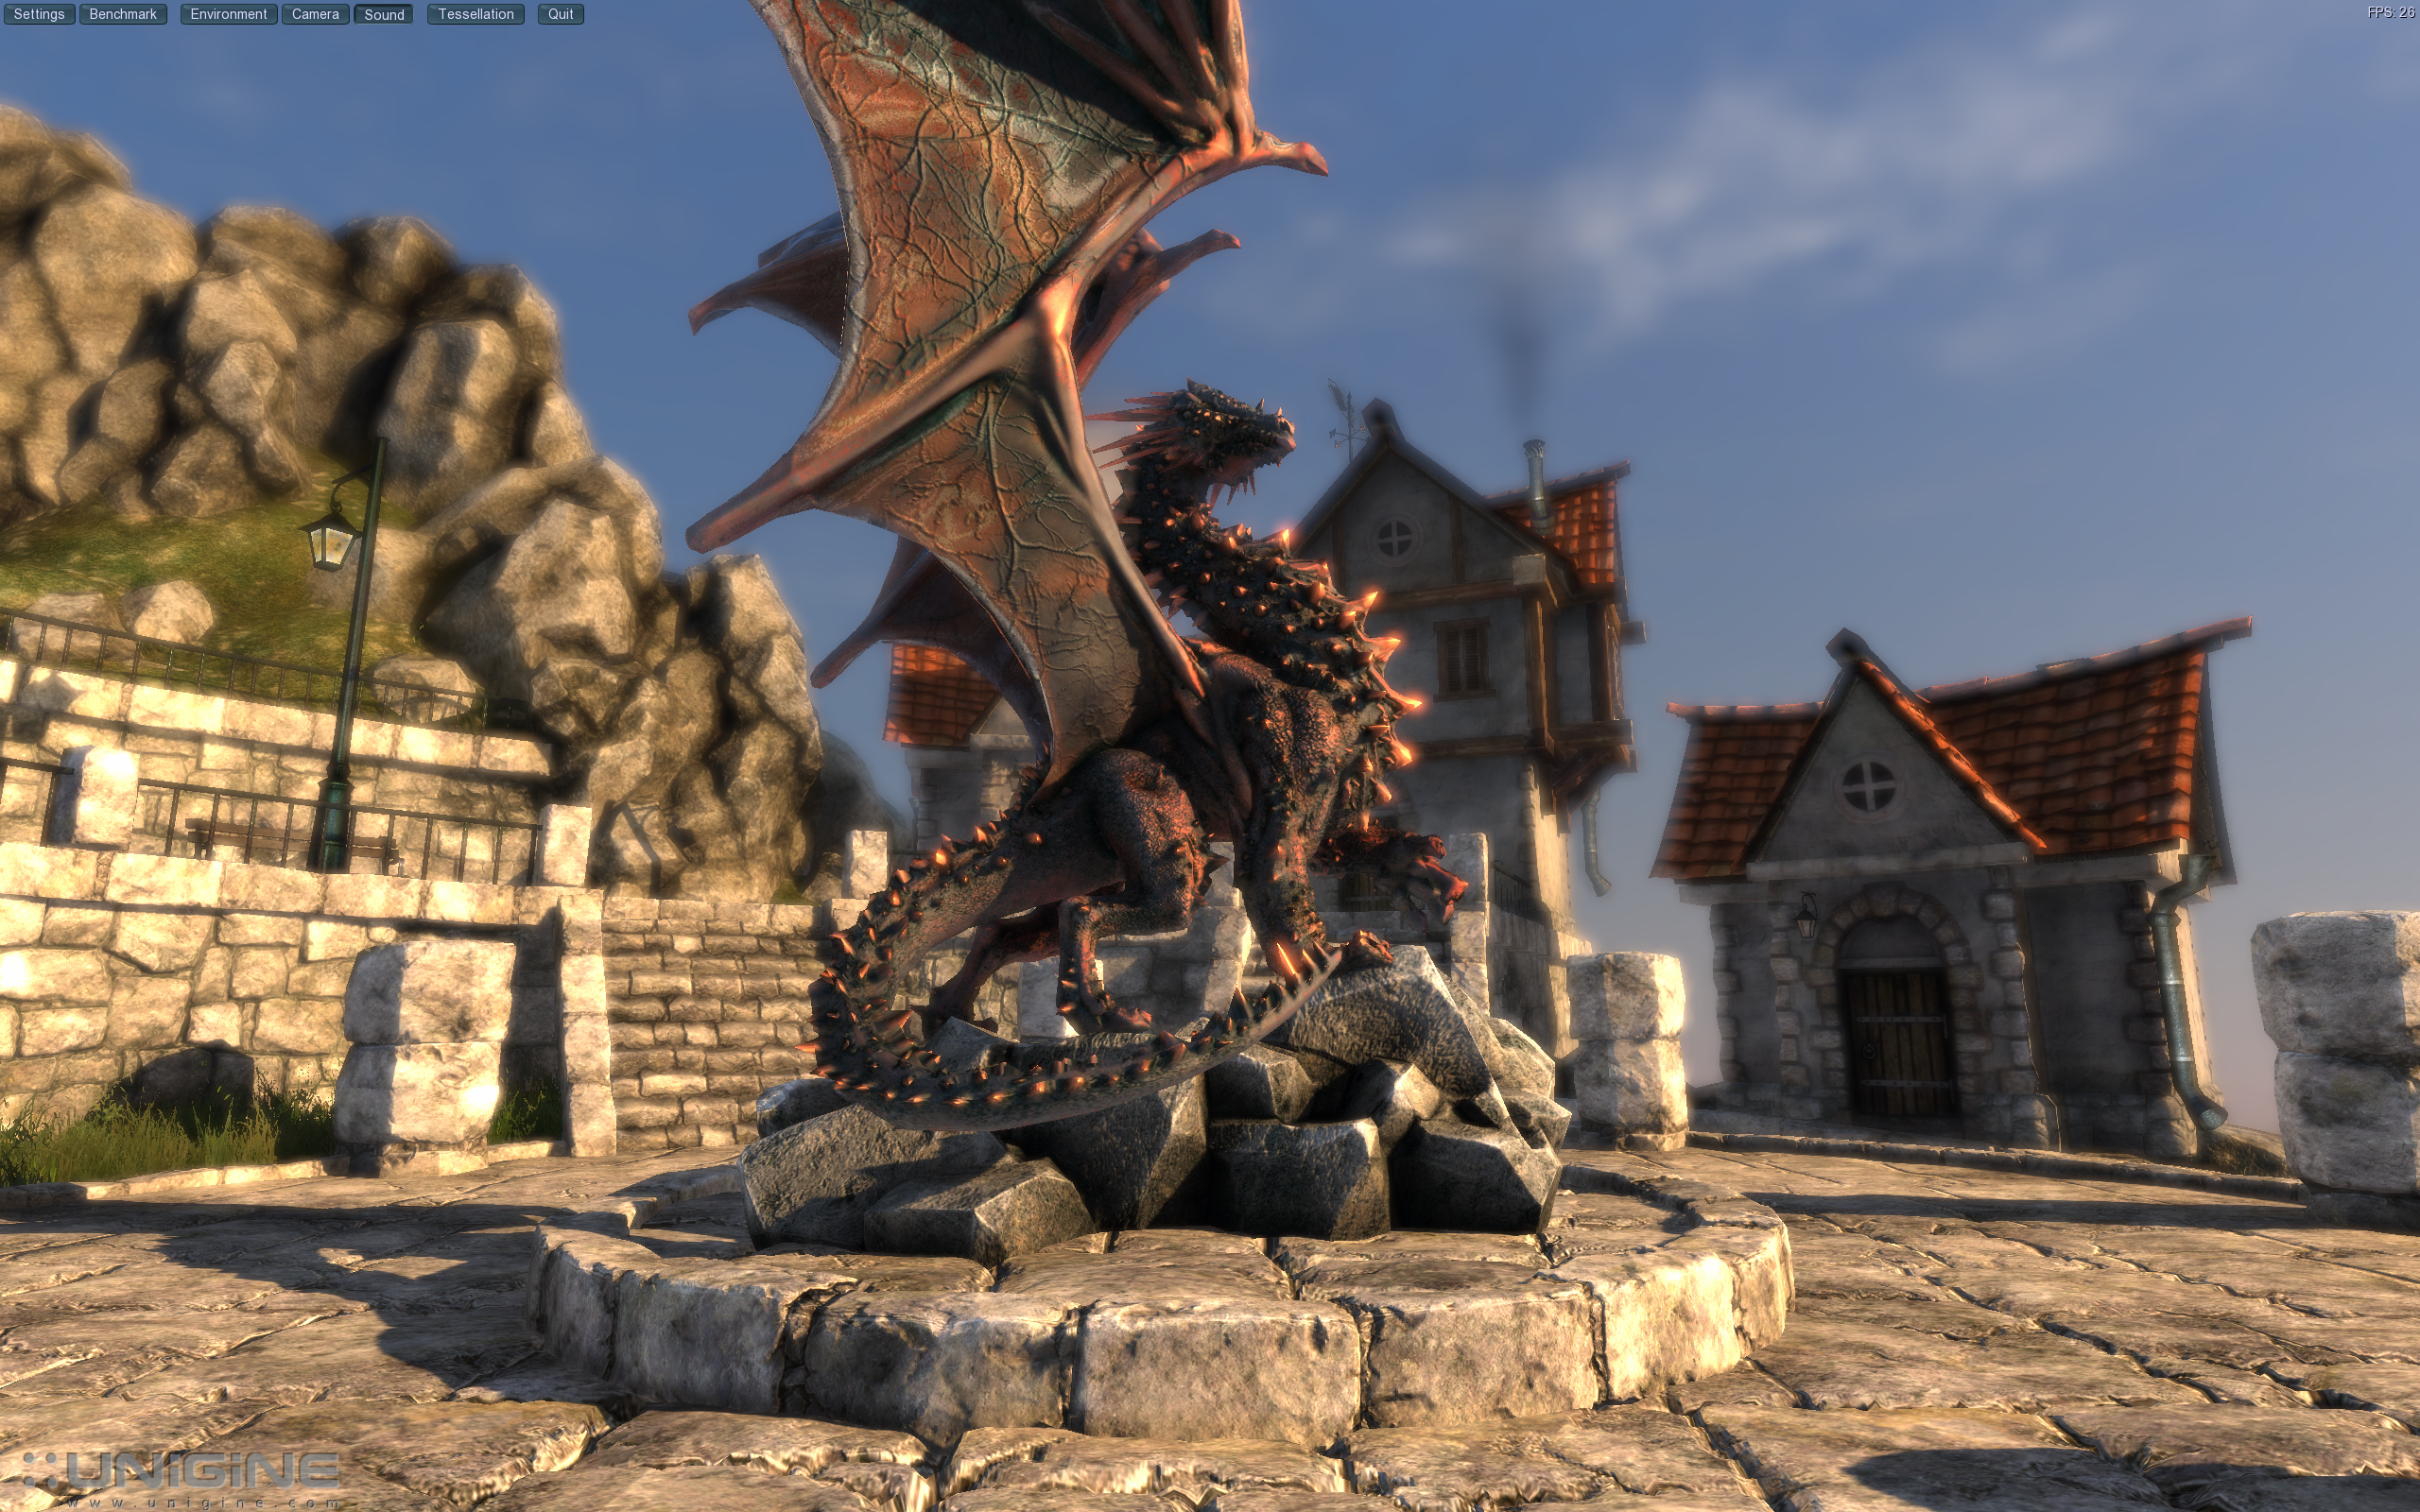
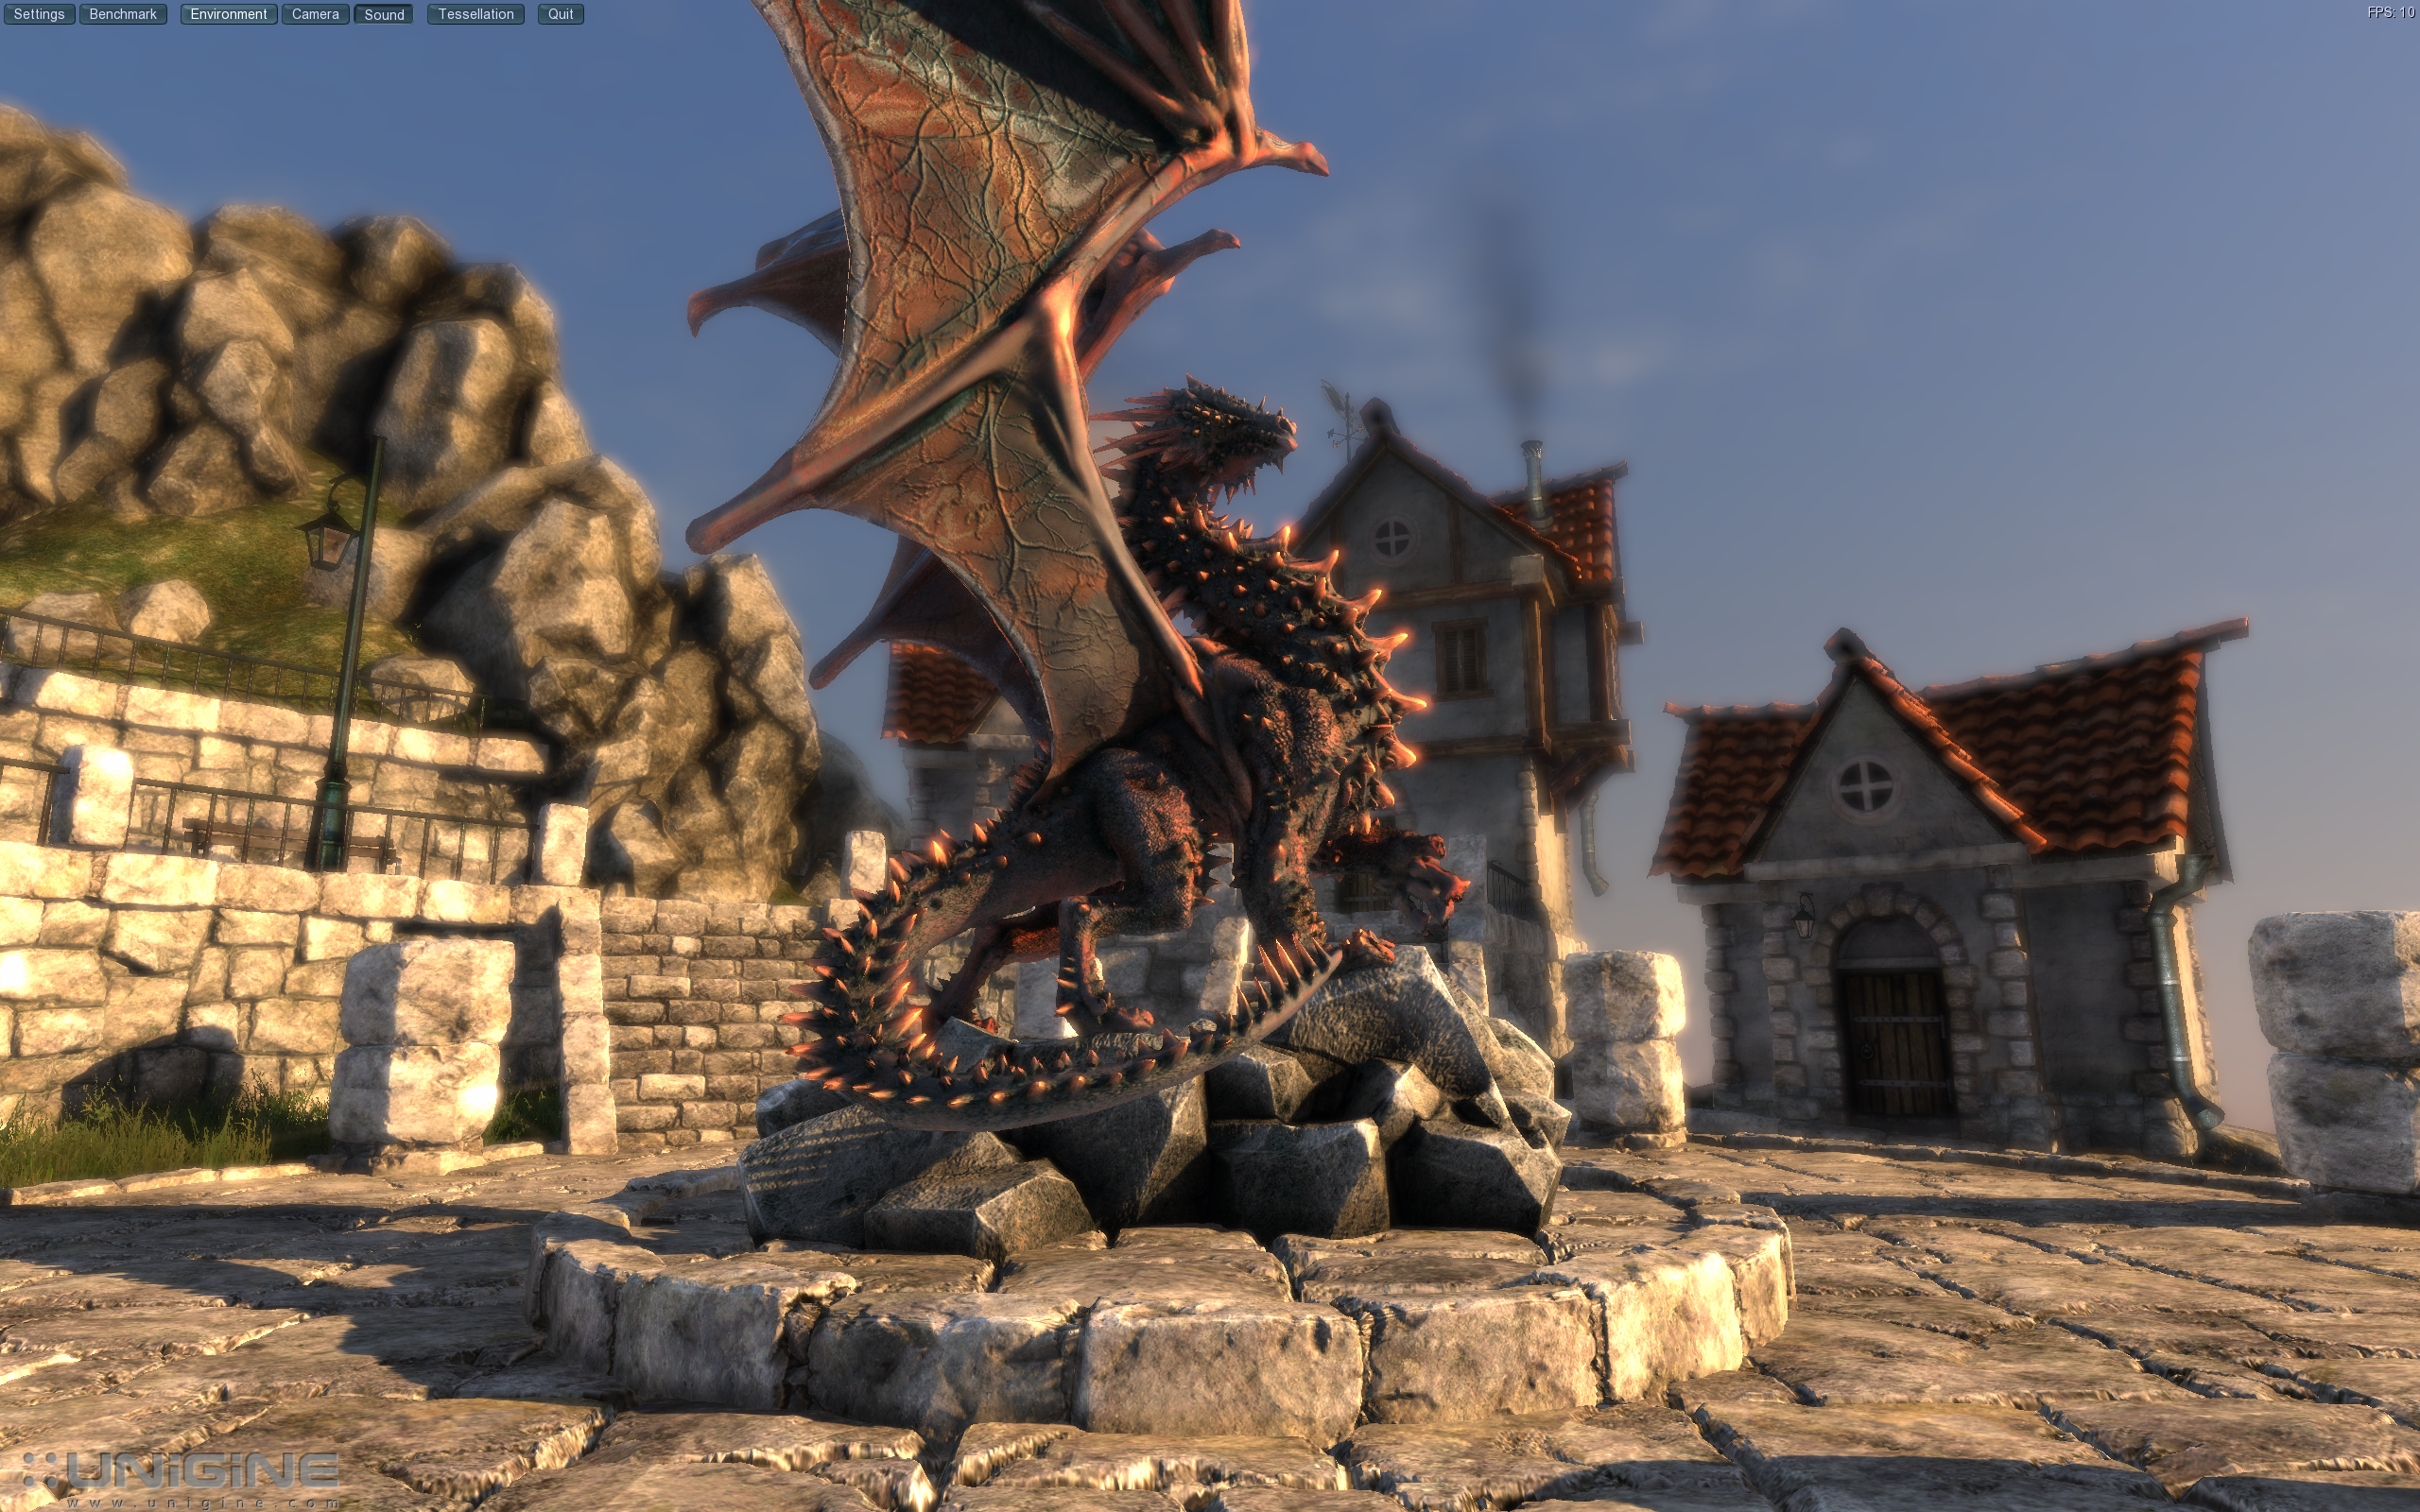
Our first tessellation test is the newly released Unigine Heaven 2.0 benchmark, which was released a few days ago. 2.0 added support for multiple levels of tessellation (with 1.0 having earned a reputation of using extreme levels of tessellation), which allows us to look at tessellation performance by varying tessellation levels. If the GTX 480’s tessellation capabilities are several times faster than the Radeon 5870’s as NVIDIA claims, then it should better handle the increased tessellation levels.
Since Heaven is a largely a synthetic benchmark at the moment (the DX11 engine isn’t currently used in any games) we’ll be focusing on the relative performance of cards to themselves in keeping with our editorial policy of avoiding synthetic GPU tests when possible.
Heaven: Moderate & Extreme Tessellation
Heaven has 4 tessellation levels: off, moderate, normal, extreme. For our test we’re using the moderate and extreme modes, comparing the performance of extreme as a percentage of moderate performance.
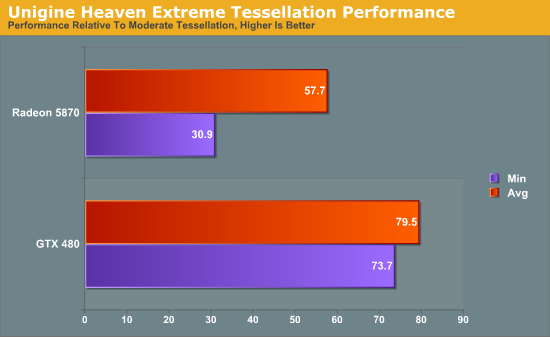
Starting with averages, the GTX 480 keeps 79% of its performance moving from moderate to extreme. On the Radeon 5870 however, the performance drop-off is much more severe, losing 42% of its performance to bring it down to 58%.
The minimum framerates are even more telling. The GTX 480 minimum framerates drop by 26% when switching to extreme tessellation. The Radeon 5870 is much worse off here, bringing in minimum framerates 69% lower when using extreme tessellation. From these numbers it’s readily apparent that the GTX 480 is much more capable of dealing with very high tessellation levels than the Radeon 5870 is.
Our second tessellation test is similar in nature, this time taken from one of Microsoft’s DX11 sample programs: Detail Tessellation. Detail Tessellation is a simple scene where tessellation plus displacement mapping is used to turn a flat rock texture in to a simulated field of rocks by using tessellation to create the geometry. Here we measure the average framerate at different tessellation factors (7 and 11) and compare the framerate at the higher tessellation factor to the lower tessellation factor.
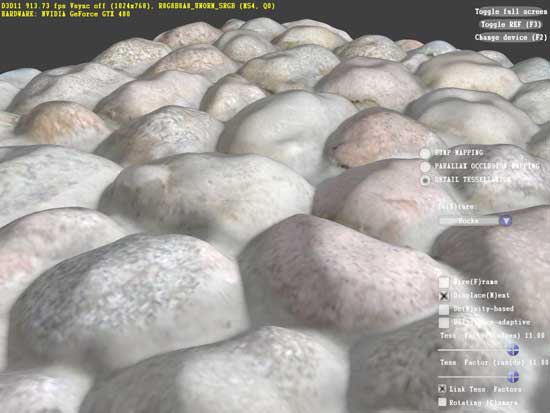
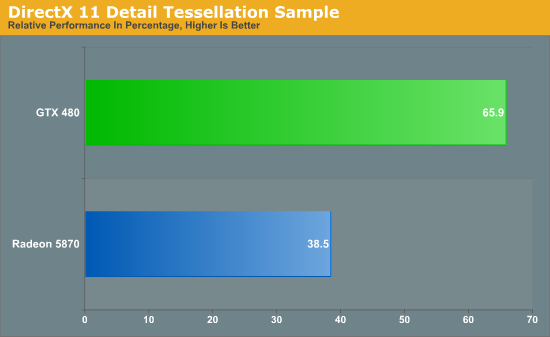
Looking at just the averages (the framerate is rather solid) we see that the GTX 480 retains 65% of its performance moving from factor 7 to factor 11. The Radeon 5870 on the other hand only retains 38% of its performance. Just as what we saw in Unigine, the GTX 480 takes a much lighter performance hit from higher tessellation factors than the Radeon 5870 does, driving home the point that the GTX 480 has a much more powerful tessellator.
With the results of these tests, there’s no reason to doubt NVIDIA’s claims about GF100’s tessellation abilities. All the data we have points GF100/GTX 480 being much more powerful than the Radeon 5000 series when it comes to tessellation.
But with that said, NVIDIA having a more powerful tessellator doesn’t mean much on its own. Tessellation is wholly dependent on game developers to make use of it and to empower users to adjust the tessellation levels. Currently every DX11 game using tessellation uses a fixed amount of it, so NVIDIA’s extra tessellation abilities are going unused. This doesn’t mean that tessellation will always be used like this, but it means things have to change, and counting on change is a risky thing.
NVIDIA’s superior tessellation abilities will require that developers offer a variable degree of tessellation in order to fully utilize their tessellation hardware, and that means NVIDIA needs to convince developers to do the extra work to implement this. At this point there’s no way for us to tell how things will go: NVIDIA’s superior tessellation abilities could be the next big thing that seperates them from AMD like they’re shooting for, or it could be the next DirectX 10.1 by being held back by weaker hardware. Without some better sense of direction on the future use of tessellation, we can’t make any recommendations based on NVIDIA’s greater tessellation performance.
Moving on we have PhysX, NVIDIA’s in-house physics simulation middleware. After picking up PhysX and its developer AGEIA in 2008, NVIDIA re-implemented PhysX hardware acceleration as a CUDA application, allowing their GPUs to physics simulations in hardware. NVIDIA has been pushing it on developers and consumers alike with limited success, and PhysX only finally had a breakthrough title last year with the critically acclaimed Batman: Arkham Asylum.
With Fermi’s greatly enhanced compute abilities, NVIDIA is now pushing the idea that PhysX performance will be much better on Fermi cards, allowing developers to use additional and more complex physics actions than ever before. In particular, with the ability to use concurrent kernels and the ability to do fast context switching, PhysX should have a reduced degree of overhead on Fermi hardware than it did on GT200/G80 hardware.
To put this idea to the test, we will be using the Batman: Arkham Asylum benchmark to measure PhysX performance. If PhysX has less overhead on Fermi hardware then the framerate hit on the GTX 480 from enabling PhysX effects should be lower than the framerate hit on the GTX 285. For this test we are running at 2560x1600, comparing performance between PhysX being disabled and when it’s set on High.
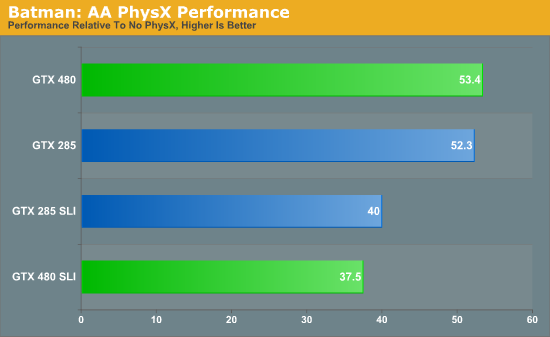
If PhysX has less overhead on Fermi hardware, Batman is not the game to show it. On both the GTX 480 and the GTX 285, the performance hit on a percentage basis for enabling PhysX is roughly 47%. The GTX 480 may be faster overall, but it takes the same heavy performance hit for enabling PhysX. The SLI cards fare even worse here: the performance hit for enabling PhysX is 60% on both the GTX 480 SLI and the GTX 285 SLI.
PhysX unquestionably has the same amount of overhead on the GTX 480 as it does the GTX 285. If PhysX is going to take up less overhead, then from what we can gather it either will be a benefit limited to PhysX 3, or will require future PhysX 2.x updates that have yet to be delivered.
Or second PhysX test is a more generalized look at PhysX performance. Here we’re using NVIDIA’s Raging Rapids tech demo to measure PhysX performance. Raging Rapids is a water simulation demonstration that uses PhysX to simulate waves, waterfalls, and more. Here we are measuring the framerate in the demo’s benchmark mode.
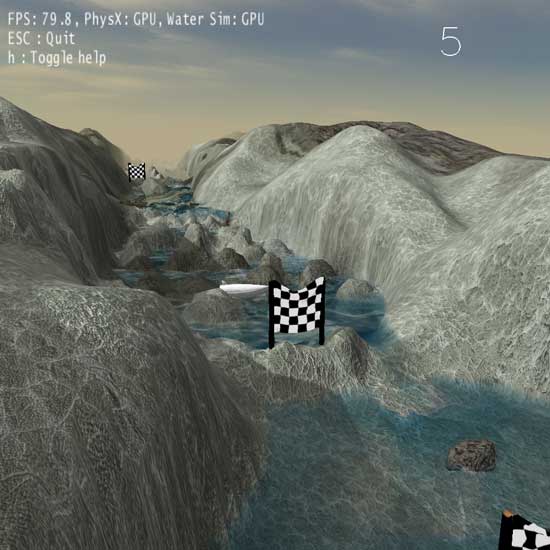
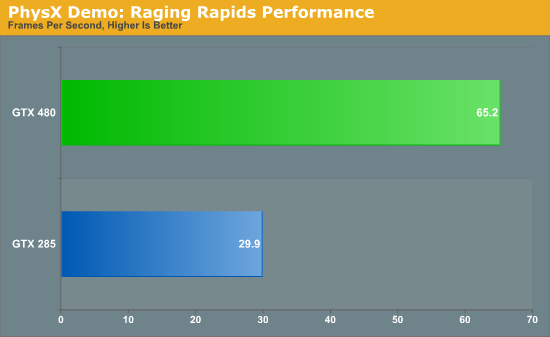
Overall the Raging Rapids benchmark gives us mixed results. Out of all of the benchmarks we have run on the GTX 480, this is one of the larger performance jumps over the GTX 285. On the other hand, once we compensate for the GTX 480’s additional shaders, we end up with a result only around 10% faster than a strict doubling in performance. This is a sign of good scaling, but it isn’t a sign that the GTX 480 is significantly faster than the GTX 285 due to more efficient use of compute resources. Just having all of this extra compute power is certainly going to make a difference overall, but on an architectural level the GTX 480 doesn’t look to be significantly faster at PhysX than the GTX 285 on a per-clock/per-shader basis.


196 Comments
View All Comments
Saiko Kila - Sunday, March 28, 2010 - link
These MSRPs are not entirely, I mean historically correct... The first MSRP (list price) for HD 5850 was $259, and that was price you had to pay when buying on sites like newegg (there were some rebates, and some differences depending on manufacturer, but still you had to have a very potent hunting sense to get a card of any manufacturer, I got lucky twice). Shortly after launch (about one month, it was October) the MSRP (set by AMD) hiked to $279 and problems with supply not only continued but even worsened. Now, since November 2009, it's $299. HD 5870 followed generally similar path, though HD 5850 hiked more, which is no wonder. Note that this is for reference design only, some manufacturers had higher MSRPs, after all AMD or nvidia sell only chips and not gaming cards.If you believe anandtech, here you've got a link, the day the cards were announced:
http://www.anandtech.com/video/showdoc.aspx?i=3643">http://www.anandtech.com/video/showdoc.aspx?i=3643
The whole pricing things with HD 5xxx series is quite unusual (though not unexpected) since normally you'd anticipate the street price to be quite lower than MSRP, and then to drop even further, and you would be right. I remember buying EVGA GTX260 just after its launch and the price was good $20 lower than suggested price. That's why we need more competition, and for now the outlook isn't very bright, with nvidia not quite delivering...
And these European prices - most if not all European countries have a heavy tax (VAT), this tax is always included and you have to pay it, there are other taxes too. In the US the sales tax is not included in the street price, and usually you can evade it after all (harder for Californians). Europeans usually get higher prices. Comparing US prices is thereby better, particularly in us dollars (most electronics deliveries are calculated in dollars in Europe). So the prices in the rest of the world were also boosted, even in Europe, despite weak dollar and other factors :)
One note - HD5xxx cards are really very big and most of them have very unfriendly location of power sockets, so you'd expect to pay more for a proper, huge case. Also note that if you have a 600 W PSU or so you'd be smarter to keep it and not upgrade, unless REALLY necessary. The lower load means lower efficiency, especially when plugged to 115V/60Hz grid. So if you have a bigger PSU you pay more for electricity. And it seems that more gamers are concerned with that bill than in any time before... You couldn't blame them for that and it's sad in its own way.
LuxZg - Tuesday, March 30, 2010 - link
Well, current MSRP is like I wrote it above. If there is no competition and/or demand is very high, prices always tend to go up. We're just lucky it's not happening often because in IT competition is usually very good.As for European prices, what do taxes have to do with it? We've got 23% taxes here, but it's included in all prices, so if nVidia goes up 23% so do AMD cards as well. If I'm looking at prices in the same country (and city, and sometimes store as well), and if nVidia is 300$ and ATI is 100 and 500, than I just can't compare them and say "hey, nVidia is faster than this 100$ ATI card, I?ll buy that"... no, you can't compare like that. Only thing you can do in that case is say something like "OK, so I have 300$ and fastest I can afford is nVidia" .. or "I want fastest there is, and I don't mind the cost" and you'll take HD5970 than. Or you can't afford any of those. So again, I don't get why cards in this review are so rigidly compared one to another as if they have exact same price (or +/- 10$ difference). And at one hand they compare MORE expensive nVidia card to QUITE CHEAPER AMD card, but won't compare that same nVidia card to a more expensive AMD card.. WHY?
And AMD cards are no bigger than nVidia ones, and last time I've checked bigger case is way way cheaper than a new PSU. And I'm running my computer on, get this, 450W PSU, so I'm not wasting any excessive power on inefficiences on low loads ;) And since this PSU keeps overclocked HD4890, it should work just fine with non-overclocked HD5870. While I'm pretty sure that GTX470 would already mean a new PSU, new PSU that costs ~100$/80€ .. So I'd pay more $ in total, and get a slower card.
Again, I'm not getting why there's such a rigid idea of GTX470=HD5850 & GTX480=HD5870 ..
LuxZg - Saturday, March 27, 2010 - link
Just re-read the conclusion.. something lacks in this sentence:"If you need the fastest thing you can get then the choice is clear, .."
Shouldn't it finish with "... choice is clear, HD5970..." ? That's what I'm saying, HD5970 wasn't mentioned in the entire conclusion. Past are the days of "single-GPU crown" .. That's just for nVidia to feel better. ATI Doesn't want "single GPU crown", they want the fastest graphics CARD. And they have it.. Serious lack in this article, serious.. And again, there is exact same amount of money dividing GTX480 and HD5870, as is between GTX480 and HD5970..
blindbox - Saturday, March 27, 2010 - link
I know this is going to take quite a bit of work, but can't you colour up the main cards and its competition in this review? By main cards, I mean GTX 470, 480 and 5850 and 5870. It's giving me a hard time to make comparison. I'm sure you guys did this before.. I think.It's funny how you guys only coloured the 480.
PS: I'm sorry for the spam, my comments are not appearing, and I'm sorry for replying to this guy when it is completely off topic, lol.
JarredWalton - Saturday, March 27, 2010 - link
Yes, it did take a bit of work, but I did it for Ryan. The HD 5870/5970 results are in orange and the 5850 is in red. It makes more of a difference on crowded graphs, but it should help pick out the new parts and their competition. I'm guessing Ryan did it to save time, because frankly the graphing engine is a pain in the butt. Thankfully, the new engine should be up and running in the near future. :-)Finally - Saturday, March 27, 2010 - link
Further improvement idea:Give the dual-chip/SLI cards also another colour tone.
lemonadesoda - Sunday, March 28, 2010 - link
No. Keep colouring simple. Just 3 or 4 colours max. More creates noise. If you need to highlight other results, colour the label, or circle or drop shadow or put a red * a the end.Just NO rainbow charts!
IceDread - Tuesday, March 30, 2010 - link
The article does not contain hd 5970 in CF. The article does not mention the hd 5970 at all under conclusion. This is really weird. It is my belief that anandtech has become pro nvidia and is no longer an objective site. Obejtivity is looking at performance + functionality / price. HD 5970 is a clear winner here. After all, who cares if a card has 1, 2 or 20 gpus? It's the performance / price that matters.Kegetys - Tuesday, March 30, 2010 - link
According to a test in legitreviews.com having two monitors attached to the card causes the idle power use to rise quite a bit, I guess the anand test is done with just one monitor attached? It would be nice to see power consumption numbers for dual monitor use as well, I dont mind high power use during load but if the card does not idle properly (with two monitors) then that is quite a showstopper.Ryan Smith - Wednesday, March 31, 2010 - link
I have a second monitor (albeit 1680) however I don't use it for anything except 3D Vision reviews. But if dual monitor power usage is going to become an issue, it may be prudent to start including that.