Intel's X25-V & Kingston's 30GB SSDNow V Series: Battle of the $125 SSDs
by Anand Lal Shimpi on March 19, 2010 12:00 AM EST- Posted in
- Storage
AnandTech Storage Bench
Note that our 6Gbps controller driver isn't supported by our custom storage bench here, so the C300 results are only offered in 3Gbps mode.
The first in our benchmark suite is a light usage case. The Windows 7 system is loaded with Firefox, Office 2007 and Adobe Reader among other applications. With Firefox we browse web pages like Facebook, AnandTech, Digg and other sites. Outlook is also running and we use it to check emails, create and send a message with a PDF attachment. Adobe Reader is used to view some PDFs. Excel 2007 is used to create a spreadsheet, graphs and save the document. The same goes for Word 2007. We open and step through a presentation in PowerPoint 2007 received as an email attachment before saving it to the desktop. Finally we watch a bit of a Firefly episode in Windows Media Player 11.
There’s some level of multitasking going on here but it’s not unreasonable by any means. Generally the application tasks proceed linearly, with the exception of things like web browsing which may happen in between one of the other tasks.
The recording is played back on all of our drives here today. Remember that we’re isolating disk performance, all we’re doing is playing back every single disk access that happened in that ~5 minute period of usage. The light workload is composed of 37,501 reads and 20,268 writes. Over 30% of the IOs are 4KB, 11% are 16KB, 22% are 32KB and approximately 13% are 64KB in size. Less than 30% of the operations are absolutely sequential in nature. Average queue depth is 6.09 IOs.
The performance results are reported in average I/O Operations per Second (IOPS):
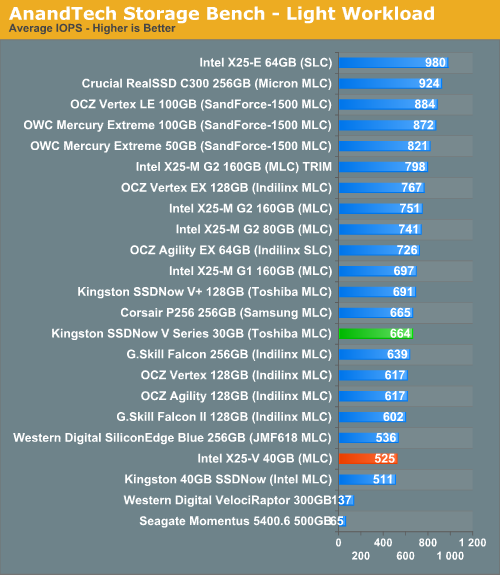
Intel's X25-V performs virtually identically to the older Kingston 40GB Boot Drive. The new 30GB drive does have the advantage though, performing much more like an Indilinx drive than a scaled down X25-M thanks to its higher sequential write speed.
If there’s a light usage case there’s bound to be a heavy one. In this test we have Microsoft Security Essentials running in the background with real time virus scanning enabled. We also perform a quick scan in the middle of the test. Firefox, Outlook, Excel, Word and Powerpoint are all used the same as they were in the light test. We add Photoshop CS4 to the mix, opening a bunch of 12MP images, editing them, then saving them as highly compressed JPGs for web publishing. Windows 7’s picture viewer is used to view a bunch of pictures on the hard drive. We use 7-zip to create and extract .7z archives. Downloading is also prominently featured in our heavy test; we download large files from the Internet during portions of the benchmark, as well as use uTorrent to grab a couple of torrents. Some of the applications in use are installed during the benchmark, Windows updates are also installed. Towards the end of the test we launch World of Warcraft, play for a few minutes, then delete the folder. This test also takes into account all of the disk accesses that happen while the OS is booting.
The benchmark is 22 minutes long and it consists of 128,895 read operations and 72,411 write operations. Roughly 44% of all IOs were sequential. Approximately 30% of all accesses were 4KB in size, 12% were 16KB in size, 14% were 32KB and 20% were 64KB. Average queue depth was 3.59.
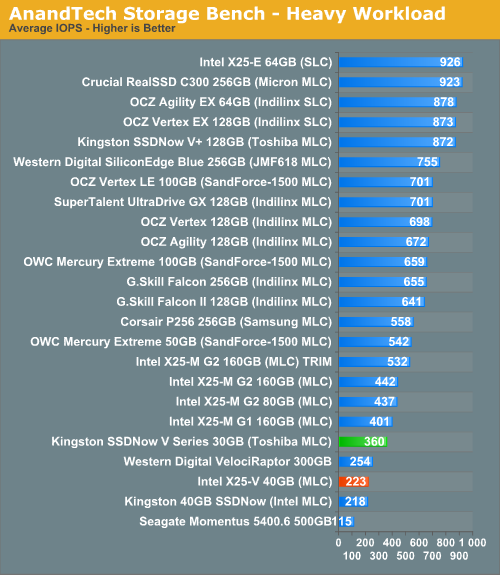
Crank up the sequential writes and Kingston's lead grows. The 30GB V series drive almost performs like an X25-M G1 in this case. The X25-V on the other hand performs more like a low latency VelociRaptor. Still better than a hard drive, but don't expect to copy files any faster.
The gaming workload is made up of 75,206 read operations and only 4,592 write operations. Only 20% of the accesses are 4KB in size, nearly 40% are 64KB and 20% are 32KB. A whopping 69% of the IOs are sequential, meaning this is predominantly a sequential read benchmark. The average queue depth is 7.76 IOs.
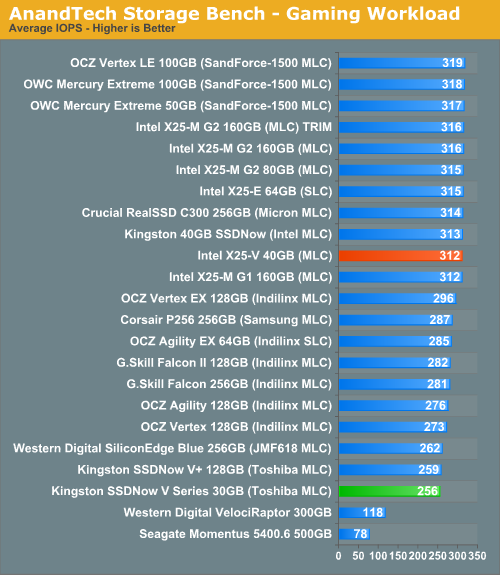
With both Intel and Kingston equal in sequential read performance, the differentiating factor here is strictly random read performance where the X25-V has the edge.


78 Comments
View All Comments
Taft12 - Saturday, March 20, 2010 - link
A few hundredths of a second - $1000 well spent!!!semo - Friday, March 19, 2010 - link
wow am i seeing <2mb/s sequential write speed on those drives? it must be an error i'm pretty sure that SD cards can do better than thatsamspqr - Friday, March 19, 2010 - link
there's a 4 on the other side of the axis: it's 41mb/sQChronoD - Friday, March 19, 2010 - link
That is annoying...Hey Anand (or TWIMC)
Isn't there a way for your pretty graph program to move the text to right of the bar if there isn't enough room for the label to fit? It's really annoying when you can't read half of the results because the super long product names are compressing the graph...
icrf - Friday, March 19, 2010 - link
Agreed, it is pretty annoying. What is used to generate these graphs? A third party tool or something in house? What language/what tool?Taft12 - Saturday, March 20, 2010 - link
I remember one of the other regular contributers mentioning that getting the graphs to look nice is not trivial, and I've had the same experience trying to accomplish the same.Of course, if the bar is so small you can't see the number, it doesn't really matter what the number is, the result is dismal.
Anand Lal Shimpi - Friday, March 19, 2010 - link
It's an automated system that unfortunately doesn't handle that case very well. We're launching the new site in a few weeks and we'll be updating the graph styles as well, so I'm going to try to get that fix in there :)Take care,
Anand
fless - Friday, March 19, 2010 - link
You can change the location of those labels in swiff chart pro. Right click on the number then select single label. You're too lazy.samspqr - Friday, March 19, 2010 - link
hisome time ago, 3dprofessor found that swapping a standard HDD for a WD velociraptor increased rendering performance by a sizeable 10%
http://www.3dprofessor.org/Reviews%20Folder%20Page...">http://www.3dprofessor.org/Reviews%20Folder%20Page...
in fact, I'm pretty sure in the core2 times they got much bigger improvements on a dual-socket board, but I can't find that review anymore
you also do rendering tests on your CPU reviews
could you test rendering performance of some standard 7200 drive, vs the velociraptor, vs a low-end SSD, vs a high end SSD? with your new gulftown, perhaps?
thanks
AnnonymousCoward - Saturday, March 20, 2010 - link
Anand stopped benchmarking SSDs in ways that pertain to real life long ago. http://tinyurl.com/ylflfao">http://tinyurl.com/ylflfao