Intel's X25-V & Kingston's 30GB SSDNow V Series: Battle of the $125 SSDs
by Anand Lal Shimpi on March 19, 2010 12:00 AM EST- Posted in
- Storage
Overall System Performance using PCMark Vantage
Next up is PCMark Vantage, another system-wide performance suite. For those of you who aren’t familiar with PCMark Vantage, it ends up being the most real-world-like hard drive test I can come up with. It runs things like application launches, file searches, web browsing, contacts searching, video playback, photo editing and other completely mundane but real-world tasks. I’ve described the benchmark in great detail before but if you’d like to read up on what it does in particular, take a look at Futuremark’s whitepaper on the benchmark; it’s not perfect, but it’s good enough to be a member of a comprehensive storage benchmark suite. Any performance impacts here would most likely be reflected in the real world.
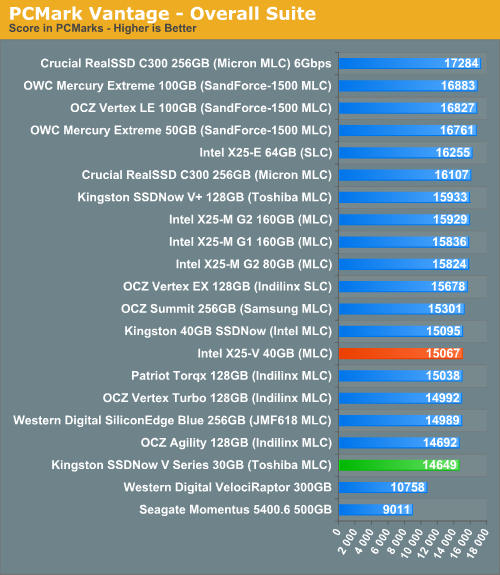
The Intel and Kingston value drives manage to stay close throughout almost all of the PCMark benchmarks. In the Productivity and HDD tests Intel manages to pull ahead by a noticeable margin however.
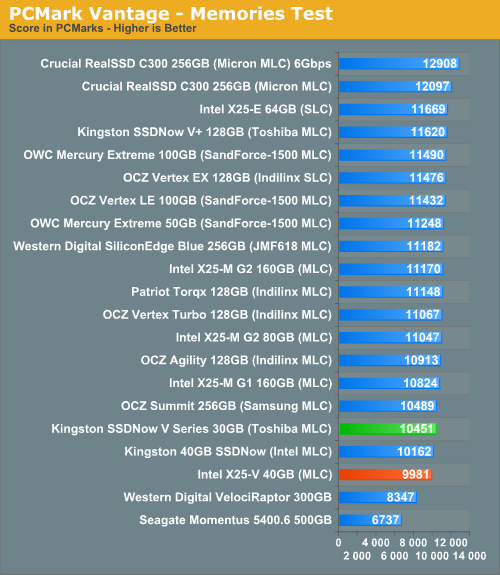
The memories suite includes a test involving importing pictures into Windows Photo Gallery and editing them, a fairly benign task that easily falls into the category of being very influenced by disk performance.
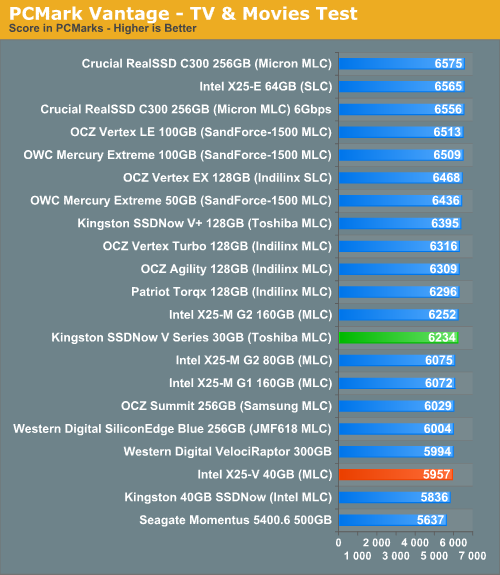
The TV and Movies tests focus on on video transcoding which is mostly CPU bound, but one of the tests involves Windows Media Center which tends to be disk bound.
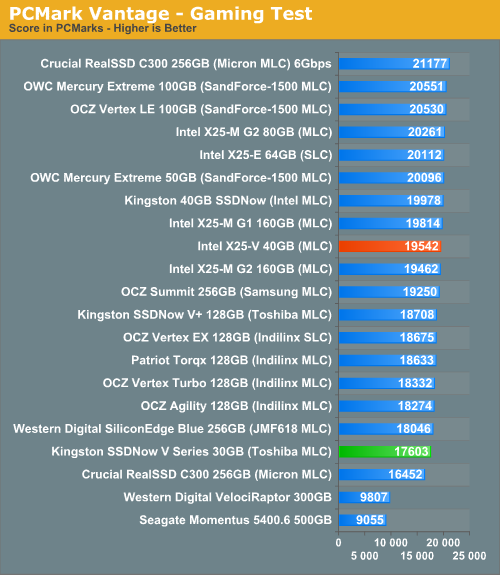
The gaming tests are very well suited to SSDs since they spend a good portion of their time focusing on reading textures and loading level data. All of the SSDs dominate here, but as you'll see later on in my gaming tests the benefits of an SSD really vary depending on the game. Take these results as a best case scenario of what can happen, not the norm.
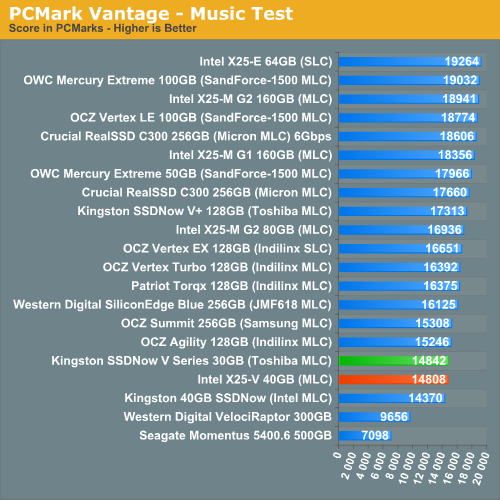
In the Music suite the main test is a multitasking scenario: the test simulates surfing the web in IE7, transcoding an audio file and adding music to Windows Media Player (the most disk intensive portion of the test).
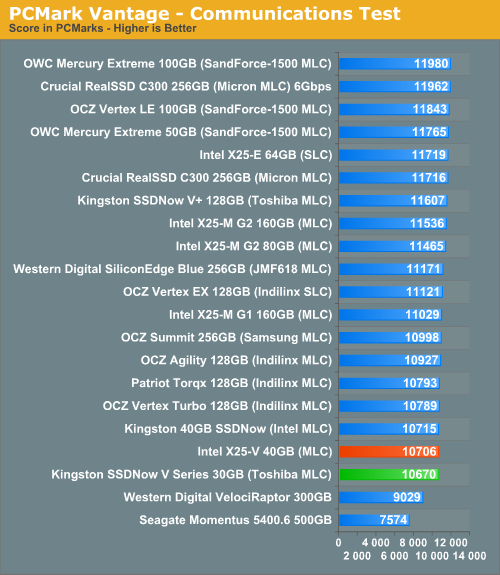
The Communications suite is made up of two tests, both involving light multitasking. The first test simulates data encryption/decryption while running message rules in Windows Mail. The second test simulates web surfing (including opening/closing tabs) in IE7, data decryption and running Windows Defender.
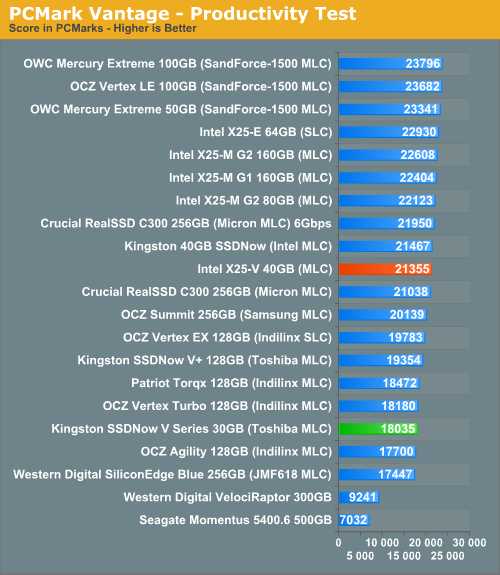
I love PCMark's Productivity test; in this test there are four tasks going on at once, searching through Windows contacts, searching through Windows Mail, browsing multiple webpages in IE7 and loading applications. This is as real world of a scenario as you get and it happens to be representative of one of the most frustrating HDD usage models - trying to do multiple things at once. There's nothing more annoying than trying to launch a simple application while you're doing other things in the background and have the load take forever.
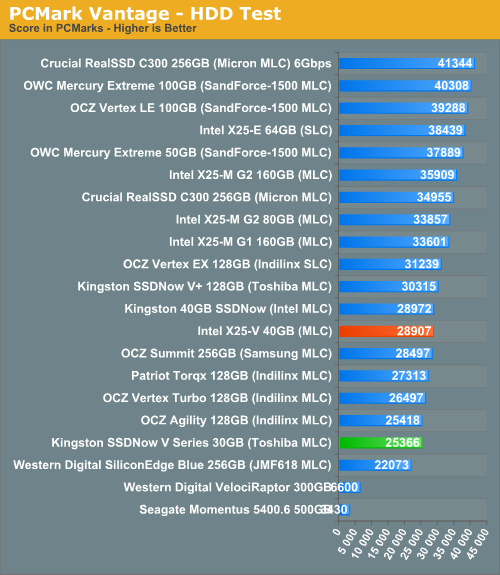
The final PCMark Vantage suite is HDD specific and this is where you'll see the biggest differences between the drives:


78 Comments
View All Comments
Taft12 - Saturday, March 20, 2010 - link
A few hundredths of a second - $1000 well spent!!!semo - Friday, March 19, 2010 - link
wow am i seeing <2mb/s sequential write speed on those drives? it must be an error i'm pretty sure that SD cards can do better than thatsamspqr - Friday, March 19, 2010 - link
there's a 4 on the other side of the axis: it's 41mb/sQChronoD - Friday, March 19, 2010 - link
That is annoying...Hey Anand (or TWIMC)
Isn't there a way for your pretty graph program to move the text to right of the bar if there isn't enough room for the label to fit? It's really annoying when you can't read half of the results because the super long product names are compressing the graph...
icrf - Friday, March 19, 2010 - link
Agreed, it is pretty annoying. What is used to generate these graphs? A third party tool or something in house? What language/what tool?Taft12 - Saturday, March 20, 2010 - link
I remember one of the other regular contributers mentioning that getting the graphs to look nice is not trivial, and I've had the same experience trying to accomplish the same.Of course, if the bar is so small you can't see the number, it doesn't really matter what the number is, the result is dismal.
Anand Lal Shimpi - Friday, March 19, 2010 - link
It's an automated system that unfortunately doesn't handle that case very well. We're launching the new site in a few weeks and we'll be updating the graph styles as well, so I'm going to try to get that fix in there :)Take care,
Anand
fless - Friday, March 19, 2010 - link
You can change the location of those labels in swiff chart pro. Right click on the number then select single label. You're too lazy.samspqr - Friday, March 19, 2010 - link
hisome time ago, 3dprofessor found that swapping a standard HDD for a WD velociraptor increased rendering performance by a sizeable 10%
http://www.3dprofessor.org/Reviews%20Folder%20Page...">http://www.3dprofessor.org/Reviews%20Folder%20Page...
in fact, I'm pretty sure in the core2 times they got much bigger improvements on a dual-socket board, but I can't find that review anymore
you also do rendering tests on your CPU reviews
could you test rendering performance of some standard 7200 drive, vs the velociraptor, vs a low-end SSD, vs a high end SSD? with your new gulftown, perhaps?
thanks
AnnonymousCoward - Saturday, March 20, 2010 - link
Anand stopped benchmarking SSDs in ways that pertain to real life long ago. http://tinyurl.com/ylflfao">http://tinyurl.com/ylflfao