OCZ's Vertex 2 Pro Preview: The Fastest MLC SSD We've Ever Tested
by Anand Lal Shimpi on December 31, 2009 12:00 AM EST- Posted in
- Storage
AnandTech Storage Bench
I introduced our storage suite in our last SSD article and it’s back, now with more data :)
Of the MLC SSDs represented here, there’s just nothing faster than the SandForce based OCZ Vertex 2 Pro.
Intel’s SLC based X25-E actually does very well, especially for a controller that’s as old as it is. It is worth noting however that the only thing separating Intel from SandForce-level performance is the X25-M’s low sequential write speed...
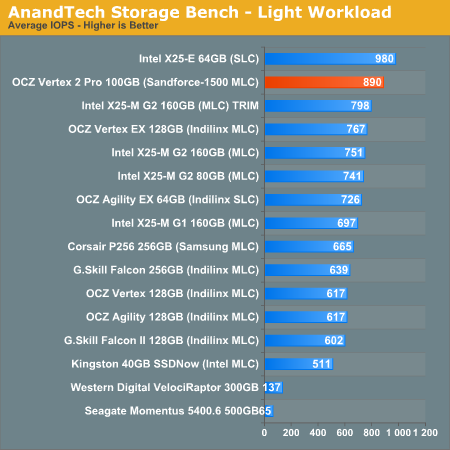
The first in our benchmark suite is a light usage case. The Windows 7 system is loaded with Firefox, Office 2007 and Adobe Reader among other applications. With Firefox we browse web pages like Facebook, AnandTech, Digg and other sites. Outlook is also running and we use it to check emails, create and send a message with a PDF attachment. Adobe Reader is used to view some PDFs. Excel 2007 is used to create a spreadsheet, graphs and save the document. The same goes for Word 2007. We open and step through a presentation in PowerPoint 2007 received as an email attachment before saving it to the desktop. Finally we watch a bit of a Firefly episode in Windows Media Player 11.
There’s some level of multitasking going on here but it’s not unreasonable by any means. Generally the application tasks proceed linearly, with the exception of things like web browsing which may happen in between one of the other tasks.
The recording is played back on all of our drives here today. Remember that we’re isolating disk performance, all we’re doing is playing back every single disk access that happened in that ~5 minute period of usage. The light workload is composed of 37,501 reads and 20,268 writes. Over 30% of the IOs are 4KB, 11% are 16KB, 22% are 32KB and approximately 13% are 64KB in size. Less than 30% of the operations are absolutely sequential in nature. Average queue depth is 6.09 IOs.
The performance results are reported in average I/O Operations per Second (IOPS):
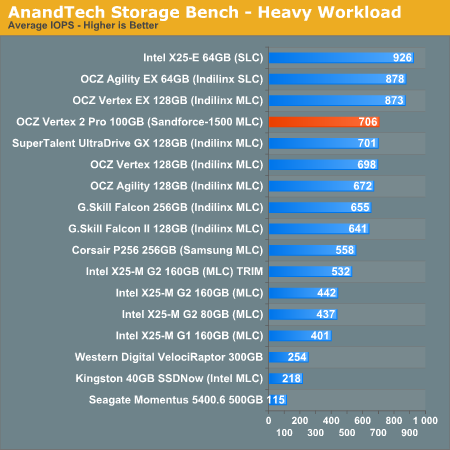
If there’s a light usage case there’s bound to be a heavy one. In this test we have Microsoft Security Essentials running in the background with real time virus scanning enabled. We also perform a quick scan in the middle of the test. Firefox, Outlook, Excel, Word and Powerpoint are all used the same as they were in the light test. We add Photoshop CS4 to the mix, opening a bunch of 12MP images, editing them, then saving them as highly compressed JPGs for web publishing. Windows 7’s picture viewer is used to view a bunch of pictures on the hard drive. We use 7-zip to create and extract .7z archives. Downloading is also prominently featured in our heavy test; we download large files from the Internet during portions of the benchmark, as well as use uTorrent to grab a couple of torrents. Some of the applications in use are installed during the benchmark, Windows updates are also installed. Towards the end of the test we launch World of Warcraft, play for a few minutes, then delete the folder. This test also takes into account all of the disk accesses that happen while the OS is booting.
The benchmark is 22 minutes long and it consists of 128,895 read operations and 72,411 write operations. Roughly 44% of all IOs were sequential. Approximately 30% of all accesses were 4KB in size, 12% were 16KB in size, 14% were 32KB and 20% were 64KB. Average queue depth was 3.59.
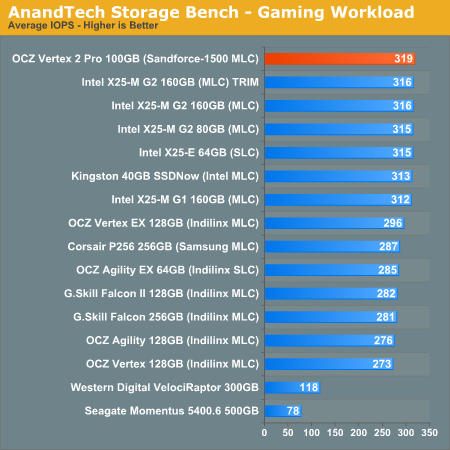
Our final test focuses on actual gameplay in four 3D games: World of Warcraft, Batman: Arkham Asylum, FarCry 2 and Risen, in that order. The games are launched and played, altogether for a total of just under 30 minutes. The benchmark measures game load time, level load time, disk accesses from save games and normal data streaming during gameplay.
The gaming workload is made up of 75,206 read operations and only 4,592 write operations. Only 20% of the accesses are 4KB in size, nearly 40% are 64KB and 20% are 32KB. A whopping 69% of the IOs are sequential, meaning this is predominantly a sequential read benchmark. The average queue depth is 7.76 IOs.


100 Comments
View All Comments
Anand Lal Shimpi - Friday, January 1, 2010 - link
Correct. Highly Random and highly compressed data will not work well with SandForce's current algorithm. Less than 25% of the writes you'll see on a typical desktop machine are random writes, even then they aren't random over 100% of the LBA space. I'm not sure how well the technology works for highly random server workloads (SF claims it's great), but for the desktop user it appears to be perfect.Take care,
Anand
shawkie - Friday, January 1, 2010 - link
Thinking about this further I've come to the conclusion that the files must be divided into small blocks that are compressed independently. Firstly because the disk doesn't know about files (only sectors) and secondly because its the only way you could modify a small part of a compressed file quickly. I don't think 512 bytes would be big enough to acheive respectable compression ratios so I think 4KB is more likely. This might explain why Seagate are pushing to make 4KB the smallest addressable unit for storage devices. So then they take each 4KB block, compress it, and write it to the next available space in flash. If they use 64 bit pointers to store the location of each 4KB block they could easily address the entire space with single-bit granularity. Of course, every overwrite will result in a bit of irregularly sized free space. They could then just wait for a bit of compressed data that happens to fit perfectly or implement some kind of free space consolidation or a combination. I'm starting to come around to the idea.shawkie - Friday, January 1, 2010 - link
Apologies to Anand, I completely missed the page titled "SandForce's Achilles' Heel". I do think there are some scenarios that still need testing though. What happens when a small modification has to be made to a large file that the drive has decided to compress? Not an easy thing to benchmark but something I can imagine might apply when editing uncompressed audio files or some video files. The other question is what happens when the disk is made dirty by overwriting several times using a random write pattern and random data. What is the sequential write speed like after that?lesherm - Friday, January 1, 2010 - link
with a Seinfeld reference.LTG - Friday, January 1, 2010 - link
Definitely the only one with a Seinfeld and a Metallica and a StarWars reference :).Sponge Worthy
Enter the Sandforce
Use the Sandforce
GullLars - Thursday, December 31, 2009 - link
It seems anand has a problem with identifying the 4KB random performance of the drives.Intel x25-M has time and time again been shown to deliver 120MB/s or more 4KB random read bandwidth. x25-E delivers in the area of 150MB/s random read and 200MB/s of random write at 4KB packet sizes for queue depth of 10 and above.
I do not know if the problem is due to testing not being done in AHCI/RAID mode, or if it is because of a queue depth lower than number of internal flash channels, but these numbers are purely WRONG and misrepresentative. I probably shouldn't post while drunk :P but this upsets me enough to disregard that.
Anandtech is IMO a site too good to post nonsensical data like this, pleese fix it ASAP. If you choose to sensor my post after fixing it, pleese mail me notifying me of it in case i don't remmeber posting.
Anand Lal Shimpi - Friday, January 1, 2010 - link
My 4KB read/write tests are run with a queue depth of 3 to represent a desktop usage scenario. I can get much higher numbers out of the X25-M at higher queue depths but then these tests stop being useful for desktop/notebook users. I may add server-like iometer workloads in the future though.All of our testing is done in non-member RAID mode.
Take care,
Anand
GullLars - Friday, January 1, 2010 - link
Thank you for the response, but i still feel the need to point out that posting 4KB random numbers for queue depth 3 should be explicitly pointed out, as this only utilizes less than 1/3 of the flash channels in the x25-M. Here is a graph i made of the 4KB random read IOPS numbers of an x25-M by queue depth: http://www.diskusjon.no/index.php?act=attach&t...">http://www.diskusjon.no/index.php?act=attach&t...As shown in this graph, the performance scales well up to a queue depth of about 12, where the 10 internal channels get saturated with requests.
A queue depth of 3 may be representative for average light load running windows, but during operations like launching programs, booting windows, or certain operations whitin programs that read database listings, the momentary queue depths often spike to 16-64, and it is in theese circumstances you really feel the IOPS performance of a drive. This is one of the reasons why x25-M beats the competition in the application launch test in PCmark vantage despite having the same IOPS performance at queue depths 1-4 and about the same sequential performance.
The sandforce SF-1500 controller is rated for 30.000 4KB random IOPS, 120MB/s. In order to reach these read performance numbers with MLC flash, you need at least 6 channels, with corresponding outstanding IO's to make use of them. Then you also need to take into account controller overhead. The SF-1500 controller has 16 channels, and the SF-1200 controller has 8 channels.
To test IOPS performance of a drive (not enterpreted for usage but raw numbers), outstanding IOs should be at least equal to number of channels.
Anand Lal Shimpi - Friday, January 1, 2010 - link
I'm not sure I agree with you here:"A queue depth of 3 may be representative for average light load running windows, but during operations like launching programs, booting windows, or certain operations whitin programs that read database listings, the momentary queue depths often spike to 16-64,"
I did a lot of tests before arriving at the queue depth of 3 and found that even in the most ridiculous desktop usage scenarios we never saw anything in the double digits. It didn't matter whether you were launching programs in parallel or doing a lot of file copies while you were interacting with apps. Even our heavy storage bench test had an average queue depth below 4.
Take care,
Anand
GullLars - Saturday, January 2, 2010 - link
I'm not out to be difficult here, so i will let it be after this, but what i and a few others who have been doing SSD benchmarking for about a year now have found using the windows performance monitor indicates Queue Depth spikes in the area of 16-64 outstanding IO's when launching apps, and certain other interactions with apps that cause reading of many database entries.Copying files will only create 1 outstanding sequential IO-queue, and does not contribute significantly to the momentary queue depth during short high loads.
Scanning for viruses may contribute more to the queue depth, but i have not tested it this far.
At a queue depth of 1-4 for purely reads, there is little difference between JMicron, Indilinx, Samsung, Mtron, and Intel based SSDs, and the difference seen in PCmark Vantage applauch test and real world tests of "launch scripts" (a script launching all programs installed on the computer simultaneously) also indicate there is a notable difference. Some of this may be caused by different random write performance and sequential read, but queue depths above 4 in bursts help explain why x25-M with the 10-channel design beats the competing 4-channel controllers in this type of workload even when sequential read is about the same.
I also like to think Intel didn't make a complex 10-channel "M" drive optimized for 4KB random IOPS targeted at consumers only to win in benchmarks. If the queue depth truly never went above 3-5, even when counting bursts, there would have been wasted a ridiculus amount of effort and resources in making the x25-M, as a 4-channel drive would be a lot cheaper to develop and produce.
Thanks for taking the time to reply to my posts, and i hope you know i value the SSD articles posted on this site. My only concern has been the queue depths used for performance rating, and a concern for the future is that the current setup does not forward TRIM to drives supporting it.