OCZ's Vertex 2 Pro Preview: The Fastest MLC SSD We've Ever Tested
by Anand Lal Shimpi on December 31, 2009 12:00 AM EST- Posted in
- Storage
PCMark Vantage - A New Leader
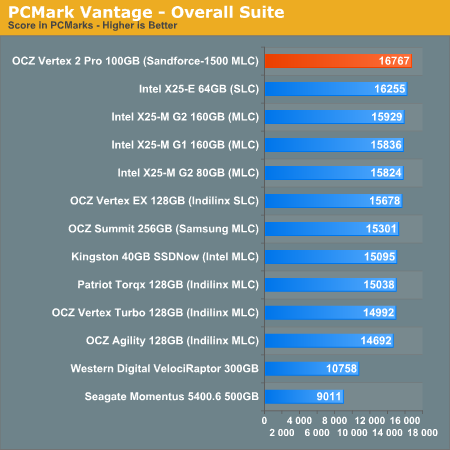
The Vertex 2 Pro’s dominance doesn’t stop in the synthetic tests - we have a new winner in PCMark Vantage.
While I don’t like Vantage much as a CPU benchmark, it is one of the best real world indicators of SSD performance. Far better than a lot of the synthetic tests that are used by most. Performance in Vantage isn’t all that matters, but as a part of a suite it’s very important.
Luckily for OCZ and SandForce, the Vertex 2 Pro doesn’t disappoint here either. As a testament to how much they have their act together, I didn’t have to tell SandForce what their Vantage scores were - they already use it as a part of their internal test suite. This is in stark contrast to other newcomers to the SSD market that were surprised when I told them that their drives don’t perform well in the real world.
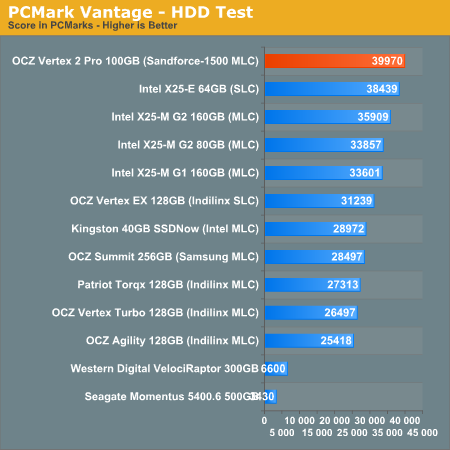
The Vertex 2 Pro is 6% faster than the X25-M G2 in the overall PCMark Vantage test and 12% faster in the HDD specific suite. It’s at the borderline for what’s noticeable in the real world for most users but the advantage is there.
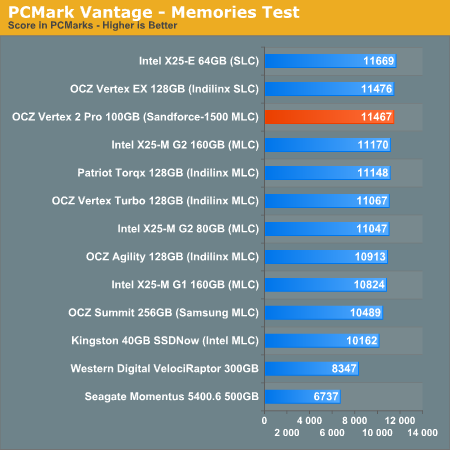
The memories suite includes a test involving importing pictures into Windows Photo Gallery and editing them, a fairly benign task that easily falls into the category of being very influenced by disk performance.
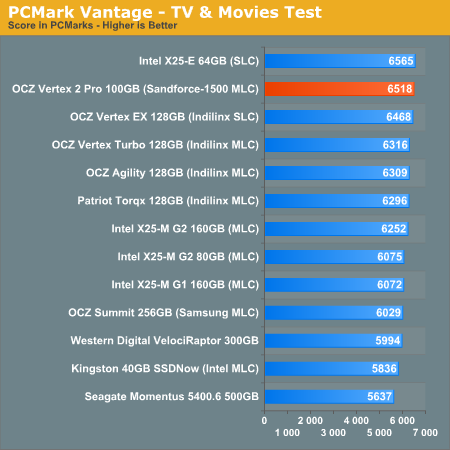
The TV and Movies tests focus on on video transcoding which is mostly CPU bound, but one of the tests involves Windows Media Center which tends to be disk bound.
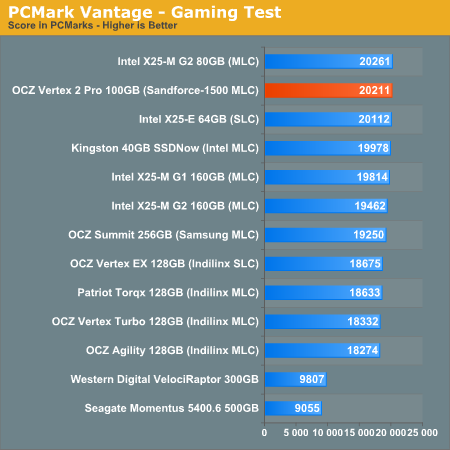
The gaming tests are very well suited to SSDs since they spend a good portion of their time focusing on reading textures and loading level data. All of the SSDs dominate here, but as you'll see later on in my gaming tests the benefits of an SSD really vary depending on the game. Take these results as a best case scenario of what can happen, not the norm.
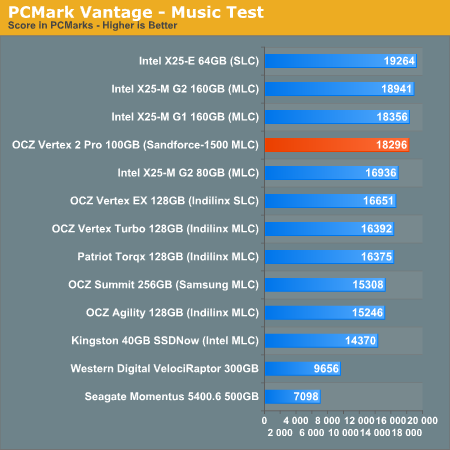
In the Music suite the main test is a multitasking scenario: the test simulates surfing the web in IE7, transcoding an audio file and adding music to Windows Media Player (the most disk intensive portion of the test).
The Communications suite is made up of two tests, both involving light multitasking. The first test simulates data encryption/decryption while running message rules in Windows Mail. The second test simulates web surfing (including opening/closing tabs) in IE7, data decryption and running Windows Defender.

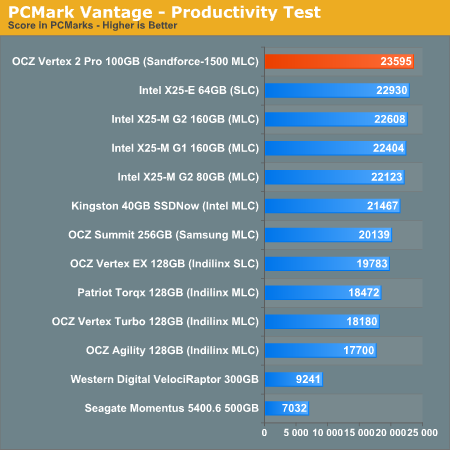
I love PCMark's Productivity test; in this test there are four tasks going on at once, searching through Windows contacts, searching through Windows Mail, browsing multiple webpages in IE7 and loading applications. This is as real world of a scenario as you get and it happens to be representative of one of the most frustrating HDD usage models - trying to do multiple things at once. There's nothing more annoying than trying to launch a simple application while you're doing other things in the background and have the load take forever.
The final PCMark Vantage suite is HDD specific and this is where you'll see the biggest differences between the drives:


100 Comments
View All Comments
Anand Lal Shimpi - Friday, January 1, 2010 - link
Correct. Highly Random and highly compressed data will not work well with SandForce's current algorithm. Less than 25% of the writes you'll see on a typical desktop machine are random writes, even then they aren't random over 100% of the LBA space. I'm not sure how well the technology works for highly random server workloads (SF claims it's great), but for the desktop user it appears to be perfect.Take care,
Anand
shawkie - Friday, January 1, 2010 - link
Thinking about this further I've come to the conclusion that the files must be divided into small blocks that are compressed independently. Firstly because the disk doesn't know about files (only sectors) and secondly because its the only way you could modify a small part of a compressed file quickly. I don't think 512 bytes would be big enough to acheive respectable compression ratios so I think 4KB is more likely. This might explain why Seagate are pushing to make 4KB the smallest addressable unit for storage devices. So then they take each 4KB block, compress it, and write it to the next available space in flash. If they use 64 bit pointers to store the location of each 4KB block they could easily address the entire space with single-bit granularity. Of course, every overwrite will result in a bit of irregularly sized free space. They could then just wait for a bit of compressed data that happens to fit perfectly or implement some kind of free space consolidation or a combination. I'm starting to come around to the idea.shawkie - Friday, January 1, 2010 - link
Apologies to Anand, I completely missed the page titled "SandForce's Achilles' Heel". I do think there are some scenarios that still need testing though. What happens when a small modification has to be made to a large file that the drive has decided to compress? Not an easy thing to benchmark but something I can imagine might apply when editing uncompressed audio files or some video files. The other question is what happens when the disk is made dirty by overwriting several times using a random write pattern and random data. What is the sequential write speed like after that?lesherm - Friday, January 1, 2010 - link
with a Seinfeld reference.LTG - Friday, January 1, 2010 - link
Definitely the only one with a Seinfeld and a Metallica and a StarWars reference :).Sponge Worthy
Enter the Sandforce
Use the Sandforce
GullLars - Thursday, December 31, 2009 - link
It seems anand has a problem with identifying the 4KB random performance of the drives.Intel x25-M has time and time again been shown to deliver 120MB/s or more 4KB random read bandwidth. x25-E delivers in the area of 150MB/s random read and 200MB/s of random write at 4KB packet sizes for queue depth of 10 and above.
I do not know if the problem is due to testing not being done in AHCI/RAID mode, or if it is because of a queue depth lower than number of internal flash channels, but these numbers are purely WRONG and misrepresentative. I probably shouldn't post while drunk :P but this upsets me enough to disregard that.
Anandtech is IMO a site too good to post nonsensical data like this, pleese fix it ASAP. If you choose to sensor my post after fixing it, pleese mail me notifying me of it in case i don't remmeber posting.
Anand Lal Shimpi - Friday, January 1, 2010 - link
My 4KB read/write tests are run with a queue depth of 3 to represent a desktop usage scenario. I can get much higher numbers out of the X25-M at higher queue depths but then these tests stop being useful for desktop/notebook users. I may add server-like iometer workloads in the future though.All of our testing is done in non-member RAID mode.
Take care,
Anand
GullLars - Friday, January 1, 2010 - link
Thank you for the response, but i still feel the need to point out that posting 4KB random numbers for queue depth 3 should be explicitly pointed out, as this only utilizes less than 1/3 of the flash channels in the x25-M. Here is a graph i made of the 4KB random read IOPS numbers of an x25-M by queue depth: http://www.diskusjon.no/index.php?act=attach&t...">http://www.diskusjon.no/index.php?act=attach&t...As shown in this graph, the performance scales well up to a queue depth of about 12, where the 10 internal channels get saturated with requests.
A queue depth of 3 may be representative for average light load running windows, but during operations like launching programs, booting windows, or certain operations whitin programs that read database listings, the momentary queue depths often spike to 16-64, and it is in theese circumstances you really feel the IOPS performance of a drive. This is one of the reasons why x25-M beats the competition in the application launch test in PCmark vantage despite having the same IOPS performance at queue depths 1-4 and about the same sequential performance.
The sandforce SF-1500 controller is rated for 30.000 4KB random IOPS, 120MB/s. In order to reach these read performance numbers with MLC flash, you need at least 6 channels, with corresponding outstanding IO's to make use of them. Then you also need to take into account controller overhead. The SF-1500 controller has 16 channels, and the SF-1200 controller has 8 channels.
To test IOPS performance of a drive (not enterpreted for usage but raw numbers), outstanding IOs should be at least equal to number of channels.
Anand Lal Shimpi - Friday, January 1, 2010 - link
I'm not sure I agree with you here:"A queue depth of 3 may be representative for average light load running windows, but during operations like launching programs, booting windows, or certain operations whitin programs that read database listings, the momentary queue depths often spike to 16-64,"
I did a lot of tests before arriving at the queue depth of 3 and found that even in the most ridiculous desktop usage scenarios we never saw anything in the double digits. It didn't matter whether you were launching programs in parallel or doing a lot of file copies while you were interacting with apps. Even our heavy storage bench test had an average queue depth below 4.
Take care,
Anand
GullLars - Saturday, January 2, 2010 - link
I'm not out to be difficult here, so i will let it be after this, but what i and a few others who have been doing SSD benchmarking for about a year now have found using the windows performance monitor indicates Queue Depth spikes in the area of 16-64 outstanding IO's when launching apps, and certain other interactions with apps that cause reading of many database entries.Copying files will only create 1 outstanding sequential IO-queue, and does not contribute significantly to the momentary queue depth during short high loads.
Scanning for viruses may contribute more to the queue depth, but i have not tested it this far.
At a queue depth of 1-4 for purely reads, there is little difference between JMicron, Indilinx, Samsung, Mtron, and Intel based SSDs, and the difference seen in PCmark Vantage applauch test and real world tests of "launch scripts" (a script launching all programs installed on the computer simultaneously) also indicate there is a notable difference. Some of this may be caused by different random write performance and sequential read, but queue depths above 4 in bursts help explain why x25-M with the 10-channel design beats the competing 4-channel controllers in this type of workload even when sequential read is about the same.
I also like to think Intel didn't make a complex 10-channel "M" drive optimized for 4KB random IOPS targeted at consumers only to win in benchmarks. If the queue depth truly never went above 3-5, even when counting bursts, there would have been wasted a ridiculus amount of effort and resources in making the x25-M, as a 4-channel drive would be a lot cheaper to develop and produce.
Thanks for taking the time to reply to my posts, and i hope you know i value the SSD articles posted on this site. My only concern has been the queue depths used for performance rating, and a concern for the future is that the current setup does not forward TRIM to drives supporting it.