The SSD Improv: Intel & Indilinx get TRIM, Kingston Brings Intel Down to $115
by Anand Lal Shimpi on November 17, 2009 7:00 PM EST- Posted in
- Storage
Introducing the AnandTech Storage Bench - Real World Performance Testing
Finding good, real world, storage benchmarks is next to impossible. The synthetic tests work up to a certain point but you need real world examples. Measuring performance in individual applications often ends up with charts like these where all of the drives perform identically. Benchmark suites like PCMark Vantage are the best we can do, but they are a bit too easy on these drives in my opinion and while representative of a real world environment, they aren’t necessarily representative of all real world environments.
Recently we’ve been able to get our hands on a piece of software that allows us to record all disk activity on a machine and then play it back on any other machine. The point is that we can now model a real world usage scenario without waiting for BAPCo or Futuremark to do it for us.
Our benchmarks debut here, today, and we’re starting with three. We haven’t had time to run all of the SSDs through this new suite so we’ll start with an abridged list.
The first in our new benchmark suite is a light usage case. The Windows 7 system is loaded with Firefox, Office 2007 and Adobe Reader among other applications. With Firefox we browse web pages like Facebook, AnandTech, Digg and other sites. Outlook is also running and we use it to check emails, create and send a message with a PDF attachment. Adobe Reader is used to view some PDFs. Excel 2007 is used to create a spreadsheet, graphs and save the document. The same goes for Word 2007. We open and step through a presentation in PowerPoint 2007 received as an email attachment before saving it to the desktop. Finally we watch a bit of a Firefly episode in Windows Media Player 11.
There’s some level of multitasking going on here but it’s not unreasonable by any means. Generally the application tasks proceed linearly, with the exception of things like web browsing which may happen in between one of the other tasks.
The recording is played back on all of our drives here today. Remember that we’re isolating disk performance, all we’re doing is playing back every single disk access that happened in that ~5 minute period of usage. The light trace is composed of 37,501 reads and 20,268 writes. Over 30% of the IOs are 4KB, 11% are 16KB, 22% are 32KB and approximately 13% are 64KB in size. Less than 30% of the operations are absolutely sequential in nature. Average queue depth is 6.09 IOs.
The performance results are reported in I/O Operations per Second (IOPS):
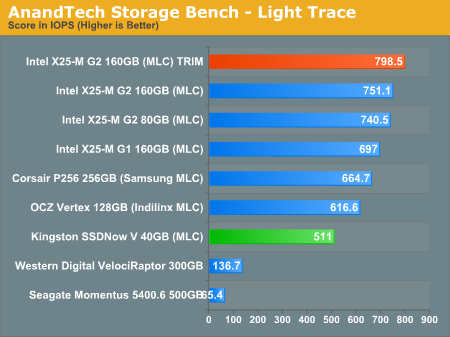
The hard drives set the minimum level of expectations here, the VelociRaptor only manages 137 IOPS. The fastest SSD is the X25-M G2 with the TRIM firmware installed at nearly 800 IOPS. The improvement over the older firmware is 6.25% thanks to the higher sequential write speed. The G2 is a bit faster than the G1 here, but what’s most interesting is how well the competing SSDs do.
Corsair’s P256 based on the Samsung RBX controller is very close to the performance of Intel’s X25-M G1 at 664 IOPS. It even outperforms the Indilinx MLC based OCZ Vertex by around 8%.
The Kingston 40GB drive is hampered by its small amount of free space. The actual benchmark takes up around 33GB of space, leaving very little breathing room for the baby SSD. That being said, the hopefully $85 bugger is nearly 4x the speed of a VelociRaptor.
If there’s a light usage case there’s bound to be a heavy one. In this test we have Microsoft Security Essentials running in the background with real time virus scanning enabled. We also perform a quick scan in the middle of the test. Firefox, Outlook, Excel, Word and Powerpoint are all used the same as they were in the light test. We add Photoshop CS4 to the mix, opening a bunch of 12MP images, editing them, then saving them as highly compressed JPGs for web publishing. Windows 7’s picture viewer is used to view a bunch of pictures on the hard drive. We use 7-zip to create and extract .7z archives. Downloading is also prominently featured in our heavy test; we download large files from the Internet during portions of the benchmark, as well as use uTorrent to grab a couple of torrents. Some of the applications in use are installed during the benchmark, Windows updates are also installed. Towards the end of the test we launch World of Warcraft, play for a few minutes, then delete the folder. This test also takes into account all of the disk accesses that happen while the OS is booting.
The benchmark is 22 minutes long and it consists of 128,895 read operations and 72,411 write operations. Roughly 44% of all IOs were sequential. Approximately 30% of all accesses were 4KB in size, 12% were 16KB in size, 14% were 32KB and 20% were 64KB. Average queue depth was 3.59.
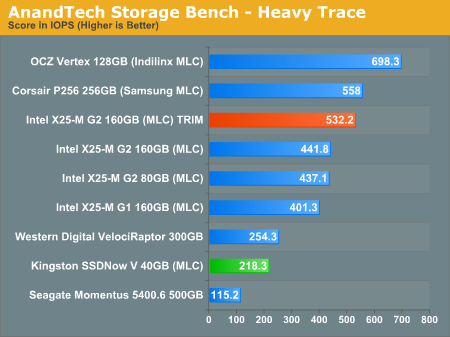
While I appreciate that Intel improved sequential write speed a bit in the 160GB G2 drives, the heavy trace results show us that it’s not enough. The improvement to the 160GB G2 is tremendous, over 20%. But that only brings the 160GB G2 up to the performance of the Corsair P256 (Samsung RBX). The real winner here is the Indilinx based OCZ Vertex. At nearly 700 IOPS it has the right balance of random and sequential read/write speed for our heavy usage scenario. To quote from the Relapse:
“When I started writing this article I took a big step. I felt that Indilinx drives had reached the point that their performance was good enough to be considered an Intel alternative. I backed up my X25-M, pulled it out, and swapped in an OCZ Vertex drive - into my personal work system. I've been using it ever since and I must admit, I am happy. Indilinx has done it, these drives are fast, reliable (provided that you don't upgrade to the latest firmware without waiting a while) and are good enough.”
This is more than good enough, this is faster than Intel.
Unfortunately Intel has assured me that there’s no additional write speed left on the table for the X25-M G2. We’ll have to wait for the G3 next year to see that addressed.
Kingston’s very low sequential write speed hurts it the most here, the drive actually delivers performance lower than that of a VelociRaptor (although not by much). To be honest, this is a bit of an unfair test for the 40GB drive. It’s far too intense for what would ultimately be an apps/OS drive, but it does highlight the 40GB drive's weakpoints.
Our final test focuses on actual gameplay in four 3D games: World of Warcraft, Batman: Arkham Asylum, FarCry 2 and Risen, in that order. The games are launched and played, altogether for a total of just under 30 minutes. The benchmark measures game load time, level load time, disk accesses from save games and normal data streaming during gameplay.
The gaming trace is made up of 75,206 read operations and only 4,592 write operations. Only 20% of the accesses are 4KB in size, nearly 40% are 64KB and 20% are 32KB. A whopping 69% of the IOs are sequential, meaning this is predominantly a sequential read benchmark. The average queue depth is 7.76 IOs.
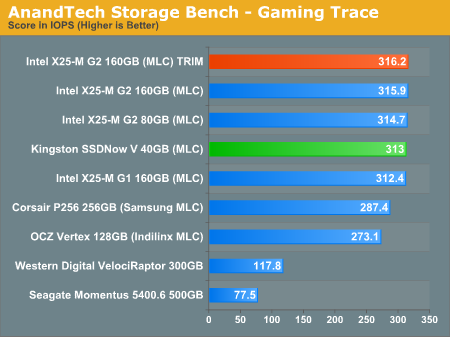
The gaming test is almost entirely reads and thus the Intel drives have no weaknesses. The G2s, G1s, TRIM or not, all perform about the same here. They’re about 10% faster than Samsung and 15% faster than Indilinx. Even the 40GB Kingston does just as well here.


162 Comments
View All Comments
Anand Lal Shimpi - Monday, October 26, 2009 - link
Personally my pick is still the X25-M, it's had a better track record than any of the other controller makers. The problem for Intel is that Indilinx performance and feature set have both gotten a lot better.You now get TRIM, reliable performance, competitive pricing and generally everything but a super dynamic controller that's constantly trying to maximize performance. Depending on the usage scenario though, the latter may not matter as much (see my Photoshop results from the last review or the heavy trace results from this review).
My position hasn't really changed, just highlighting the importance of the issue so that hopefully Intel's value SSDs next year aren't just rebadged G2s :)
Take care,
Anand
7Enigma - Monday, October 26, 2009 - link
I think his previous review is consistent with this one. His ultimate recommendation between Intel and Indlinx drives has remained unchanged. That is, they are close enough that the size differences should be the decider for a potential buyer.As it stands, in most normal usage scenarios the statement from his last article still applies. There are very few times where you are going to be constantly tapping the 80MB/s barrier. More often you will be limited by the other SSD's lower random write speeds.
What his own benchmark can show is that in uncommon circumstances you can sway the bar back towards parity between the brands. I would argue, however, that the "heavy" usage scenario is not a practical one for an SSD. Just read his description again and look for all of the places the average user would NOT be putting that data onto an SSD:
[quote]
In this test we have Microsoft Security Essentials running in the background with real time virus scanning enabled. We also perform a quick scan in the middle of the test. Firefox, Outlook, Excel, Word and Powerpoint are all used the same as they were in the light test. We add Photoshop CS4 to the mix, opening a bunch of 12MP images, editing them, then saving them as highly compressed JPGs for web publishing. Windows 7’s picture viewer is used to view a bunch of pictures on the hard drive. We use 7-zip to create and extract .7z archives. Downloading is also prominently featured in our heavy test; we download large files from the Internet during portions of the benchmark, as well as use uTorrent to grab a couple of torrents. Some of the applications in use are installed during the benchmark, Windows updates are also installed. Towards the end of the test we launch World of Warcraft, play for a few minutes, then delete the folder. This test also takes into account all of the disk accesses that happen while the OS is booting.
The benchmark is 22 minutes long and it consists of 128,895 read operations and 72,411 write operations.
[quote]
How many people are going to be opening photoshop pictures FROM the SSD and saving them TO the SSD? Same goes with Windows Picture Viewer. Most people will have their pics on a standard large mechanical HD which makes this a moot point. Downloading large files from the net? Not a chance that would be going to my SSD! Bottom line is this is a great HELL test, but nowhere close to real-world usage.
The light-usage probably fits 90% of people 90% of the time (completely made up statistic).
With all of that said, I wish Intel's 80gig drive had closer sequencial write performance as the Indilinx drives, as it would make the decision a complete no-brainer. Looking at all the data, and planning on buying a ~$250 drive this holiday season has me very likely picking up an 80gig Intel as for me the price is about as steep as I'm willing to go for essentially a boot drive, with performance that for the majority of the time is at the top of the pack. It would be WAYYYY more difficult to decide if both Intel/Indilinx had the same drive sizes but fortunately we don't have to worry about that (at least for now....)
tynopik - Monday, October 26, 2009 - link
on page 7, all the graphs have two lines labelled 'Intel X25-M G2 80GB (MLC) TRIM'7Enigma - Monday, October 26, 2009 - link
Anand,You have listed the 80gig Intel MLC drive twice in each chart. I'm assuming one of them shouldn't say (TRIM)?
Other than that, GREAT article! Those Kingston drives look to be the PERFECT inexpensive replacement for netbooks/cheaper laptops as the performance is vastly superior to cheap mechanical HD's.
Anand Lal Shimpi - Monday, October 26, 2009 - link
That second 80GB MLC drive was actually a second set of results that didn't get pulled out. I've trimmed em out :)Take care,
Anand
fic2 - Monday, October 26, 2009 - link
"The G1 is more resillient (SIC) than the G2 when it comes to performance degradation over time since it doesn't have TRIM."Is it just me or does this sentence make no sense? I thought the whole purpose of TRIM was to make the SSD more resilient to performance degradation. Seems like it should be:
"The G1 is less resilient..."
klil - Monday, October 26, 2009 - link
The G1 is LESS susceptible to degradation than the G2, Intel compensates this by enabling TRIM on the G2.Anand Lal Shimpi - Monday, October 26, 2009 - link
Correct, my apologies for the confusing wording :)Take care,
Anand
edzieba - Monday, October 26, 2009 - link
"None of the other Indilinx manufacturers have Windows 7 TRIM support yet."Crucial has the TRIM firmware (1819) available for download for their m225 series SSDs.
TheWickerMan - Monday, October 26, 2009 - link
I was just going to post that, but you beat me to it. Here's the link for anyone else interested: http://www.crucial.com/support/firmware.aspx">http://www.crucial.com/support/firmware.aspx