Overclocking Extravaganza: GTX 275's Complex Characteristics
by Derek Wilson on June 4, 2009 5:35 AM EST- Posted in
- GPUs
Pulling it Back Apart: Performance Interactions
Rather than test everything combination of clock speeds and look at scaling as we did in our Radeon HD 4890 overclocking article, we wanted a streamlined way to get a better idea of how combinations clock domain overclocking could help. Our solution was to add only one test configuration and use multiple comparison points to get a better idea of the overall impact of changing multiple clocks at a time.
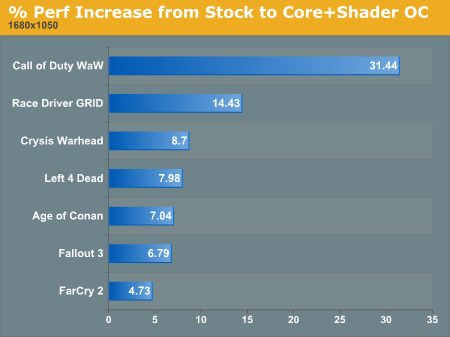
Testing our hardware while overclocking both the core clock and the shader clock gives us four more key comparisons that fill in the gaps between what we've already seen and how the different aspects of the hardware interact with each other. First, and most obviously, we can see how much performance improvement we get beyond stock when overclocking both core and shader clocks.
1680x1050 1920x1200 2560x1600
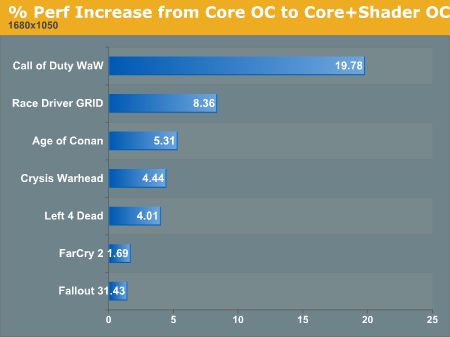
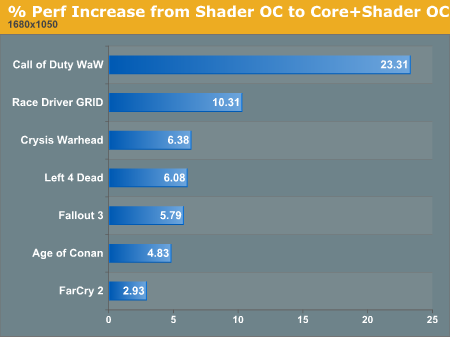
We see higher performance improvement for overclocking both of these at the same time than we do for just overclocking one at a time. And we can break this down into two components in order to answer two different questions: how much faster does overclocking the shaders make the GPU when the core is overclocked, and how much faster does overclocking the core make the GPU when the shaders are already overclocked? These two graphs are very closely related, but they can further help make a decision on how to balance your overclock on NVIDIA hardware.
1680x1050 1920x1200 2560x1600
1680x1050 1920x1200 2560x1600
If we look back and compare our additional performance improvements from increasing either core or shader clock while the other is at maximum, we can get a good idea of how scaling translates in a different landscape. In fact, we see that increasing shader clock speed generally has a larger impact when the core is already overclocked than if the core is set to stock speeds. This could indicate that an increased core clock alleviates some bottleneck on the shader hardware that allows it more breathing room.
We see a similar relationship between core scaling with everything else stock and core scaling with overclocked shaders. This could indicate a reciprocal relationship between the core and shader clocks, meaning that users may typically get a larger benefit from overclocking both at the same time rather than pushing one higher at the expense of the other.
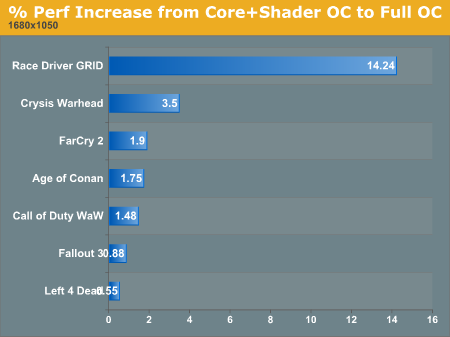
The last question we want to answer with this test is about memory. We saw that overclocking the GTX 275's RAM didn't return much of our investment. But what if both core and memory are overclocked, would memory speed have a larger impact on performance when? If the bottleneck for performance scaling with memory overclocking is in how fast the GPU can consume data, than we might see better performance improvement from memory overclocking when the core and shader are running faster.
1680x1050 1920x1200 2560x1600
These results are certainly interesting, showing, in general, less benefit from moving to 2560x1600 when the GPU is overclocked. We also see less improvement at lower resolution where memory performance isn't as large an issue in the first place (it seems to become even less important). But at 1920x1200, overclocking memory has a higher impact when the GPU is fully overclocked. So at lower resolutions, memory speed isn't as important anyway and the GPU overclock has the prevailing benefit on overall speed. This makes sense. So does the increasing performance at 1920x1200. But the fact that performance improvement we can attribute to faster memory at 2560x1600 is lower with a faster core and shader clocks is a bit of an enigma.
While we can get a better feel for the effects of tweaking different aspects of the chip through these glimpses into scaling, it's still not possible from this data to definitively pin down the interactions between core, shader and memory clock speed. The benefit to different games is dependent on their demand for resources, and there's no real formula for knowing what you will get out.
But the thing to take away is that overclocking the GTX 275 should be done with balance between the three clocks in mind. No single aspect is a magic bullet, and NVIDIA has balanced things pretty well already. Maintaining the balance is the key to extracting good performance improvement when overclocking the GTX 275.
That sums up our analysis of overclocking the GTX 275. The following pages are our raw data for those more interested in direct/absolute comparisons.


43 Comments
View All Comments
Hrel - Friday, June 5, 2009 - link
Wow, I guess the guys who programmed WAW and Race Driver did a REALLY crappy job at resource allocation; 30 percent compared to about 8 percent from Left 4 Dead; pretty terrible programming.MonsterSound - Friday, June 5, 2009 - link
I too like the 'change-in-place' resolution graphs, but have to agree that they would be better if the scale was consistent.As far as the 702mhz OC on your 275, that seems like a weak attempt. The retail evga 275 ftw model for example has been binned as an overclocker and stock speed is 713mhz. My MSI 275 FrozrOC is running at 735mhz right now. I can't seem to find mention of which models of the 275 you were testing with, but obviously not the fastest.
respectfully,...
Anonymous Freak - Thursday, June 4, 2009 - link
While I love the 'change-in-place' resolution graphs, they really need to be consistent. Leave games in the same location vertically; and keep the same scale horizontally. That way I can tell at an instant glance what the difference is. I don't like having the range switch from 0-15 to 0-7 to 0-10, plus changing the order of the games, when I click the different resolutions!After all, the only difference that matters on the graphs is the one the individual bars represent. So why go changing the other aspects? Yes, it's "pretty" to have the longest bar the same length, and to always have the graph sorted longest-on-top; but it makes the graph less readable.
For the few graphs that have a bunch of values clustered near each other, plus one or two outliers, just have the outliers run off the edge. For example, in most of your one-variable graphs, a range of 0-10% would be sufficient. Just make sure that for a given resolution set, the range is the same.
yacoub - Thursday, June 4, 2009 - link
This article completely kicks butt! It includes everything I'd want to see in charts, including both % gains and the actual FPS numbers versus other cards, and all with the three most important resolutions.Very, very good article. Please keep up this level of quality - the data and the depth really answer all the major questions readers and enthusiasts would have.
chizow - Thursday, June 4, 2009 - link
Nice job Derek, I've been lobbying for a comparison like this since G80 but nice to see a thorough comparison of the different clock domains and impact on performance.As I suggested in some of your multi-GPU round-up articles, it'd be nice to see similar using CPU clockspeed scaling with a few different types of CPU, say a single i7, a C2Q 9650 and a PII 955 for example, then test with a fast single GPU and observe performance difference at different clockspeeds.
It'd also be interesting to see some comparisons between different GPUs, say 260 to 275 to 280/285 at the same clockspeeds to measure the impact of actual physical differences between the GPU versions.
spunlex - Thursday, June 4, 2009 - link
It looks like a stock GTX 275 beats the 280 in almost every benchmark even at stock speed. Does anyone have any explanation as to why this is happening??I guess GTX 280 sales will be dropping quiet a bit now
PrinceGaz - Thursday, June 4, 2009 - link
This whole idea of the three seperate overclocks (core, shader, memory) being able to simultaneously provide almost their full percentage increase to any single result cannot possibly be right.Imagine you take the situation where a card is overclocked by 10% throughout (instead of 11%, 14%, 18% like you did). Core up 10%. Shaders up 10%. Memory up 10%. Going from your numbers, that would probably have given you about a 20% performance increase in two of the games! Do you really expect us to believe a graphics-card running 10% faster, can give a 20% performance boost to the overall framerate?
How does magically making Core and Shader seperate overclocks allow them to work together to nearly double their effect. If it worked that way, you could split the card up into twenty seperate individually overclockable parts, overclock them all by 10%, and end up with something giving over 3x the performance-- all from a 10% overclock :p
Something else must be happening in addition to what you are doing, and my first priority would be to check the actual speeds the card is running at using a third-party utility which reports not the speed the clocks have been set to, but the actual speed the hardware is running at (I believe RivaTuner does that in real-time in its hardware-monitor charts).
DerekWilson - Thursday, June 4, 2009 - link
I used rivatuner to check the clock speeds. i made very sure things were running at exactly the speeds I specified. At some clocks, the hardware would sort of "round" to the next available clock speed, but the clocks I chose all actually reflect what is going on in hardware.I do see what you are saying, but it doesn't work either the way you think it should or the way that you claim my logic would lead it be. Extrapolating the math I used (which I believe I made clear was not a useful judge of what to expect, but an extreme upper bound that is not achievable) is one thing, but that isn't what is actually "happening" and I don't believe I stated that it was.
Like I said, it is impossible for the hardware to achieve the full theoretical benefit from each of its overclocked subsystems as this would imply that performance was fully limited by each subsystem, which it just not possible.
If I was confusing on that point then I do apologize.
Here's what I know, though: 1) the reported clock speeds are the clock speeds the hardware was actually running at and 2) the performance numbers are definitely correct.
I fully realize I didn't do a good job of explaining why the two above points are both true ... mostly because I have no idea why.
I tried to paint the picture that what actually happened was not impossible, while (I thought) making it clear that I don't actually know what causes the observed effect.
Kibbles - Thursday, June 4, 2009 - link
Great article. I especially liked the 3 linked graphs. One question though. I've been wondering how much power the lastest graphics cards use when you underclock them to the lowest possible while idling, or does the hardware do it automatically? For example, I have my 2D mode on my 8800gtx set to only 200mhz core/shader/memory using nibitor. Or would it matter?DerekWilson - Thursday, June 4, 2009 - link
All the current gen cards do significantly underclock and undervolt themselves in 2D mode. They also turn off parts of the chip not in use.I believe you can set the clocks lower, but the big deal is the voltage as power is proportional to frequency but proportional to the square of voltage. I don't /think/ it would make that much difference in 2D mode, but then it's been years since I tried doing something like that.